. 2024 Mar 15;9(93):eadj4775.
doi: 10.1126/sciimmunol.adj4775. Epub 2024 Mar 15.

Gut bacteria-derived serotonin promotes immune tolerance in early life

Affiliations

Gut bacteria-derived serotonin promotes immune tolerance in early life

Katherine Z Sanidad et al. Sci Immunol. .

Abstract

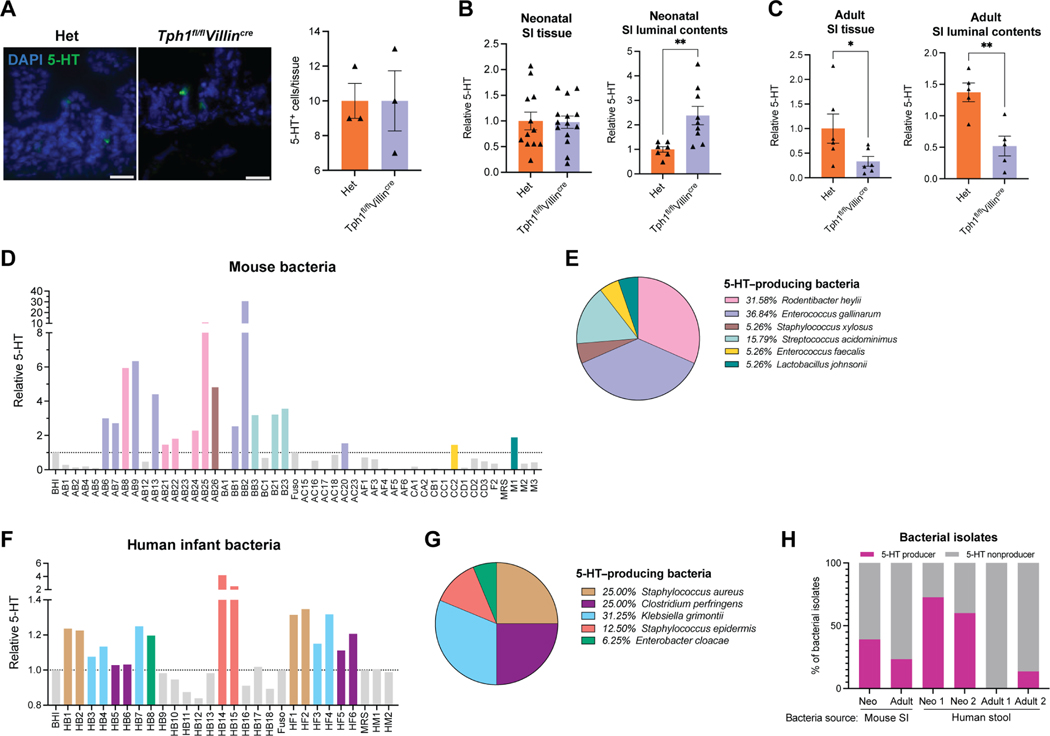
The gut microbiota promotes immune system development in early life, but the interactions between the gut metabolome and immune cells in the neonatal gut remain largely undefined. Here, we demonstrate that the neonatal gut is uniquely enriched with neurotransmitters, including serotonin, and that specific gut bacteria directly produce serotonin while down-regulating monoamine oxidase A to limit serotonin breakdown. We found that serotonin directly signals to T cells to increase intracellular indole-3-acetaldehdye and inhibit mTOR activation, thereby promoting the differentiation of regulatory T cells, both ex vivo and in vivo in the neonatal intestine. Oral gavage of serotonin into neonatal mice resulted in long-term T cell-mediated antigen-specific immune tolerance toward both dietary antigens and commensal bacteria. Together, our study has uncovered an important role for specific gut bacteria to increase serotonin availability in the neonatal gut and identified a function of gut serotonin in shaping T cell response to dietary antigens and commensal bacteria to promote immune tolerance in early life.


Conflict of interest statement

Competing interests: The authors declare that they have no competing interests.

Figures

Fig. 1.
Fig. 1.. Enrichment of neurotransmitters in the neonatal intestine.
(A) Heatmap of ~500 metabolites in SI luminal contents of SPF adult and neonatal mice through high-throughput metabolomics analyses. (B) Volcano plot representing fold change of metabolites abundant in SI luminal contents of adult and neonatal mice. (C) Concentrations of specific metabolites from high-throughput metabolomics data in adult and neonatal SIs. (D) Volcano plot representing fold change of KEGG pathways associated with SI luminal metabolites between adult or neonatal mice. All data represent one independent experiment with n = 4 adult mice (A) and n = 4 neonatal mice (N). Statistical tests performed: unpaired t test in (C). **P < 0.01, ***P < 0.001, ****P < 0.0001. Adult mice age > 8 weeks, neonatal mice age = P14. See also table S2.
Fig. 2.
Fig. 2.. Serotonin (5-HT) biosynthesis in the neonatal intestine is driven by the gut microbiota.
(A) 5-HT synthesis pathway in the gut and concentrations of tryptophan (Trp), 5-HT, and 5HIAA in adult and neonatal SIs. (B and C) Concentrations of 5-HT in SPF and GF adult (>8 weeks old) and neonatal (P14) mice measured by LCMS in luminal contents of (B) SI and (C) colon. (D) Immunofluorescence staining of 5-HT in the SIs of SPF and GF neonatal mice. (E) RT-qPCR analysis of Tph1, Maoa, and Slc6a4 gene expression in SIs of SPF/GF adult and neonatal mice. (F) RT-qPCR analysis of Tph1 and Tph2 relative gene expression in SIs of SPF neonatal mice. (G) Western blot analysis and (H) immunofluorescence staining of MAO-A in SIs of SPF and GF neonatal mice. (I) Ratio of TPH1:MAOA expression in HT-29 colon cells treated with supernatants of bacterial isolates from neonatal mouse SIs. Significance is shown compared with no bacteria control (cells not treated with bacterial supernatant); # designates isolates used for in vivo experiments. (J and K) (J) RT-qPCR analysis of the ratio of Tph1:Maoa expression in SIs of P16 GF neonatal mice monocolonized with designated isolates in Fig. 2I. (K) 5-HT concentrations in SI luminal contents of P16 mice monocolonized with designated isolates in Fig. 2I measured by ELISA. (A) One independent experiment with n = 4 adult mice (A) and n = 4 neonatal mice (N). Data in (B), (C), (E), and (F) are compiled from two independent experiments with n = 6 for SPF adults and SPF neonates and n = 8 for GF adult and n = 7 for GF neonates. (G) Representative of two independent experiments with n = 4 for SPF and GF. (I) Two independent experiments with n = 1 to 3 for each bacterial experiment. Data in (J) and (K) were compiled from two independent experiments with n = 6 for GF, n = 10 for R. heylii AB21, and n = 11 for E. faecalis CD2. Statistical tests performed: unpaired t test for (A) and (G); two-way ANOVA with Tukey’s multiple comparisons test for (B) to (E); Mann-Whitney test for (F); and one-way ANOVA with Dunnett’s multiple comparisons test for (I). *P < 0.05, **P < 0.01, ***P < 0.001, ****P < 0.0001. Adult mice age > 8 weeks, neonatal mice age = P14. White scale bars, 50 μm. See also fig. S1 and table S3.
Fig. 3.
Fig. 3.. Gut bacteria are the major 5-HT producers in the neonatal intestine.
(A) Representative images of immunofluorescence staining of 5-HT in SIs of Tph1fl/flVillincre neonatal (2 weeks old) mice or heterozygous (Het) littermates and quantification of 5-HT stained cells/tissue. White scale bars, 50 μm. (B and C) ELISA analysis of 5-HT concentrations in SI tissue and luminal contents of (B) neonatal or (C) adult Tph1fl/flVillincre mice or Het littermates. (D) ELISA analysis of 5-HT in supernatants of bacteria isolated from SIs of neonatal mice. (E) Percentage of bacterial isolates from SIs of neonatal mice capable of producing 5-HT. (F) ELISA analysis of 5-HT in supernatants of bacteria isolated from stool of term healthy infants without antibiotics. (G) Percentage of bacterial isolates from stool of term healthy infants without antibiotics capable of producing 5-HT. (H) ELISA measurement of 5-HT concentrations in SI luminal contents of GF P2 mice monocolonized with AB25 or CD2 isolates after 2 weeks. Data for all experiments are compiled from two independent experiments. For (A), n = 3 for each group. For (B), n = 7 to 12 for Het and n = 9 to 14 for Tph1fl/flVillincre. For (C), n = 5 or 6 for each group. For statistical tests performed: unpaired t test for (A); unpaired t test and unpaired t test with Welch’s correction for (B); Mann-Whitney test and unpaired t test for (C). **P < 0.01. Adult mice age > 6 weeks. Neonatal mice age = 2 weeks. See also fig. S2 and table S3.
Fig. 4.
Fig. 4.. 5-HT promotes Treg development in vitro and in vivo in the neonatal SI.
(A) Representative flow plots (top) and flow cytometry analysis (bottom) of Tregs isolated from the LP of SIs and colons of SPF (n = 8) and GF (n = 9) neonatal (2 weeks old) mice. (B) Heatmap of relative metabolite concentrations in SIs of SPF adult (>8 weeks old, n = 4) and neonatal (2 weeks old, n = 4) mice. (C) Flow cytometry analysis of Tregs isolated from LP of SIs of SPF WT (n = 5) and Ffar2−/−Ffar3−/− (n = 5) neonatal mice. (D) Schematic of experiment of GF neonatal mice orally treated with PBS or 5-HT. (E) Flow cytometry analysis of the SI LP cells GF neonatal mice orally gavaged with PBS (n = 10 to 12) or 5-HT (n = 11 or 12). (F) Flow cytometry analysis of CD4+ cells isolated from the SI LP of GF neonatal mice exposed to SSRI (fluoxetine, 1 mg/kg b.w., n = 5) or water (n = 6) via oral gavage of dams daily from P8 to P18. (G) Flow cytometry analysis of mouse splenic CD4+ T cells stimulated with 5-HT (n = 3 per group) for 48 hours ex vivo. (H) Seahorse real-time cell metabolic analysis of oxygen consumption rate (left) and maximal respiration (right; AUC calculated between 40 and 60 min) of mouse splenic T cells stimulated with 5-HT for 3 hours in vitro. (I) Flow cytometry analysis of mouse naïve CD3+ P-RPS6+ splenic T cells stimulated with 5-HT for 24 hours (n = 4 per group). (J) Volcano plot representing fold change of intracellular metabolites detected through unbiased metabolic profiling of 5-HT– or PBS-treated mouse splenic CD3+ T cells. (K) Flow cytometry analysis of P-RPS6+ naïve CD3+ or naive CD4+ T cells from mLN stimulated ex vivo with I3A or vehicle control for 24 hours (n = 4 or 5 per group). (L) Flow cytometry analysis of SI LP cells from GF neonatal mice orally gavaged with I3A (n = 3) or vehicle control (n = 4). Data in (A), (E) to (G), and (K) are compiled from two independent experiments. Data in (C), (H), (I), and (L) are representative of two independent experiments. Statistical tests performed: unpaired t test, unpaired t test with Welch’s correction, or Mann-Whitney test for (A), (C), (E), (F), and (L). One-way ANOVA with Tukey’s multiple comparisons test or Holm-Sidak’s multiple comparison test for (G), (I), and (K). *P < 0.05, **P < 0.01, *** P < 0.001. Neonatal mice age = 2 weeks. See also figs. S3 to S6.
Fig. 5.
Fig. 5.. 5-HT in the neonatal gut promotes long-term immune tolerance to oral antigens.
(A) Schematic of mouse model of oral tolerance to OVA. (B) ELISA analysis of OVA-specific IgG and IgE in plasma and (C) flow cytometry analysis of immune cells in spleens of mice used in a model of oral tolerance to OVA (n = 3 to 7 for Ctrl, n = 5 to 10 for PBS, and n = 5 to 9 for 5-HT). (D) Schematic of mouse model of adoptive transfer of Tregs (CD45+CD3+CD4+CD25+CD44hiCD62Llo) isolated from spleens and mLNs of 5-HT– or PBS-treated OVA-sensitized mice to new GF mice that were then challenged to OVA. (E) ELISA analysis of OVA-specific IgG in plasma of mice used in mouse model shown in (D) (n = 5 or 6 per group). (F) Schematic of mouse model of 5-HT– or PBS-treated OVA-sensitized GF mice challenged with HA influenza protein. (G) ELISA analysis of HA-specific IgG in plasma of mice used in mouse model shown in (F) (n = 4 per group). Data in (B), (C), and (E) were compiled from two independent experiments. Data in (G) are representative of two independent experiments. One-way ANOVA with Tukey’s multiple comparison test or Holm-Šidák’s multiple comparison test was performed for (B), (C), and (E). Two-way ANOVA with uncorrected Fisher’s LSD multiple comparison test was performed for (G). *P < 0.05, **P < 0.01. See also fig. S7.
Fig. 6.
Fig. 6.. 5-HT in the neonatal gut promotes immune tolerance to gut commensal bacteria.
(A) Schematic of the experimental design to test the role of 5-HT in immune tolerance to commensal bacteria. GF neonates from the same litter were gavaged with 5-HT or PBS at P8 and P9 and remained cohoused through P28. At P14, the biological dam was orally gavaged with gut luminal and fecal bacteria from P14 SPF WT neonates (to allow transfer of bacteria to the offspring). All the mice were housed in the same cage. At P28, gut immune cells and microbiome were analyzed. (B and C) Flow cytometry analysis of immune cells from laminal propria of the (B) SI and (C) colon of GF mice given 5-HT or PBS and colonized with commensal bacteria. (D) NMDS analysis of 16S rRNA sequencing data of gut microbiota of mice treated with PBS or 5-HT (n = 4 or 5 per group). (E and F) 16S rRNA sequencing data of (E) relative abundance of genera and (F) LDA and relative abundance of specific bacteria (labels represent bacteria with highest homology) in SIs and colons of mice given 5-HT or PBS (n = 4 or 5 per group). (G) Schematic of T cell colitis mouse model. Naïve T cells (CD45+CD3+CD44loCD62Lhi) were isolated from spleens and mLNs. (H) Colons and colon lengths of mice used in T cell colitis mouse model (n = 4 per group). (I) Flow cytometry analysis of immune cells from the mLNs of mice used in T cell colitis mouse model (n = 4 per group). *P < 0.05, *P < 0.01. Data in (B) and (C) were compiled from two independent experiments. Data in (D) to (F), (H), and (I) are representative of two independent experiments. Statistical tests performed: one-way ANOVA with Holm-Šidák’s multiple comparisons test or Dunn’s multiple comparisons test for (B) and (C); unpaired t test for (H) and (I). See also fig. S8.

References

    1. Belkaid Y, Hand TW, Role of the microbiota in immunity and inflammation. Cell 157, 121–141 (2014). - PMC - PubMed
    1. Milani C, Duranti S, Bottacini F, Casey E, Turroni F, Mahony J, Belzer C, Delgado Palacio S, Arboleya Montes S, Mancabelli L, Lugli GA, Rodriguez JM, Bode L, de Vos W, Gueimonde M, Margolles A, van Sinderen D, Ventura M, The First Microbial colonizers of the human gut: Composition, Activities, and Health Implications of the infant gut microbiota. Microbiol. Mol. Biol. Rev. 81, (2017). - PMC - PubMed
    1. Backhed F, Roswall J, Peng Y, Feng Q, Jia H, Kovatcheva-Datchary P, Li Y, Xia Y, Xie H, Zhong H, Khan MT, Zhang J, Li J, Xiao LJ,Zhang YS, Kotowska D, Colding C, Tremaroli V, Yi Y, Bergman S, Xu X, Madsen L, Kristiansen K, Dahlgren J, Wang J, Dynamics and stabilization of the human gut microbiome during the first year of life. Cell Host Microbe 17, 690–703 (2015). - PubMed
    1. Sharon G, Cruz NJ, Kang DW, Gandal MJ, Wang B, Kim YM, Zink EM, Casey CP, Taylor BC, Lane CJ, Bramer LM, Isern NG, Hoyt DW, Noecker C, Sweredoski MJ, Moradian A, Borenstein E, Jansson JK, Knight R, Metz TO, Lois C, Geschwind DH, Krajmalnik-Brown R, Mazmanian SK, Human gut microbiota from autism spectrum disorder promote behavioral symptoms in mice. Cell 177, 1600–1618.e17 (2019). - PMC - PubMed
    1. Levan SR, Stamnes KA, Lin DL, Panzer AR, Fukui E, McCauley K, Fujimura KE, McKean M, Ownby DR, Zoratti EM, Boushey HA, Cabana MD, Johnson CC, Lynch SV, Elevated faecal 12,13-diHOME concentration in neonates at high risk for asthma is produced by gut bacteria and impedes immune tolerance. Nat. Microbiol. 4, 1851–1861 (2019). - PMC - PubMed

Publication types