. 2024 Mar 15;10(11):eadk7160.
doi: 10.1126/sciadv.adk7160. Epub 2024 Mar 15.

Coactivator condensation drives cardiovascular cell lineage specification

Affiliations

Coactivator condensation drives cardiovascular cell lineage specification

Peiheng Gan et al. Sci Adv. .

Abstract

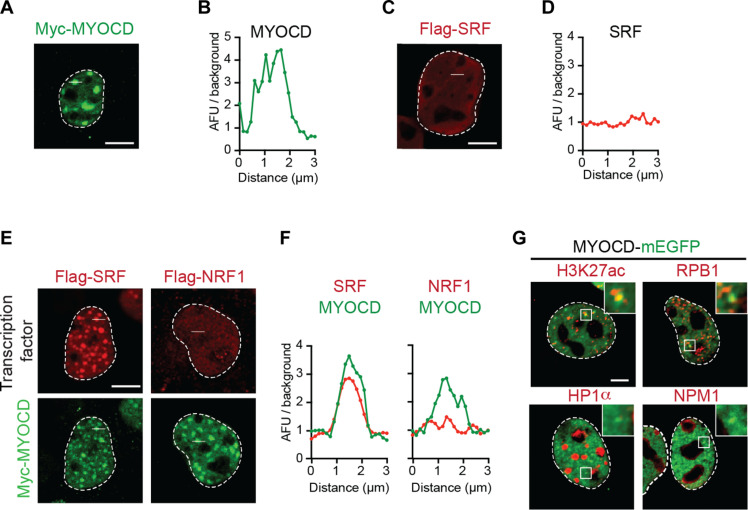
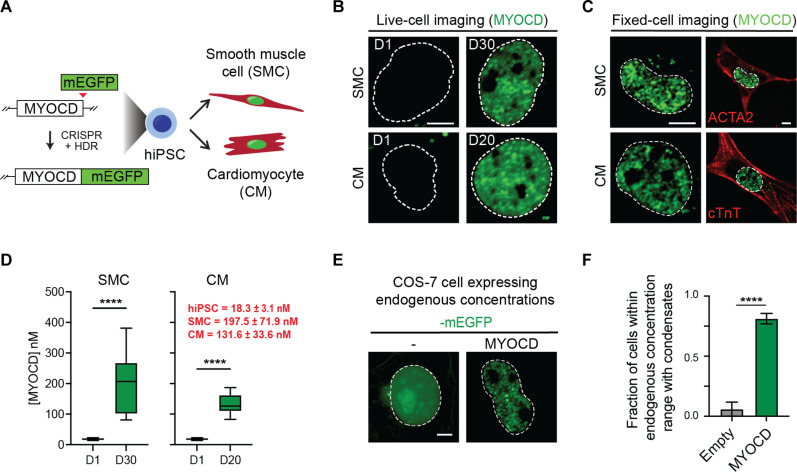
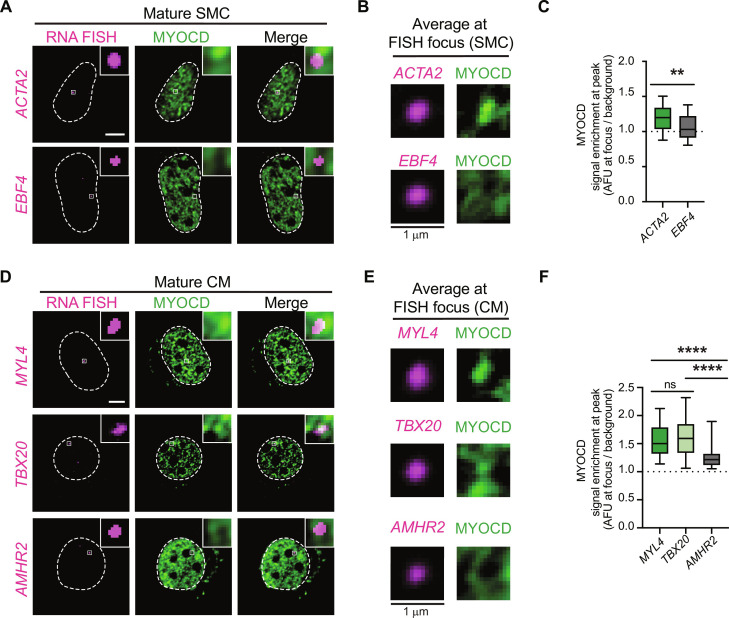
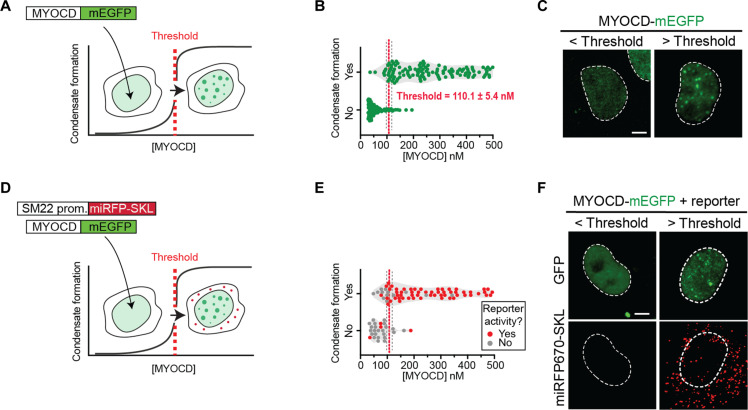
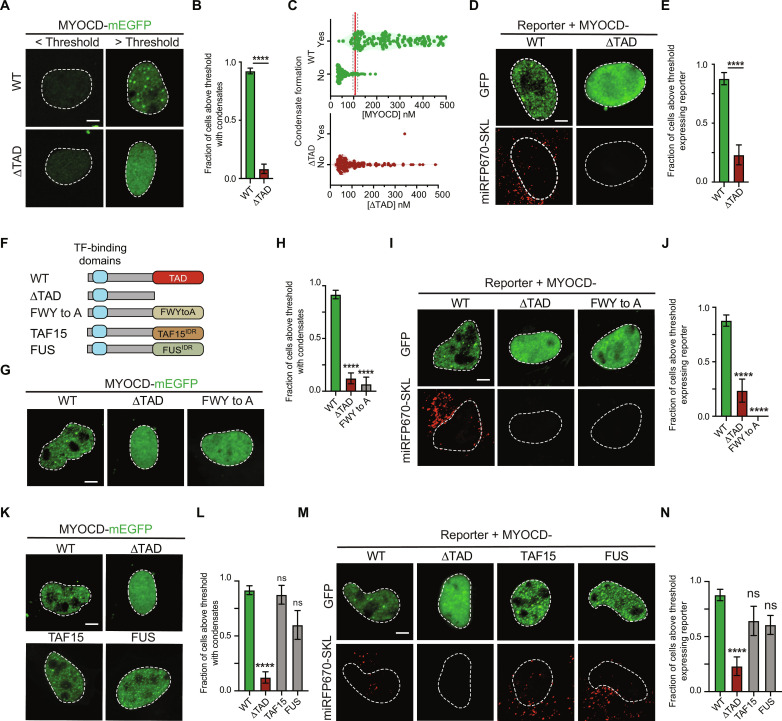
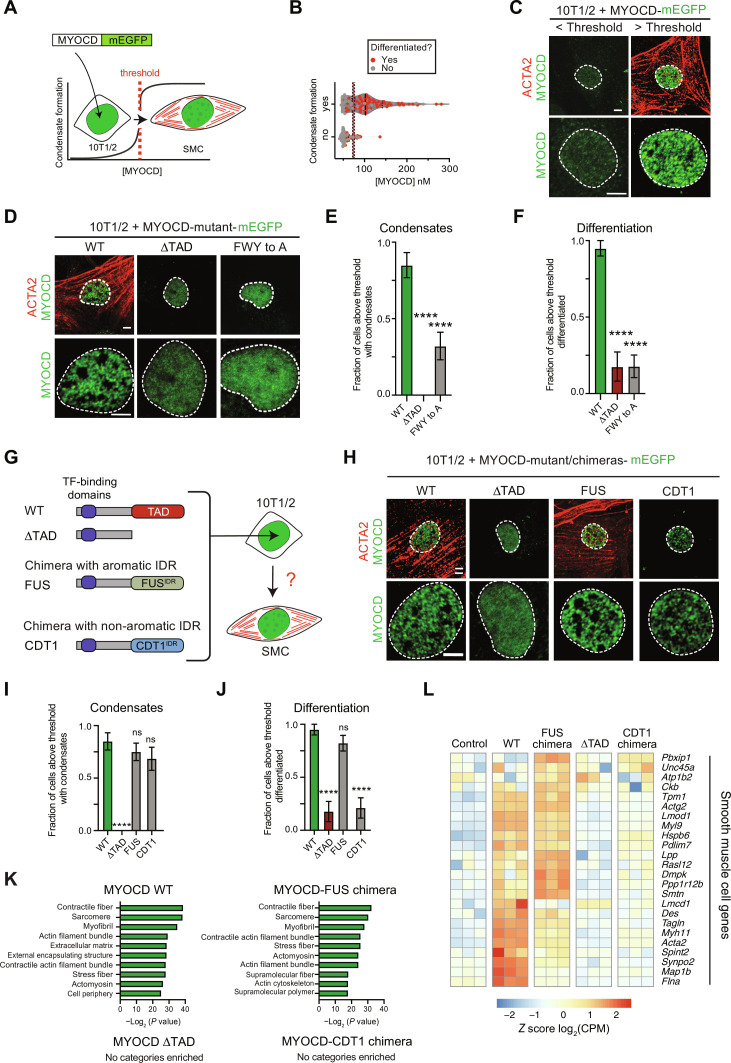
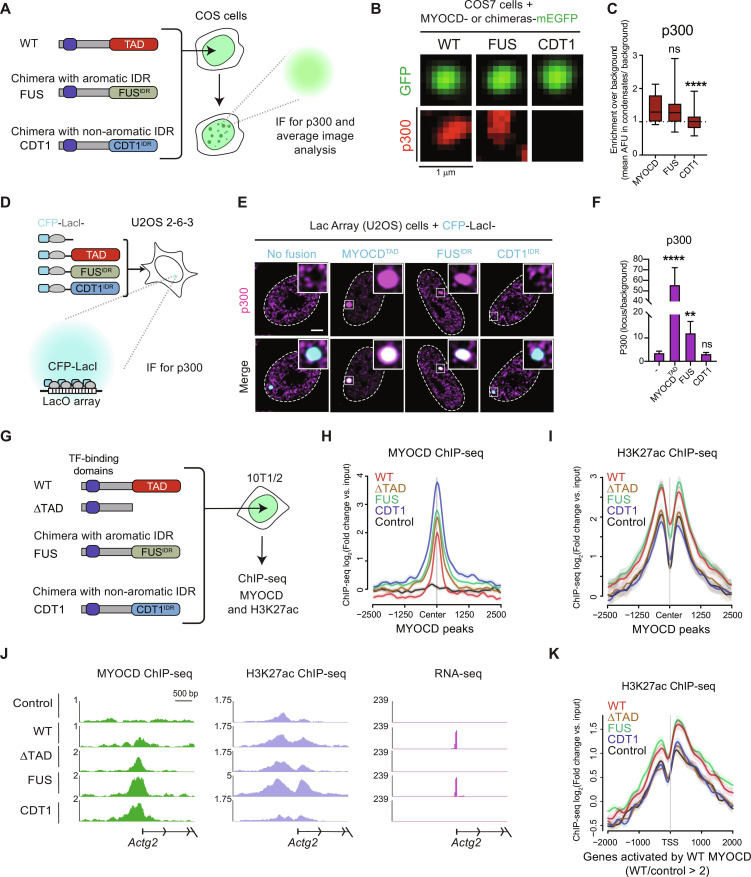
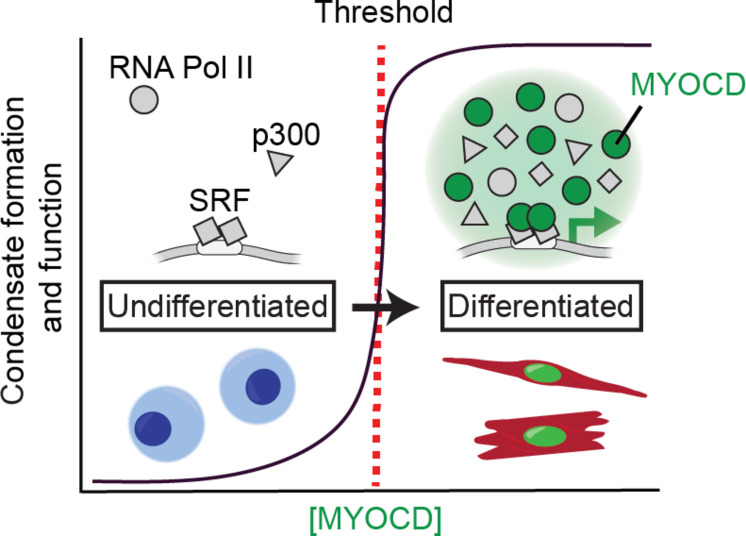
During development, cells make switch-like decisions to activate new gene programs specifying cell lineage. The mechanisms underlying these decisive choices remain unclear. Here, we show that the cardiovascular transcriptional coactivator myocardin (MYOCD) activates cell identity genes by concentration-dependent and switch-like formation of transcriptional condensates. MYOCD forms such condensates and activates cell identity genes at critical concentration thresholds achieved during smooth muscle cell and cardiomyocyte differentiation. The carboxyl-terminal disordered region of MYOCD is necessary and sufficient for condensate formation. Disrupting this region's ability to form condensates disrupts gene activation and smooth muscle cell reprogramming. Rescuing condensate formation by replacing this region with disordered regions from functionally unrelated proteins rescues gene activation and smooth muscle cell reprogramming. Our findings demonstrate that MYOCD condensate formation is required for gene activation during cardiovascular differentiation. We propose that the formation of transcriptional condensates at critical concentrations of cell type-specific regulators provides a molecular switch underlying the activation of key cell identity genes during development.


Figures

Fig. 1.
Fig. 1.. MYOCD nuclear condensates are associated with components of active transcription.
(A) Immunofluorescence (IF) imaging of Myc-tagged MYOCD ectopically expressed in COS-7 cells with Myc antibody targeting the epitope. Scale bar, 5 μm. (B) Line profile plot presented as arbitrary fluorescence units (AFU)/background across the 3-μm white line shown in (A). (C) IF imaging of Flag-tagged SRF ectopically expressed in COS-7 cells with Flag antibody targeting the epitope. Scale bar, 5 μm. (D) Line profile plot presented as AFU/background across the 3-μm white line shown in (C). (E) IF imaging of Myc-tagged MYOCD and other transcription factors (Flag-tagged SRF and Flag-tagged NRF1) coexpressed in COS-7 cells. Scale bar, 5 μm. (F) Line profile plot presented as AFU/background for either MYOCD (green) or the indicated coexpressed transcription factor (red) across the 3-μm white line shown in (E). (G) Representative micrographs of COS-7 cells expressing MYOCD-mEGFP (green) and co-IF for factors, including H3K27ac, RPB1, HP1α, and NPM1 (red). Scale bar, 5 μm.
Fig. 2.
Fig. 2.. MYOCD forms condensates during hiPSC differentiation into SMCs and CMs.
(A) Schematic of the creation of MYOCD-mEGFP knock-in hiPSC line and differentiation of hiPSCs into SMCs and CMs. (B) Live-cell imaging of endogenously tagged MYOCD-mEGFP in differentiation day 1 (D1) and mature hiPSC-derived SMC (D30) and CM (D20) nuclei. Scale bar, 5 μm. Dotted line denotes the nucleus, drawn using Hoechst 33342 staining (not shown). (C) Co-IF of MYOCD-mEGFP with smooth muscle α-actin (ACTA2) or cardiac troponin T (cTnT) in either mature hiPSC-derived SMCs and CMs, as labeled. Left column is zoomed in to highlight MYOCD condensates, and only the GFP channel is presented. Scale bar, 5 μm. Right column is zoomed out of the same cell to highlight cell body with cell marker stain. Scale bar, 5 μm. (D) Box plot (10 to 90%) of the concentration of MYOCD in hiPSCs compared to mature SMCs (left) or mature CMs (right). Red text denotes concentration of MYOCD as mean ± SD. P values from t test, ****P ≤ 0.0001. n = 10. (E) Representative micrographs (max projections) of COS-7 cells expressing mEGFP or MYOCD-mEGFP. The nuclear concentration of MYOCD-mEGFP in this micrograph is 124.6 nM, equivalent to physiological concentrations in SMCs and CMs, as shown in (D). The nuclear concentration of the mEGFP control is 718.9 nM. Dotted line defines nucleus from Hoechst 33342 staining (not shown). Scale bar, 5 μm. (F) Bar chart of the fraction of cells with condensates between the concentration range of MYOCD in SMCs and CMs, 98.0 to 268.4 nM [± SD of mean concentration measured in SMC and CM in (D)]. Condensates are identified by automated analysis pipeline. Data are mean ± SEM. P values from t test, ****P ≤ 0.0001. n ~ 25.
Fig. 3.
Fig. 3.. MYOCD condensates are sites of cell identity gene transcription.
(A) RNA FISH and IF in mature SMC nuclei for indicated nascent transcript (magenta) and MYOCD (GFP). Square box denotes location of crop shown in top right. Scale bar, 5 μm. (B) Average signal of indicated nascent transcript (magenta) or MYOCD (GFP) centered on the nascent transcript focus (1.5 μm2) in SMC. n ~ 25. (C) Boxplot (mean ± 10 to 90%) showing enrichment of MYOCD at either the center of the nascent transcript foci or at random sites in SMCs. P values represent results of t test followed (P values: **P ≤ 0.01). (D) RNA FISH and IF in mature CM nuclei for RNA of indicated transcript (magenta) and MYOCD (GFP). Square box denotes location of crop shown in top right. Scale bar, 5 μm. (E) Average signal of indicated nascent transcript (magenta) or MYOCD (GFP) centered on the nascent transcript focus (1.5 μm2) in CM. n ~ 25. (F) Boxplot (mean ± 10 to 90%) showing enrichment of MYOCD either at the center of the nascent transcript foci or at random sites in CMs. P values represent results of Kruskal-Wallis test followed by Dunn’s test for multiple comparisons (P values: ns P > 0.05, ****P ≤ 0.0001).
Fig. 4.
Fig. 4.. Formation of MYOCD condensates activates reporter gene expression.
(A) Schematic showing that MYOCD-mEGFP forms nuclear condensates (green) in COS-7 cells in a concentration-dependent manner. (B) Violin plot of MYOCD concentration and condensate formation in COS-7 cells where each dot represents one nucleus. Threshold is determined by a simple logarithmic regression analysis and represented by X at 50% ± SD. P values from t test, ****P ≤ 0.0001. Five biological replicates total. n = 292. (C) Representative micrographs (max projections) of COS-7 cells expressing MYOCD-mEGFP below or above the critical concentration threshold demonstrated in (B). Scale bar, 5 μm. (D) Schematic showing that the formation of condensates (green) is coupled to the expression of the SM22 promoter-driven fluorescent reporter trafficked to peroxisomes (miRFP670-SKL, red). (E) Violin plot of MYOCD concentration and condensate formation where each dot represents one nucleus. Cells expressing reporter shown in red and cells not expressing reporter shown in gray. n = 48. (F) Representative micrographs (max projections) of COS-7 cells expressing MYOCD-mEGFP below or above the critical concentration threshold showing either MYOCD (GFP) or the fluorescent reporter (miRFP670-SKL, shown in red). Brightness and contrast of displayed micrographs are equivalent unless otherwise stated. Scale bar, 5 μm.
Fig. 5.
Fig. 5.. Aromatic residues are required for MYOCD condensate formation and reporter gene expression.
(A) Representative micrographs (max projections) of COS-7 cells expressing MYOCD-mEGFP WT or ΔTAD below or above the critical concentration threshold. Scale bar, 5 μm. (B) Bar chart of the fraction of cells with condensates. Data are mean ± SEM. P values from Mann-Whitney test, ****P ≤ 0.0001. Three biological replicates total, n = 292 (WT) and 106 (ΔTAD). (C) Violin plot of MYOCD concentration and condensate formation in COS-7 cells expressing MYOCD WT or ΔTAD, where each dot represents one nucleus. (D) Representative micrographs (max projections) of COS-7 cells expressing MYOCD-mEGFP WT or ΔTAD above the critical concentration threshold. Scale bar, 5 μm. (E) Bar chart of the fraction of cells with condensates. Data are mean ± SEM. P values from Mann-Whitney test, ****P ≤ 0.0001. n ~ 40. (F) Schematic of MYOCD WT, ΔTAD, aromatic substitution to alanine (FWYtoA) mutants, and TAD domain chimeras with indicated disordered region (FUS and TAF15) with transcription factor (TF)–binding domains (blue box). See fig. S5A for detailed domain architecture of MYOCD. (G and K) Representative micrographs of COS-7 cells expressing indicated MYOCD variants above the critical concentration threshold. (H and L) Bar chart of the fraction of cells with condensates. Data are mean ± SEM. P values represent results of one-way analysis of variance (ANOVA) with Dunn’s multiple comparison test (P values: ns P ≥ 0.05, ****P ≤ 0.0001). (H) n ~ 20. (l) n ~ 15. (I and M) Representative micrographs (max projections) of COS-7 cells expressing the fluorescent reporter and the indicated MYOCD variant above the critical concentration threshold. Scale bar, 5 μm. (J and N) Bar chart of the fraction of cells expressing reporter. Data are mean ± SEM. P values from one-way ANOVA with Dunn’s multiple comparison test (P values: ns P ≥ 0.05, ****P ≤ 0.0001). (I) n ~ 40. (N) n ~ 20.
Fig. 6.
Fig. 6.. Multivalent interactions of aromatic residues are required for MYOCD condensate formation and 10T1/2 reprogramming to SMC.
(A) Schematic showing the correlation of MYOCD-mEGFP nuclear condensate formation (green) to the reprogramming of 10T1/2 cells (fibroblasts) into SMCs (ACTA2 in red). (B) Violin plot of MYOCD concentration and condensate formation in 10T1/2 cells, where each dot represents one nucleus. Dots shown in red denote cells that differentiated; dots shown in gray denote cells that did not differentiate. Threshold is determined by simple logarithmic regression analysis and represented by X at 50% ± SD. Two biological replicates, total n = 188. (C) Representative micrographs (max projections) of 10T1/2 cells expressing MYOCD-mEGFP (green) below or above the critical concentration threshold demonstrated in (B). IF for ACTA2 (red) denotes SMC differentiation. Scale bar, 5 μm. (D and H) Representative micrographs (max projections) of 10T1/2 cells expressing MYOCD-mEGFP (green) and indicated variants. Scale bar, 5 μm. (E, F, I, and J) Bar chart (mean ± SEM) displaying the fraction of cells above the critical MYOCD concentration threshold that form condensates (E and I) or differentiated (F and J). P value from one-way ANOVA with Dunnett’s multiple comparison test (P values: ns P ≥ 0.05, ****P ≤ 0.0001). n = 40. (G) Schematic of MYOCD WT, ΔTAD, and TAD domain chimeras with indicated disordered regions (FUS and CDT1) with transcription factor–binding domains. (K) Panther GO analysis for cellular component of differentially expressed genes from 10T1/2 cells expressing indicated construct with greater than or equal to a threefold increase of expression as compared to the empty vector control. (L) Heatmap of the differential expression [shown as z score of log2(CPM)] of crucial cardiovascular SMC genes. Data are from RNA-seq for indicated constructs upon overexpression in 10T1/2 cells.
Fig. 7.
Fig. 7.. Condensates formed by MYOCD TAD domain and FUS-IDR selectively partition the histone acetyltransferase p300, but CDT1-IDR does not.
(A) Schematic of experimental design for colocalization of p300 in MYOCD condensates. (B) Average projection of WT MYOCD or chimeric condensates in COS-7 cells with IF for endogenous p300. Scale bar, 1 μm. (C) Box plot (10 to 90%) displaying the enrichment of p300 at the center of the MYOCD condensates normalized to background intensity. P value is from one-way ANOVA with Dunnett’s multiple comparison test (P values: ns P > 0.05, ***P ≤ 0.001, ****P ≤ 0.0001). n ~ 25. (D) Schematic of Lac array cells. (E) IF for p300 (magenta) in Lac array cells expressing indicated CFP-LacI fusion. Inset is LacO locus (white shows magenta and cyan overlap). Scale bar, 5 μm. (F) IF bar chart (mean ± SD) quantifying enrichment of p300 at CFP-LacI (no fusion) or CFP-LacI with fusion (x-axis label). P values from one-way ANOVA with Dunnett’s test. (P values: ns P > 0.05, **P ≤ 0.01, ****P ≤ 0.0001). n = 22. (G) Schematic of experimental design for ChIP-seq in reprogrammed 10T1/2 cells. (H) Metagene plot of the log2fold change compared to input control of MYOCD occupancy centered on WT MYOCD peaks compared to the empty vector control. (I) Metagene plot of the log2fold change compared to input control of H3K27ac occupancy centered on WT MYOCD peaks compared to the empty vector control. (J) Gene tracks of MYOCD and H3K27ac ChIP-seq and RNA-seq from differentiated 10T1/2 cells expressing the indicated constructs at Actg2 locus. (K) Metagene plot of the log2fold change compared to input control of H3K27ac occupancy centered on the TSS of genes activated by WT MYOCD.
Fig. 8.
Fig. 8.. MYOCD coactivator condensation drives cardiovascular cell lineage specification.
Schematic illustrating the relationship between natural changes in MYOCD (green) concentration during differentiation, condensate formation, and switch-like gene activation. In undifferentiated cells, although DNA binding transcription factors like SRF (gray squares) and other components of the transcriptional machinery including RNA Pol II and p300 (gray shapes) are present, MYOCD is below the threshold concentration for condensate formation (red dotted line) and cell identity genes are not expressed. When the concentration of MYOCD exceeds the threshold for condensate formation, MYOCD forms nuclear condensates that concentrate the transcriptional machinery (gray shapes) to drive cell identity gene expression, facilitating lineage specification of SMC and CM.

References

    1. Spiegelman B. M., Heinrich R., Biological control through regulated transcriptional coactivators. Cell 119, 157–167 (2004). - PubMed
    1. Graf T., Enver T., Forcing cells to change lineages. Nature 462, 587–594 (2009). - PubMed
    1. Zug R., Developmental disorders caused by haploinsufficiency of transcriptional regulators: A perspective based on cell fate determination. Biol. Open 11, bio058896 (2022). - PMC - PubMed
    1. Palii C. G., Cheng Q., Gillespie M. A., Shannon P., Mazurczyk M., Napolitani G., Price N. D., Ranish J. A., Morrissey E., Higgs D. R., Brand M., Single-cell proteomics reveal that quantitative changes in co-expressed lineage-specific transcription factors determine cell fate. Cell Stem Cell 24, 812–820.e5 (2019). - PMC - PubMed
    1. Faure L., Wang Y., Kastriti M. E., Fontanet P., Cheung K. K. Y., Petitpre C., Wu H., Sun L. L., Runge K., Croci L., Landy M. A., Lai H. C., Consalez G. G., de Chevigny A., Lallemend F., Adameyko I., Hadjab S., Single cell RNA sequencing identifies early diversity of sensory neurons forming via bi-potential intermediates. Nat. Commun. 11, 4175 (2020). - PMC - PubMed

Publication types

MeSH terms

Substances