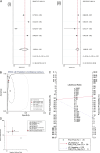
Deep learning-assisted detection and segmentation of intracranial hemorrhage in noncontrast computed tomography scans of acute stroke patients: a systematic review and meta-analysis
- PMID: 38489547
- PMCID: PMC11175741
- DOI: 10.1097/JS9.0000000000001266
Deep learning-assisted detection and segmentation of intracranial hemorrhage in noncontrast computed tomography scans of acute stroke patients: a systematic review and meta-analysis
Abstract
Background: Deep learning (DL)-assisted detection and segmentation of intracranial hemorrhage stroke in noncontrast computed tomography (NCCT) scans are well-established, but evidence on this topic is lacking.
Materials and methods: PubMed and Embase databases were searched from their inception to November 2023 to identify related studies. The primary outcomes included sensitivity, specificity, and the Dice Similarity Coefficient (DSC); while the secondary outcomes were positive predictive value (PPV), negative predictive value (NPV), precision, area under the receiver operating characteristic curve (AUROC), processing time, and volume of bleeding. Random-effect model and bivariate model were used to pooled independent effect size and diagnostic meta-analysis data, respectively.
Results: A total of 36 original studies were included in this meta-analysis. Pooled results indicated that DL technologies have a comparable performance in intracranial hemorrhage detection and segmentation with high values of sensitivity (0.89, 95% CI: 0.88-0.90), specificity (0.91, 95% CI: 0.89-0.93), AUROC (0.94, 95% CI: 0.93-0.95), PPV (0.92, 95% CI: 0.91-0.93), NPV (0.94, 95% CI: 0.91-0.96), precision (0.83, 95% CI: 0.77-0.90), DSC (0.84, 95% CI: 0.82-0.87). There is no significant difference between manual labeling and DL technologies in hemorrhage quantification (MD 0.08, 95% CI: -5.45-5.60, P =0.98), but the latter takes less process time than manual labeling (WMD 2.26, 95% CI: 1.96-2.56, P =0.001).
Conclusion: This systematic review has identified a range of DL algorithms that the performance was comparable to experienced clinicians in hemorrhage lesions identification, segmentation, and quantification but with greater efficiency and reduced cost. It is highly emphasized that multicenter randomized controlled clinical trials will be needed to validate the performance of these tools in the future, paving the way for fast and efficient decision-making during clinical procedure in patients with acute hemorrhagic stroke.
Copyright © 2024 The Author(s). Published by Wolters Kluwer Health, Inc.
Conflict of interest statement
The authors declare that they have no conflicts of interest in this work.
Figures


References
-
- Wang W, Jiang B, Sun H, et al. . Prevalence, incidence, and mortality of stroke in China: results from a nationwide population-based survey of 480 687 adults. Circulation 2017;135:759–771. - PubMed
-
- Wu S, Wu B, Liu M, et al. . Stroke in China: advances and challenges in epidemiology, prevention, and management. Lancet Neurol 2019;18:394–405. - PubMed
-
- Feigin VL, Lawes CM, Bennett DA, et al. . Worldwide stroke incidence and early case fatality reported in 56 population-based studies: a systematic review. Lancet Neurol 2009;8:355–369. - PubMed

