

Impact of antiretroviral therapy during acute or early HIV infection on virologic and immunologic outcomes: results from a multinational clinical trial
- PMID: 38489580
- PMCID: PMC11323228
- DOI: 10.1097/QAD.0000000000003881
Impact of antiretroviral therapy during acute or early HIV infection on virologic and immunologic outcomes: results from a multinational clinical trial
Abstract
Objective: To assess how antiretroviral therapy (ART) initiation during acute or early HIV infection (AEHI) affects the viral reservoir and host immune responses.
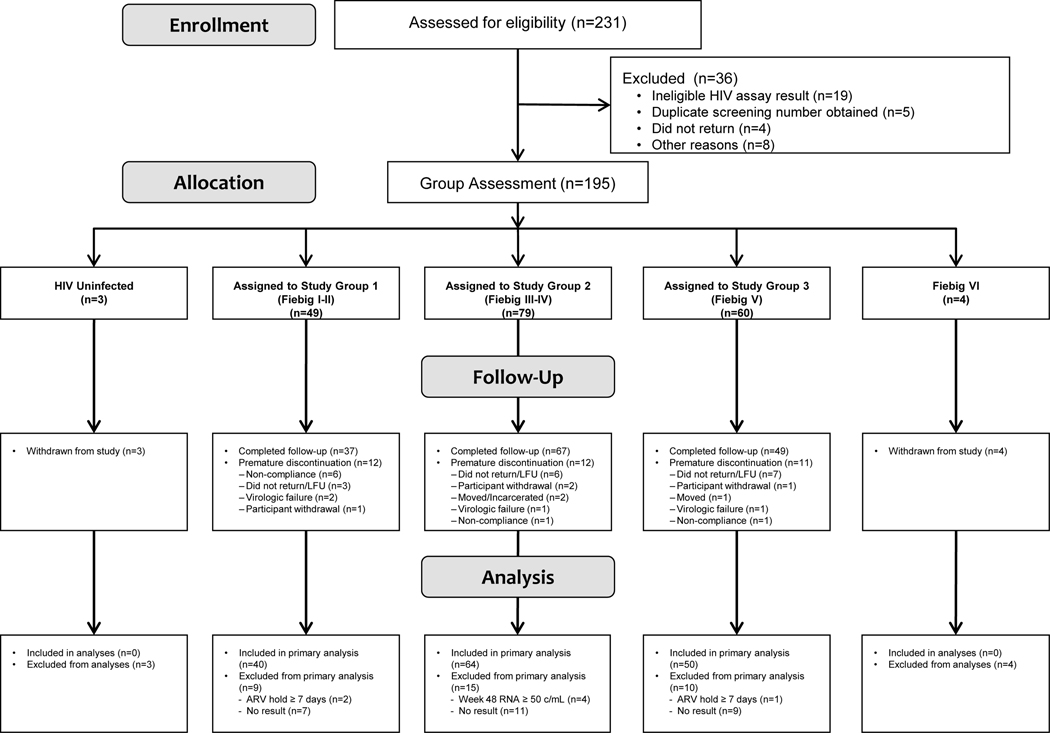
Design: Single-arm trial of ART initiation during AEHI at 30 sites in the Americas, Africa, and Asia.
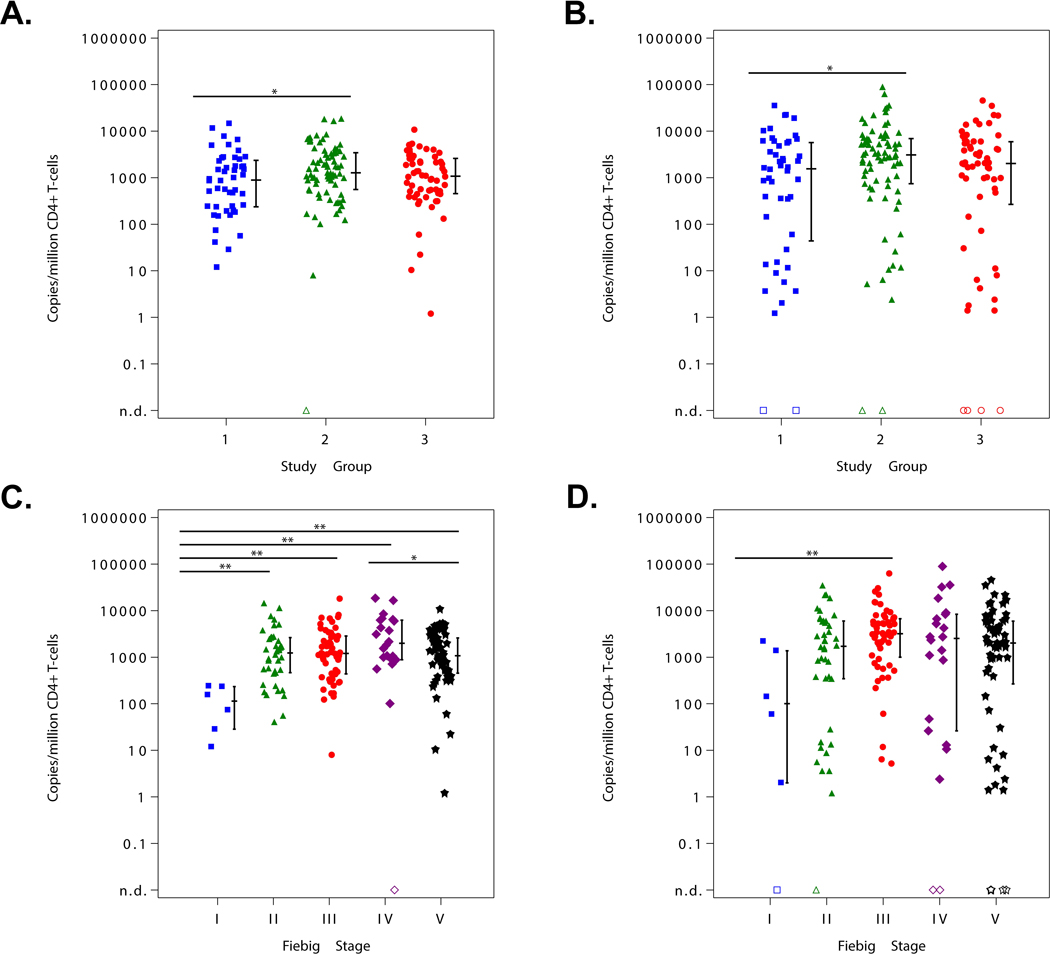
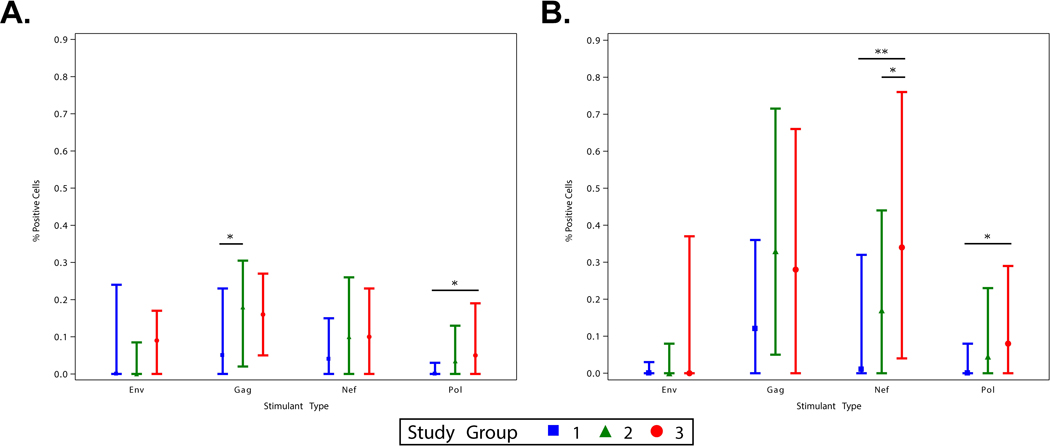
Methods: HIV DNA was measured at week 48 of ART in 5 million CD4 + T cells by sensitive qPCR assays targeting HIV gag and pol . Peripheral blood mononuclear cells were stimulated with potential HIV T cell epitope peptide pools consisting of env , gag , nef, and pol peptides and stained for expression of CD3, CD4, CD8, and intracellular cytokines/chemokines.
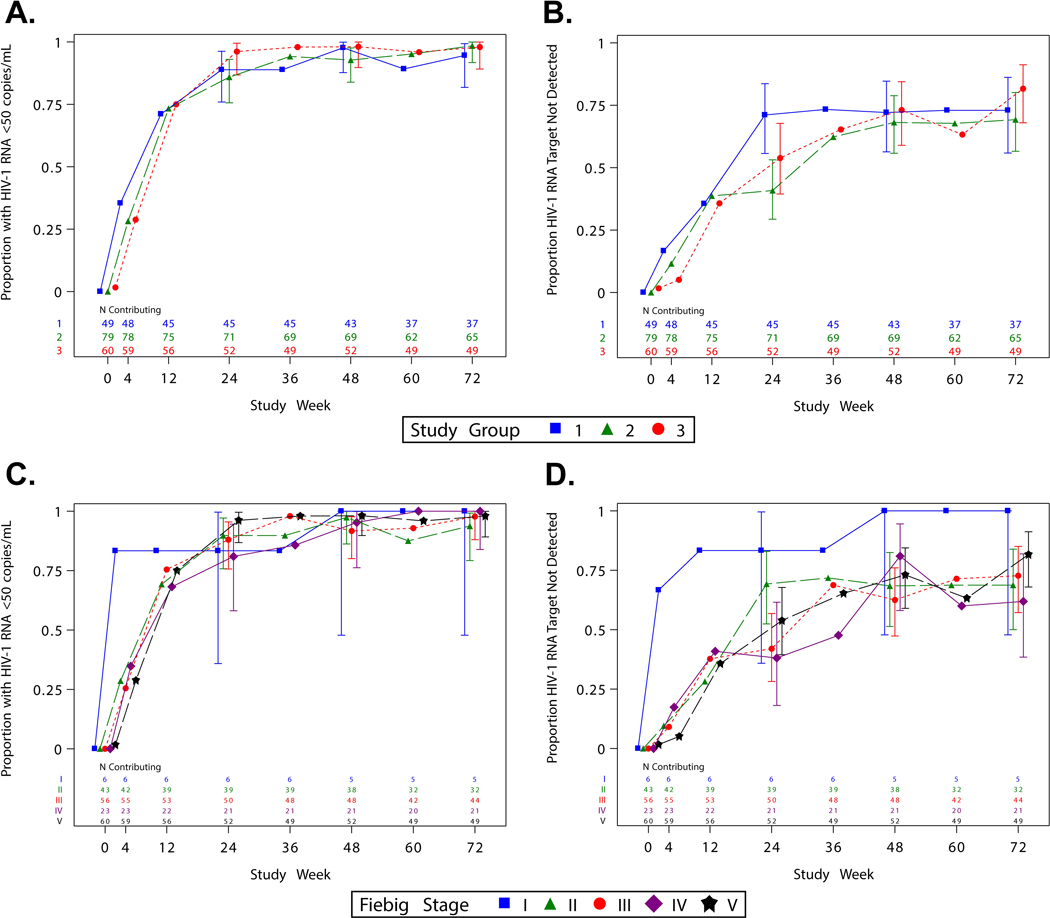
Results: From 2017 to 2019, 188 participants initiated ART during Fiebig stages I ( n = 6), II ( n = 43), III ( n = 56), IV ( n = 23), and V ( n = 60). Median age was 27 years (interquartile range 23-38), 27 (14%) participants were female, and 180 (97%) cisgender. Among 154 virally suppressed participants at week 48, 100% had detectable HIV gag or pol DNA. Participants treated during Fiebig I had the lowest HIV DNA levels ( P < 0.001). Week 48 HIV DNA mostly did not correlate with concurrent CD4 + or CD8 + T cell HIV-specific immune responses (rho range -0.11 to +0.19, all P > 0.025). At week 48, the magnitude, but not polyfunctionality, of HIV-specific T cell responses was moderately reduced among participants who initiated ART earliest.
Conclusion: Earlier ART initiation during AEHI reduced but did not eliminate the persistence of HIV-infected cells in blood. These findings explain the rapid viral rebound observed after ART cessation in early-treated individuals with undetectable HIV DNA by less sensitive methods.
Copyright © 2024 Wolters Kluwer Health, Inc. All rights reserved.
Conflict of interest statement
Figures

Comment in
-
Is early initiation of antiretroviral therapy important?AIDS. 2024 Jul 1;38(8):1263-1264. doi: 10.1097/QAD.0000000000003898. Epub 2024 May 30. AIDS. 2024. PMID: 38814713 No abstract available.
References
-
- Palella FJ, Delaney KM, Moorman AC, Loveless MO, Fuhrer J, Satten GA, et al. Declining morbidity and mortality among patients with advanced human immunodeficiency virus infection. HIV Outpatient Study Investigators. The New England journal of medicine 1998; 338(13):853–860. - PubMed
-
- Finzi D, Hermankova M, Pierson T, Carruth LM, Buck C, Chaisson RE, et al. Identification of a reservoir for HIV-1 in patients on highly active antiretroviral therapy. Science 1997; 278(5341):1295–1300. - PubMed
-
- Rothenberger MK, Keele BF, Wietgrefe SW, Fletcher CV, Beilman GJ, Chipman JG, et al. Large number of rebounding/founder HIV variants emerge from multifocal infection in lymphatic tissues after treatment interruption. Proceedings of the National Academy of Sciences of the United States of America 2015; 112(10):E1126–1134. - PMC - PubMed
Publication types
MeSH terms
Substances
Grants and funding
- U01 AI069438/AI/NIAID NIH HHS/United States
- UM1 AI069438/AI/NIAID NIH HHS/United States
- UM1 AI069534/AI/NIAID NIH HHS/United States
- UM1 AI069439/AI/NIAID NIH HHS/United States
- UM1 AI069481/AI/NIAID NIH HHS/United States
- UM1 AI068618/AI/NIAID NIH HHS/United States
- UM1 AI069452/AI/NIAID NIH HHS/United States
- UM1 AI069463/AI/NIAID NIH HHS/United States
- UL1 TR002384/TR/NCATS NIH HHS/United States
- UM1 AI069465/AI/NIAID NIH HHS/United States
- UM1 AI069419/AI/NIAID NIH HHS/United States
- UL1 TR001881/TR/NCATS NIH HHS/United States
- UM1 AI069436/AI/NIAID NIH HHS/United States
- UL1 TR000457/TR/NCATS NIH HHS/United States
- UM1 AI069494/AI/NIAID NIH HHS/United States
- UM1 AI069423/AI/NIAID NIH HHS/United States
- UM1 AI069501/AI/NIAID NIH HHS/United States
- P30 AI050409/AI/NIAID NIH HHS/United States
- UM1 AI069476/AI/NIAID NIH HHS/United States
- UM1 AI069424/AI/NIAID NIH HHS/United States
- U01 AI069463/AI/NIAID NIH HHS/United States
- UM1 AI069432/AI/NIAID NIH HHS/United States
- UM1 TR004406/TR/NCATS NIH HHS/United States
- UM1 AI069471/AI/NIAID NIH HHS/United States
- UL1 TR000124/TR/NCATS NIH HHS/United States
- UL1 TR002489/TR/NCATS NIH HHS/United States
- UM1 AI069412/AI/NIAID NIH HHS/United States
- UM1 AI068634/AI/NIAID NIH HHS/United States
- UM1 AI069399/AI/NIAID NIH HHS/United States
- U01 AI068636/AI/NIAID NIH HHS/United States
- P30 AI027757/AI/NIAID NIH HHS/United States
- UM1 AI106701/AI/NIAID NIH HHS/United States
- UM1 AI068636/AI/NIAID NIH HHS/United States
- P30 AI050410/AI/NIAID NIH HHS/United States
LinkOut - more resources
Full Text Sources
Medical
Research Materials
