. 2024 Jun 4;12(6):663-672.
doi: 10.1158/2326-6066.CIR-23-1078.

The Exonuclease TREX1 Constitutes an Innate Immune Checkpoint Limiting cGAS/STING-Mediated Antitumor Immunity

Affiliations

The Exonuclease TREX1 Constitutes an Innate Immune Checkpoint Limiting cGAS/STING-Mediated Antitumor Immunity

Junghyun Lim et al. Cancer Immunol Res. .

Abstract

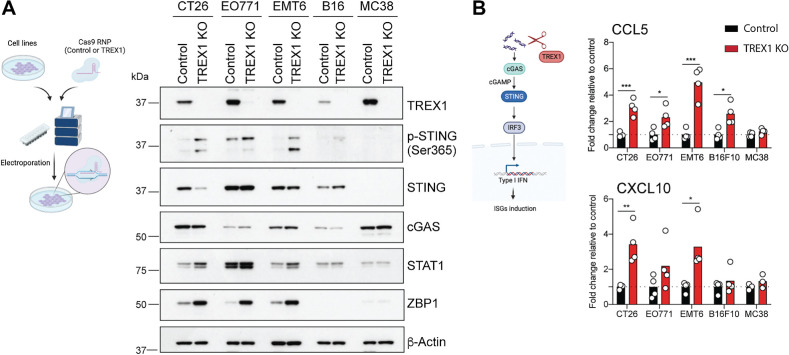
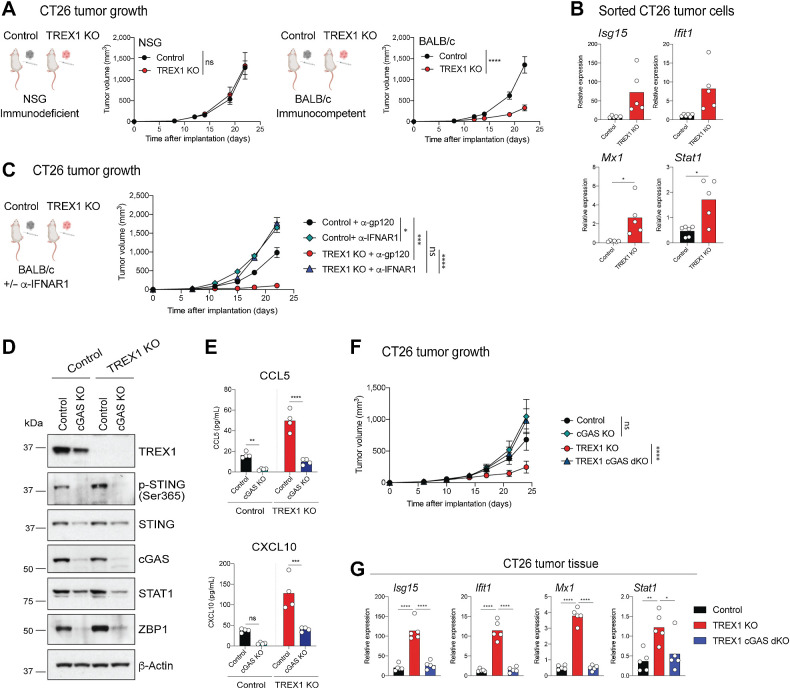
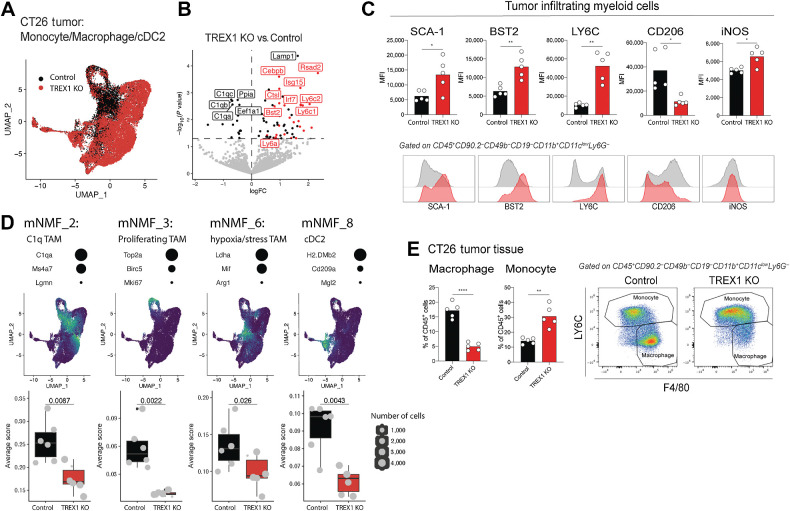
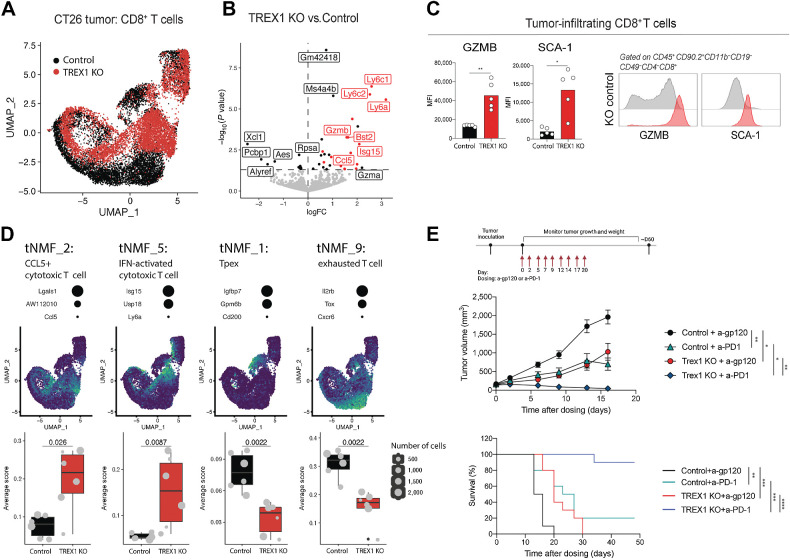
The DNA exonuclease three-prime repair exonuclease 1 (TREX1) is critical for preventing autoimmunity in mice and humans by degrading endogenous cytosolic DNA, which otherwise triggers activation of the innate cGAS/STING pathway leading to the production of type I IFNs. As tumor cells are prone to aberrant cytosolic DNA accumulation, we hypothesized that they are critically dependent on TREX1 activity to limit their immunogenicity. Here, we show that in tumor cells, TREX1 restricts spontaneous activation of the cGAS/STING pathway, and the subsequent induction of a type I IFN response. As a result, TREX1 deficiency compromised in vivo tumor growth in mice. This delay in tumor growth depended on a functional immune system, systemic type I IFN signaling, and tumor-intrinsic cGAS expression. Mechanistically, we show that tumor TREX1 loss drove activation of CD8+ T cells and NK cells, prevented CD8+ T-cell exhaustion, and remodeled an immunosuppressive myeloid compartment. Consequently, TREX1 deficiency combined with T-cell-directed immune checkpoint blockade. Collectively, we conclude that TREX1 is essential to limit tumor immunogenicity, and that targeting this innate immune checkpoint remodels the tumor microenvironment and enhances antitumor immunity by itself and in combination with T-cell-targeted therapies. See related article by Toufektchan et al., p. 673.


Figures

Figure 1. TREX1 limits a cGAS/STING-induced ISG response in multiple common murine tumor cell lines. A, Schematic of Cas9/gRNA-mediated TREX1 deletion in tumor cell lines (left). Representative Western blots of TREX1, p-STING (Ser365), STING, cGAS, STAT1, ZBP1, and β-actin in control and TREX1 KO cell lines (right; n = 4). B, Schematic of the cGAS/STING pathway (left). CCL5 and CXCL10 protein levels in supernatants. Values normalized to the average of control samples. Circles represent independent experiments. Bars represent the mean (n = 3–4). Unpaired t test. *, P < 0.05; **, P < 0.01; and ***, P < 0.001.
Figure 1.
TREX1 limits a cGAS/STING-induced ISG response in multiple common murine tumor cell lines. A, Schematic of Cas9/gRNA-mediated TREX1 deletion in tumor cell lines (left). Representative Western blots of TREX1, p-STING (Ser365), STING, cGAS, STAT1, ZBP1, and β-actin in control and TREX1 KO cell lines (right; n = 4). B, Schematic of the cGAS/STING pathway (left). CCL5 and CXCL10 protein levels in supernatants. Values normalized to the average of control samples. Circles represent independent experiments. Bars represent the mean (n = 3–4). Unpaired t test. *, P < 0.05; **, P < 0.01; and ***, P < 0.001.
Figure 2. Tumor-intrinsic TREX1 loss results in impaired CT26 tumor growth in immunocompetent mice in a type I IFNs and cGAS-dependent manner. A, Control and TREX1 KO CT26 tumor growth curves in immunodeficient NSG and immunocompetent BALB/c hosts. Lines represent the mean ± SEM. Two-way ANOVA (NSG, n = 6; BALB/c, n = 10 per group). B, RT-qPCR analysis of Isg15, Ifit1, Mx1, and Stat1 mRNA expression levels in sorted (CD45–CD31–PDGFRa–) CT26 tumor cells isolated from BALB/c hosts. Circles represent individual animals. Bars represent the mean. Unpaired t test with Welch correction (control, n = 6; TREX1 KO, n = 5). C, Control and TREX1 KO CT26 tumor growth curves in BALB/c hosts ± IFNAR1 blockage. Lines represent the mean ± SEM. Tumor volume at the last time point was compared by Two-way ANOVA using a mixed-effect model followed by Tukey multiple comparisons (n = 10 per group). D, Representative Western blots of TREX1, p-STING (Ser365), STING, cGAS, STAT1, ZBP1, and β-actin in CT26 cell lines of the indicated genotype (n = 4). E, CCL5 and CXCL10 protein levels in supernatants. Circles represent independent experiments. Bars represent the mean. Multiple t test (n = 4). F, Control, TREX1 KO, cGAS KO and TREX1 cGAS dKO CT26 tumor growth curves in BALB/c hosts. cGAS KO and TREX1 KO cGAS dKO groups were compared to control and TREX1 KO, respectively, by Two-way ANOVA using a mixed-effects model. Lines represent the mean ± SEM. (TREX1 KO n = 10; Control, cGAS KO, TREX1 cGAS dKO n = 9 per group). G, RT-qPCR analysis of Isg15, Ifit1, Mx1, and Stat1 mRNA expression levels in CT26 tumor tissue. Circles represent individual animals. Bars represent the mean. One way ANOVA (n = 5). ns, P > 0.05; *, P < 0.05; **, P < 0.01; ***, P < 0.001; and ****, P < 0.0001.
Figure 2.
Tumor-intrinsic TREX1 loss results in impaired CT26 tumor growth in immunocompetent mice in a type I IFNs and cGAS-dependent manner. A, Control and TREX1 KO CT26 tumor growth curves in immunodeficient NSG and immunocompetent BALB/c hosts. Lines represent the mean ± SEM. Two-way ANOVA (NSG, n = 6; BALB/c, n = 10 per group). B, RT-qPCR analysis of Isg15, Ifit1, Mx1, and Stat1 mRNA expression levels in sorted (CD45CD31PDGFRa) CT26 tumor cells isolated from BALB/c hosts. Circles represent individual animals. Bars represent the mean. Unpaired t test with Welch correction (control, n = 6; TREX1 KO, n = 5). C, Control and TREX1 KO CT26 tumor growth curves in BALB/c hosts ± IFNAR1 blockage. Lines represent the mean ± SEM. Tumor volume at the last time point was compared by Two-way ANOVA using a mixed-effect model followed by Tukey multiple comparisons (n = 10 per group). D, Representative Western blots of TREX1, p-STING (Ser365), STING, cGAS, STAT1, ZBP1, and β-actin in CT26 cell lines of the indicated genotype (n = 4). E, CCL5 and CXCL10 protein levels in supernatants. Circles represent independent experiments. Bars represent the mean. Multiple t test (n = 4). F, Control, TREX1 KO, cGAS KO and TREX1 cGAS dKO CT26 tumor growth curves in BALB/c hosts. cGAS KO and TREX1 KO cGAS dKO groups were compared to control and TREX1 KO, respectively, by Two-way ANOVA using a mixed-effects model. Lines represent the mean ± SEM. (TREX1 KO n = 10; Control, cGAS KO, TREX1 cGAS dKO n = 9 per group). G, RT-qPCR analysis of Isg15, Ifit1, Mx1, and Stat1 mRNA expression levels in CT26 tumor tissue. Circles represent individual animals. Bars represent the mean. One way ANOVA (n = 5). ns, P > 0.05; *, P < 0.05; **, P < 0.01; ***, P < 0.001; and ****, P < 0.0001.
Figure 3. TREX1 loss remodels an immunosuppressive myeloid TME. A, UMAP of monocytes, macrophages, and cDC2s in control and TREX1 KO CT26 tumors following scRNA-seq analysis. Cells are colored according to tumor genotype. B, Volcano plot showing genes differentially expressed comparing pseudobulk of tumor-infiltrating myeloid cells in control and TREX1 KO CT26 tumors. Horizontal dashed line represents a P value cutoff of 0.05. ISGs are highlighted in red. The five genes with the lowest P value in both directions are labeled in addition to Irf7, Ly6c2, Ly6c1, Bst2, and Ly6a. Only animals with more than 200 cells were included. C, Bar graphs and representative flow cytometry histograms of SCA-1, BST2, LY6C, CD206, and iNOS expression on myeloid cells in control and TREX1 KO CT26 tumors. Circles represent individual animals. Bars represent the mean. Unpaired t test with Welch correction (n = 5 per group). *, P < 0.05; **, P < 0.01. D, Four NMF programs from monocytes, macrophages, and cDC2s (mNMF) with significantly different scores comparing control and TREX1 KO CT26 tumors. Three representative genes for each program are listed with dots sized according to their relative contribution to the NMF program. UMAPs show scaled program scores for the given NMF program from low (blue) to high (yellow). Box plots display the NMF scores averaged by animal (grey points). Size of the points represents the number of cells for each animal. Points extended >1.5× interquartile range from the hinge are shown as outliers (marked by a black dot). Whiskers represent the minimum and maximum. The box represents the interquartile range, and the center line represents the median. Wilcox rank-sum test. E, Bar graphs and representative flow cytometry plots showing monocyte and macrophage proportions in CT26 tumors. Circles represent individual animals. Bars represent the mean (n = 5). Unpaired t test with Welch correction. **, P < 0.01; ****, P < 0.0001.
Figure 3.
TREX1 loss remodels an immunosuppressive myeloid TME. A, UMAP of monocytes, macrophages, and cDC2s in control and TREX1 KO CT26 tumors following scRNA-seq analysis. Cells are colored according to tumor genotype. B, Volcano plot showing genes differentially expressed comparing pseudobulk of tumor-infiltrating myeloid cells in control and TREX1 KO CT26 tumors. Horizontal dashed line represents a P value cutoff of 0.05. ISGs are highlighted in red. The five genes with the lowest P value in both directions are labeled in addition to Irf7, Ly6c2, Ly6c1, Bst2, and Ly6a. Only animals with more than 200 cells were included. C, Bar graphs and representative flow cytometry histograms of SCA-1, BST2, LY6C, CD206, and iNOS expression on myeloid cells in control and TREX1 KO CT26 tumors. Circles represent individual animals. Bars represent the mean. Unpaired t test with Welch correction (n = 5 per group). *, P < 0.05; **, P < 0.01. D, Four NMF programs from monocytes, macrophages, and cDC2s (mNMF) with significantly different scores comparing control and TREX1 KO CT26 tumors. Three representative genes for each program are listed with dots sized according to their relative contribution to the NMF program. UMAPs show scaled program scores for the given NMF program from low (blue) to high (yellow). Box plots display the NMF scores averaged by animal (grey points). Size of the points represents the number of cells for each animal. Points extended >1.5× interquartile range from the hinge are shown as outliers (marked by a black dot). Whiskers represent the minimum and maximum. The box represents the interquartile range, and the center line represents the median. Wilcox rank-sum test. E, Bar graphs and representative flow cytometry plots showing monocyte and macrophage proportions in CT26 tumors. Circles represent individual animals. Bars represent the mean (n = 5). Unpaired t test with Welch correction. **, P < 0.01; ****, P < 0.0001.
Figure 4. TREX1 loss increases CD8+ T-cell activation, limits their exhaustion, and enhances the potency of immune checkpoint blockade therapy. A, UMAP of CD8+ T cells in control and TREX1 KO CT26 tumors following scRNA-seq analysis. Cells are colored according to tumor genotype. B, Volcano plot showing genes differentially expressed comparing pseudobulk of tumor-infiltrating CD8 T cells in control and TREX1 KO CT26 tumors. Horizontal dashed line represents a P value cutoff of 0.05. ISGs are highlighted in red. The five genes with the lowest P value in both directions are labeled in addition to Gzmb, Bst2, Isg15, Ccl5, and Gzma. Only animals with more than 200 cells were included for comparison. C, Bar graphs and representative flow cytometry histograms showing expression of GZMB, and SCA-1 on CD8+ T cells in CT26 tumors. Circles represent individual animals. Bars represent the mean. Unpaired t test with Welch correction (n = 5 per group). *, P < 0.05; **, P < 0.01. D, Four NMF programs from CD8+ T cells (tNMF) with significantly different scores in TREX1 KO and control CT26 tumors. Three representative genes for each program are listed with dots sized according to their relative contribution to the NMF program. UMAPs show scaled program scores for the given NMF program from low (blue) to high (yellow). Box plots display the NMF scores averaged by animal (grey points). Size of the points represents the number of cells for each animal. Points extended >1.5× interquartile range from the hinge are shown as outliers (marked by a black dot). Whiskers represent the minimum and maximum. The box represents the interquartile range, and the center line represents the median. Wilcox rank-sum test. E, Tumor growth (top) and survival curves (bottom) of control and TREX1 KO CT26 upon anti-PD1 or isotype antibody treatment. Tumor volume at the last time point was compared by ANOVA using a mixed-effect model followed by Tukey's multiple comparisons. Lines represent the mean ± SEM (n = 10 per group). Survival was assessed with log-rank test. Lines represent median survival. Tumor volumes larger than 2,000 mm3 was regarded as end point (n = 10 per group). *, P < 0.05; **, P < 0.01; ***, P < 0.001; ****, P < 0.0001.
Figure 4.
TREX1 loss increases CD8+ T-cell activation, limits their exhaustion, and enhances the potency of immune checkpoint blockade therapy. A, UMAP of CD8+ T cells in control and TREX1 KO CT26 tumors following scRNA-seq analysis. Cells are colored according to tumor genotype. B, Volcano plot showing genes differentially expressed comparing pseudobulk of tumor-infiltrating CD8 T cells in control and TREX1 KO CT26 tumors. Horizontal dashed line represents a P value cutoff of 0.05. ISGs are highlighted in red. The five genes with the lowest P value in both directions are labeled in addition to Gzmb, Bst2, Isg15, Ccl5, and Gzma. Only animals with more than 200 cells were included for comparison. C, Bar graphs and representative flow cytometry histograms showing expression of GZMB, and SCA-1 on CD8+ T cells in CT26 tumors. Circles represent individual animals. Bars represent the mean. Unpaired t test with Welch correction (n = 5 per group). *, P < 0.05; **, P < 0.01. D, Four NMF programs from CD8+ T cells (tNMF) with significantly different scores in TREX1 KO and control CT26 tumors. Three representative genes for each program are listed with dots sized according to their relative contribution to the NMF program. UMAPs show scaled program scores for the given NMF program from low (blue) to high (yellow). Box plots display the NMF scores averaged by animal (grey points). Size of the points represents the number of cells for each animal. Points extended >1.5× interquartile range from the hinge are shown as outliers (marked by a black dot). Whiskers represent the minimum and maximum. The box represents the interquartile range, and the center line represents the median. Wilcox rank-sum test. E, Tumor growth (top) and survival curves (bottom) of control and TREX1 KO CT26 upon anti-PD1 or isotype antibody treatment. Tumor volume at the last time point was compared by ANOVA using a mixed-effect model followed by Tukey's multiple comparisons. Lines represent the mean ± SEM (n = 10 per group). Survival was assessed with log-rank test. Lines represent median survival. Tumor volumes larger than 2,000 mm3 was regarded as end point (n = 10 per group). *, P < 0.05; **, P < 0.01; ***, P < 0.001; ****, P < 0.0001.

References

    1. Sharma P, Allison JP. Immune checkpoint targeting in cancer therapy: toward combination strategies with curative potential. Cell 2015;161:205–14. - PMC - PubMed
    1. Mellman I, Chen DS, Powles T, Turley SJ. The cancer-immunity cycle: indication, genotype, and immunotype. Immunity 2023;56:2188–205. - PubMed
    1. Zitvogel L, Galluzzi L, Kepp O, Smyth MJ., Kroemer G. Type I interferons in anticancer immunity. Nat Rev Immunol 2015;15:405–14. - PubMed
    1. Propper DJ, Balkwill FR. Harnessing cytokines and chemokines for cancer therapy. Nat Rev Clin Oncol 2022;19:237–53. - PubMed
    1. Demaria O, Cornen S, Daëron M, Morel Y, Medzhitov R, Vivier E. Harnessing innate immunity in cancer therapy. Nature 2019;574:45–56. - PubMed

MeSH terms

Grants and funding