. 2024 May:71:103118.
doi: 10.1016/j.redox.2024.103118. Epub 2024 Mar 8.

ATF3-CBS signaling axis coordinates ferroptosis and tumorigenesis in colorectal cancer

Affiliations

ATF3-CBS signaling axis coordinates ferroptosis and tumorigenesis in colorectal cancer

Junjia Liu et al. Redox Biol. 2024 May.

Abstract

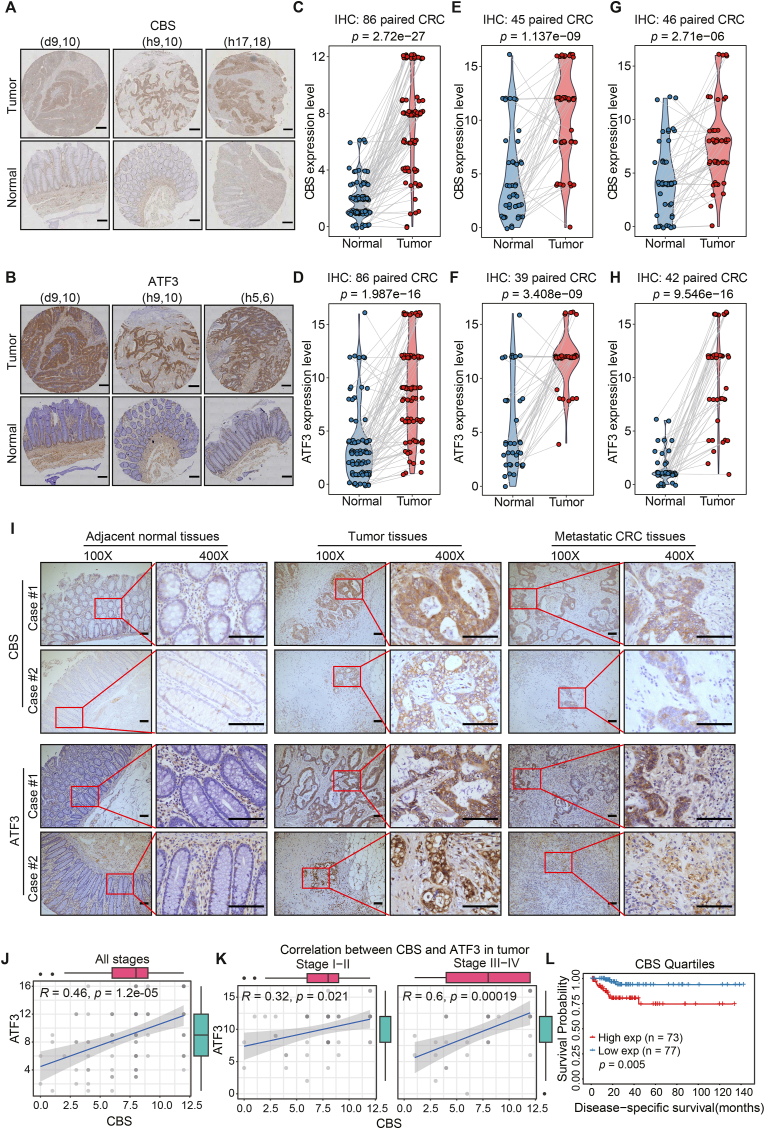
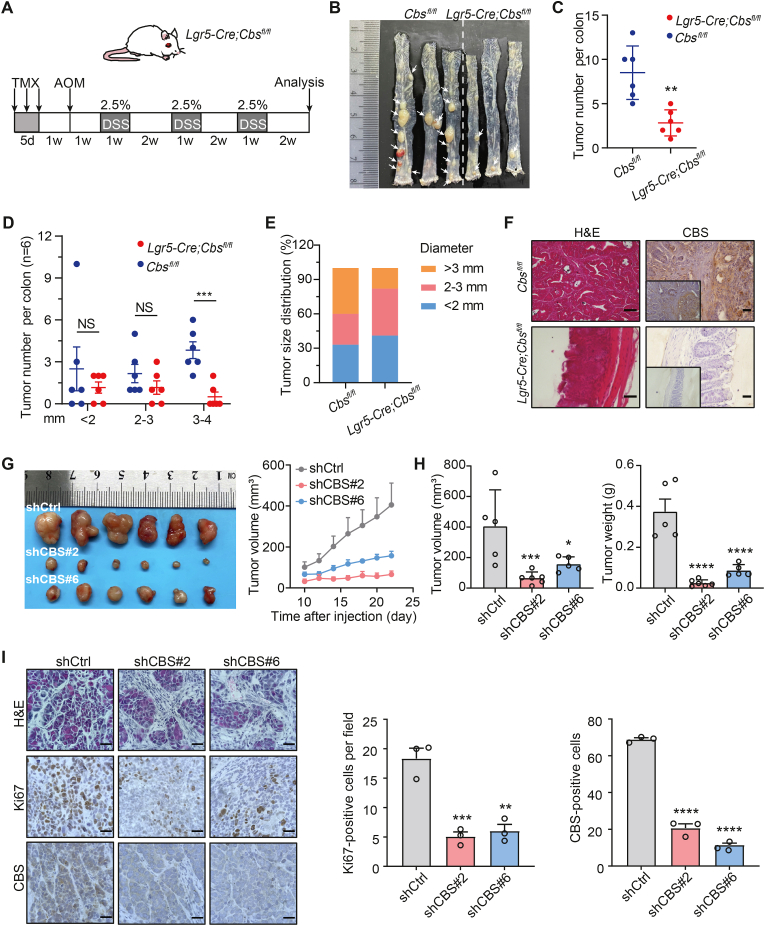
The induction of ferroptosis is promising for cancer therapy. However, the mechanisms enabling cancer cells to evade ferroptosis, particularly in low-cystine environments, remain elusive. Our study delves into the intricate regulatory mechanisms of Activating transcription factor 3 (ATF3) on Cystathionine β-synthase (CBS) under cystine deprivation stress, conferring resistance to ferroptosis in colorectal cancer (CRC) cells. Additionally, our findings establish a positively correlation between this signaling axis and CRC progression, suggesting its potential as a therapeutic target. Mechanistically, ATF3 positively regulates CBS to resist ferroptosis under cystine deprivation stress. In contrast, the suppression of CBS sensitizes CRC cells to ferroptosis through targeting the mitochondrial tricarboxylic acid (TCA) cycle. Notably, our study highlights that the ATF3-CBS signaling axis enhances ferroptosis-based CRC cancer therapy. Collectively, the findings reveal that the ATF3-CBS signaling axis is the primary feedback pathway in ferroptosis, and blocking this axis could be a potential therapeutic approach for colorectal cancer.

Keywords: ATF3-CBS signaling axis; Colorectal cancer (CRC); Ferroptosis; Mitochondrial tricarboxylic acid (TCA) cycle.


Conflict of interest statement

Declaration of competing interest The authors declare that they have no known competing financial interests or personal relationships that could have appeared to influence the work reported in this paper.

Figures

Image 1
The substitution of Eu ion enhanced the magnetic and dielectric properties of Co-Zn-Ni ferrites significantly by the solid-state reaction method.
Fig. 1
Fig. 1
Suppression of CBS promotes ferroptosis under cystine-restricted conditions. A. Heatmap of normalized gene expression (z score) determined by RNA-seq analysis of SW480 cell lines cultured in the full medium (FM) or cystine-restricted (CR) medium for 36 h. For comparing cells cultured in CR medium to those cultured in complete medium, red indicates upregulated genes, while blue indicates downregulated genes. B. Volcano plot showing downregulated genes (blue) and upregulated genes (red) in SW480 cells cultured with FM compared with CR medium. C. GSEA of CBS-related genes based on RNA-seq data for the control and CBS KD groups of SW480 cells. D. Micrographs of control and CBS KD SW480 cells cultured under cystine restriction alone or in combination with 2 μM Fer-1 treatment for 24 h. The red arrows indicate ferroptotic cells. Scale bar, 50 μm E. The viability of SW480 cells cultured under cystine restriction for 24 h alone or in combination with Fer-1 as indicated is shown. F. Lipid ROS were quantified in CBS KD SW480 cells after cystine starvation alone or in combination with 2 μM Fer-1 treatment for 24 h by C11-BODIPY staining and flow cytometric analysis. G. Viability of SW480 cells treated with Erastin alone or in combination with 2 μM Fer-1. Student's t-test was used to compare the maximal cytotoxicity with and without Fer-1. H. Micrographs of SW480 cells treated with 0, 100 or 200 μM AOAA alone or in combination with cystine restriction for 24 h. The red arrows indicate ferroptotic cells. Scale bar, 50 μm. I. Lipid ROS production was quantified by C11-BODIPY staining and flow cytometric analysis. Data are presented as mean ± SEM, and **p < 0.01, ***p < 0.001, ****p < 0.0001; “ns” indicates not significant compared to control group or the indicated two groups, based on two-tailed, unpaired Student's t-test or Pearson r-test.
Fig. 2
Fig. 2
Depletion of CBS enhances ferroptosis-based cancer therapies for CRC. A. Schematic of the experimental design for the intraperitoneal injection of MC38 cells to establish a xenograft model. The control diet (FM) or cystine-restricted diet (CR) or received CBS inhibitor, AOAA (i.P.) treatment of C57BL/6 mice, AOAA = 9 mg/kg, n = 6 mice per group. B. Representative images of tumors at the endpoint. C and D. Tumor growth curves in mice on dietary treatment alone or in combination with AOAA treatment. The final masses of the subcutaneous tumors were determined. Treatment, n = 6 mice per group. E. 4-HNE staining of tumors. Scale bar, 100 μm. Magnified view at 400 × of the area highlighted at 200 × by the red squares is depicted in the bottom row. Scale bar, 100 μm F. Quantification of 4-HNE-positive cells in tumors. (n = 3 tumors). G and H. Cell viability and lipid ROS production were quantified of CBS KD in SW620 and SW480 cells after cyst(e)inase treatment for 24 h. I. Micrographs of control and CBS KD SW620 cells treated with cyst(e)inase for 24 h. Scale bar, 100 μm. Data are presented as mean ± SEM., and *p < 0.05, **p < 0.01, ***p < 0.001, ****p < 0.0001 compared to control group or the indicated two groups, based on two-tailed, unpaired Student's t-test.
Fig. 3
Fig. 3
Suppression of CBS sensitizes CRC cells to ferroptosis by targeting the mitochondrial TCA cycle. A. Metabolite sets showed differential abundance between CBS KD cells and control cells. The metabolites with significantly different abundance between the two groups of cells were subjected to pathway enrichment analysis (y-axis, enrichment p values) and pathway topology analysis (x-axis, pathway impact values, indicative of the centrality and enrichment of a pathway) (n = 5 replicates per group, p < 0.05, |FC|>1.5). Circle color indicates the level of enrichment significance, with yellow indicating low significance and red indicating high significance. Circle size is proportional to the impact value of the pathway. B. TEM images of SW480 cells in the control and CBS KD groups cultured under cystine restriction for 12 h. The red arrowheads indicate mitochondria, and the yellow arrowheads indicate lipid droplets (LD); scale bar, 0.5 μm C. Mitochondrial morphology was determined by Mitotracker Red staining and confocal imaging. Scale bar, 2 μm. Magnified view of the region indicated by the white squares are shown on the bottom row. Scale bar, 2 μm. D. MitoSOX staining of live SW480 cells undergoing cystine restriction-induced ferroptosis. Scale bar, 50 μm E. Mitochondrial superoxide production was quantified in SW480 cells after cystine starvation for 24 h by MitoSOX staining and flow cytometric analysis. F. OCR in the control and CBS KD SW480 groups. The results of a representative experiment with n = 5 technical replicates per treatment are shown. G. The cellular ATP levels were measured in SW480 cells under cystine restriction for 24 h and normalized to the number of cells (n = 4 technical replicates per treatment). H. The control and CBS KD SW480 cells were treated with cystine restriction for 12 h, then stained with mito-BODIPY. Oxidized mito-BODIPY (green) indicates mitochondrial lipid peroxidation. Scale bar, 5 μm. I and J. Mitochondrial lipid peroxidation production was quantified in SW480 cells after cystine restriction or Erastin treatment for 24 h by MitoPerOX staining and flow cytometric analysis. K. Metabolites of Mitochondria sets showed differential abundance between CBS KD cells and control cells. Data are presented as mean ± SEM., and **p < 0.01, ***p < 0.001, ****p < 0.0001 compared to control group or the indicated two groups, based on two-tailed, unpaired Student's t-test.
Fig. 4
Fig. 4
ATF3-activated CBS protects CRC cells from ferroptosis. A. Heatmap of normalized gene expression (z score) based on RNA-seq data for SW480 cells cultured in CR medium or FM for 6 h. B. Western blot analysis of the changes of ISR-related proteins along cystine restriction. Relative protein expression was normalized to β-actin. C. The change in ATF3 and CBS expression in response to treatment with sorafenib at two different concentrations over three time periods (data from the NCI TPW online resource). D and E. Representative images from the photographed living SW480 cells. DIC, SYTOX Orange channels and ATF3-P2A-oxStayGold (D) or CBS-P2A-oxStayGold (E) in living SW480 cells were photographed by the fully automatic live cell microscopy imaging system with the prolongation of cystine-limited treatment time. SYTOX Orange-positive cells are dead. Scale bar in fluorescence channel, 100 μm. Detailed depiction of cell morphology in the area highlighted by the white squares is presented in the left column (DIC). Scale bar in DIC, 50 μm. F and G. Real-time fluorescence change curves of ATF3-P2A-oxStayGold (F) or CBS-P2A-oxStayGold (G) and SYTOX Orange channels in living SW480 cells (D and E) under cystine restriction conditions. H. Western blot analysis of CBS in ATF3 KD SW480 cells under cystine restriction for 24 h. Relative protein expression was normalized to β-actin. I. Viability of control and ATF3 KD SW480 cells under cystine restriction or incubated in FM for 24 h. J. Lipid ROS production was quantified in ATF3 KD SW480 cells after cystine restriction or incubation in FM for 24 h by C11-BODIPY staining. K. Western blot analysis of ATF3, CBS and GPX4 (a classic marker of ferroptosis), in ATF3 KD SW480 cells with/without CBS overexpression after incubation in CR medium or FM for 24 h. Relative protein expression was normalized to β-actin. L. Representative images of cell density indicating cell proliferation in each group seeded with the same number of cells. ATF3 KD and control SW480 cells with or without CBS overexpression are shown. Scale bar, 200 μm. M. Curves showing the fold change in the growth of SW480 cells in the control group and ATF3 KD group with CBS overexpression. N. Viability of control and ATF3 KD SW480 cells with or without CBS overexpression after incubation in CR medium or FM for 24 h. O. Lipid ROS production was quantified in ATF3 KD and control SW480 cells with/without CBS overexpression after incubation in CR medium or FM for 24 h by C11-BODIPY staining and flow cytometric analysis. P. Genome Browser views of ATF3 CUT&Tag profiles at CBS loci in SW480 cells after cystine restriction for 24 h or incubation in FM as the control group. Data are presented as mean ± SEM, and **p < 0.01, ***p < 0.001, ****p < 0.0001 compared to control group or the indicated two groups, based on two-tailed, unpaired Student's t-test.
Fig. 5
Fig. 5
Activation of the ATF3-CBS axis positively correlated with CRC progression. A. Immunohistochemical staining of CBS in a tissue microarray containing samples from patients with colon cancer. Representative staining of CBS expression in representative primary CRC tissues and adjacent normal tissues (n = 86). (d9,10), (h9,10) and (h17,18) represent the coordinates in TMA (Fig. S7A). Scale bar, 200 μm B. IHC staining of ATF3 in a tissue microarray containing samples from patients with colon cancer. Staining of ATF3 in representative primary CRC tissues and adjacent normal tissues (n = 86). (d9,10), (h9,10) and (h5,6) represent the coordinates in TMA (Fig. S8A). Scale bar, 200 μm C. Paired correlation analysis following staining and quantification of CBS expression in representative primary CRC tissues and adjacent normal tissues (n = 86) in TMA. The scores are based on the intensity and extent (area) of staining (protein expression). D. Paired correlation analysis of staining and quantification of ATF3 expression in representative primary CRC tissues and adjacent normal tissues (n = 86) in TMA. E. Paired correlation analysis following staining and quantification of CBS expression in representative primary CRC tissues and adjacent normal tissues (n = 45) in TMA. F. Paired correlation analysis of staining and quantification of ATF3 expression in representative primary CRC tissues and adjacent normal tissues (n = 39) in TMA. G. Paired correlation analysis following staining and quantification of CBS expression in representative primary CRC tissues and adjacent normal tissues (n = 46). H. Paired correlation analysis of staining and quantification of ATF3 expression in representative primary CRC tissues and adjacent normal tissues (n = 42). I. Immunohistochemical staining of CBS/ATF3 in colon cancer patient samples. Representative staining of CBS/ATF3 in adjacent normal tissues, colon cancer foci and metastatic CRC foci. Scale bar, 100 μm J and K. Correlation between CBS and ATF3 by immunohistochemical analysis of gene expression in CRC TMA samples (n = 86). L. Kaplan-Meier analysis of disease-specific survival in a set of CRC patients according to CBS expression. Data are analyzed using paired t-test for (C–H); Pearson r-test (I–K) and Log rank test for (L).
Fig. 6
Fig. 6
Depletion of CBS retards tumorigenesis in mouse CRC model. A. Schematic of the experimental design used to generate a mouse model of colitis-associated colon cancer. Azoxymethane (AOM) and DSS treatment of Cbsfl/fl mice and Lgr5-Cre-ERT2; Cbsfl/fl mice, n = 6 mice per group. B. Representative images of intact colon tumors in Cbsfl/fl mice and Lgr5-Cre ERT2; Cbsfl/fl mice on day 80 after injection of AOM. C. The total number of colon tumors in Cbsfl/fl mice and Lgr5-Cre-ERT2; Cbsfl/fl mice (n = 6). Each symbol represents an individual mouse. D and E. Analysis of the numbers of tumors of different sizes per colon (G) and percentage of tumors of different sizes (H) in Cbsfl/fl mice and Lgr5-Cre-ERT2; Cbsfl/fl mice (n = 6). Each symbol represents an individual mouse. F. H&E staining and IHC staining of CBS in CRC tissue sections collected from Cbsfl/fl mice and Lgr5-Cre-ERT2; Cbsfl/fl mice. Scale bar, 25 μm G and H. Tumor growth curves in immunodeficient nude mice injected subcutaneously with shCtrl or shCBS SW480 cells and monitored for 4 weeks (n = 6). The final volume and weight of the subcutaneous tumors were determined. I. H&E and IHC staining of Ki-67 and CBS in tissue sections from control and CBS KD SW480 subcutaneous tumors. Scale bar, 50 μm. Quantifying Ki-67- and CBS-positive cells in tumors (n = 3 tumors). Data are presented as mean ± SEM, and *p < 0.05, **p < 0.01, ***p < 0.001, ****p < 0.0001; “NS” indicates not significant compared to Cbsfl/fl group or control group, based on two-tailed, unpaired Student's t-test.

Similar articles

Cited by

References

    1. Pavlova N.N., Thompson C.B. The emerging hallmarks of cancer metabolism. Cell Metabol. 2016;23(1):27–47. - PMC - PubMed
    1. Hanahan D., Weinberg R.A. The hallmarks of cancer. Cell. 2000;100(1):57–70. - PubMed
    1. Longchamp A., et al. Amino acid restriction triggers angiogenesis via GCN2/ATF4 regulation of VEGF and H2S production. Cell. 2018;173(1):117–129 e14. - PMC - PubMed
    1. Eriksson S., et al. Dietary methionine can sustain cytosolic redox homeostasis in the mouse liver. Nat. Commun. 2015;6:6479. - PMC - PubMed
    1. Gao X., et al. Dietary methionine influences therapy in mouse cancer models and alters human metabolism. Nature. 2019;572(7769):397–401. - PMC - PubMed

MeSH terms