. 2024 Apr 11;187(8):1936-1954.e24.
doi: 10.1016/j.cell.2024.02.020. Epub 2024 Mar 14.

Type-I-interferon-responsive microglia shape cortical development and behavior

Affiliations

Type-I-interferon-responsive microglia shape cortical development and behavior

Caroline C Escoubas et al. Cell. .

Abstract

Microglia are brain-resident macrophages that shape neural circuit development and are implicated in neurodevelopmental diseases. Multiple microglial transcriptional states have been defined, but their functional significance is unclear. Here, we identify a type I interferon (IFN-I)-responsive microglial state in the developing somatosensory cortex (postnatal day 5) that is actively engulfing whole neurons. This population expands during cortical remodeling induced by partial whisker deprivation. Global or microglial-specific loss of the IFN-I receptor resulted in microglia with phagolysosomal dysfunction and an accumulation of neurons with nuclear DNA damage. IFN-I gain of function increased neuronal engulfment by microglia in both mouse and zebrafish and restricted the accumulation of DNA-damaged neurons. Finally, IFN-I deficiency resulted in excess cortical excitatory neurons and tactile hypersensitivity. These data define a role for neuron-engulfing microglia during a critical window of brain development and reveal homeostatic functions of a canonical antiviral signaling pathway in the brain.

Keywords: cortical development; microglia; neuroimmunity; phagocytosis; somatosensory cortex; tactile hypersensitivity; type I interferon.


Conflict of interest statement

Declaration of interests The authors declare no competing interests.

Figures
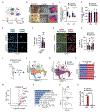
FIGURE 1:
FIGURE 1:. A type I interferon-responsive microglial subset expands 20-fold during cortical remapping.
(A) Schematic of the partial whisker deprivation model. (B) Representative images of control and lesioned whisker pad (left, P5), en face imaging of L4 somatosensory cortex and topographical heat map of cortex derived from VGLUT2 intensity data (right) (scale bar 100μm). (C) Quantification of barrel distinctness based on VGLUT2 intensity in barrels vs. septa in control and deprived hemispheres. Plot shows range, median, and first and third quartiles (2-4 barrel/septa pairs per condition per mouse; P5 n=3 mice; P7 n=4 mice). (D) VGLUT2 intensity averaged over the entire barrel field in control vs deprived hemispheres. Error bars show SD (P5 n=3 mice; P7 n=4 mice). (E) Representative images of TUNEL+ cells in L5 of the barrel cortex in WT control vs. deprived cortex, P5. White arrowheads: TUNEL+DAPI+ cells. Insets shows TUNEL+ cell (scale bar 20μm, scale bar inset 10μm). (F) TUNEL+DAPI+ cells in barrel cortex of control vs. deprived hemispheres, P5 (n=8 mice). (G) Representative images of 53BP1+ foci in L5 of the barrel cortex, P5. Insets show neurons with 53BP1+ foci (dotted white line) (scale bar 20μm, scale bar inset 10μm). (H) Neurons with 53BP1+ foci in the barrel cortex in control vs. deprived hemispheres, P5 (n=5 mice). (I) Schematic of microglia isolation for single cell sequencing. (J) UMAP clustering of 12,000 CD11b+ cells, pooling P5 and P7 timepoints from control and whisker deprived cortices, including microglia (clusters 0-8) and macrophages (cluster 9). Dotted lines highlight clusters for further analysis. Clusters 0/5 and 6/7 were merged due to low numbers of uniquely expressed genes. (K) Clusters colored by condition (control blue vs. whisker deprived red). (L) Quantification of cluster composition by condition. X-axis represents percent of cells in each cluster from the control (blue) or deprived (red) hemispheres, normalized for total number of cells per sample (*pAdj<0.01, **pAdj<10−25). (M) Volcano plot of genes differentially expressed in cluster 8 relative to all other clusters. (N) GO terms upregulated in cluster 8 (Metascape). (O) UMAP plots separated by age (P5vs. P7) with cluster 8 highlighted in green. (P) Cluster 8 abundance at P5 and P7 in control vs. deprived conditions. Data represented as percentage of total cells (****pAdj<10−10). Data are represented as mean±SEM unless otherwise noted. Dots represent independent animals unless otherwise noted. Lines connect both hemispheres from the same mouse (H). Statistics: two-way ANOVA with Sidak post-hoc test (C, H); paired t-test (F); Chi-square test with Bonferroni correction (L, P). See also Figure S1, Tables S2a and S2b.
FIGURE 2:
FIGURE 2:. An interferon-responsive microglia state is partly conserved across pathologies.
(A) Expression of 39 ‘cluster 8’ marker genes (upregulated in cluster 8 by at least 20% at pAdj < 0.005, and gene detected in all external datasets) in published microglia sequencing data from bulk sorted CD11b+ cells. Dots represent individual genes, highlighting Ifitm3 (red) and Mx1 (yellow). Y-axis represents the log fold change relative to its own control. See Table S3a for full details of each sample set and experimental condition. (B) Our microglial P5/P7 dataset was re-clustered to create a reference PCA and UMAP to which external datasets (brown triangles) were aligned. Red circle = Interferon-responsive microglia (cluster 8), grey circle = homeostatic microglia. Representative plots show a SARS-CoV2 dataset (see Table S3b). (C) Enrichment of cluster 8-like cells in microglial single-cell sequencing datasets relative to each study’s control. Y-axis represents fold change in percent cluster 8 overlap between the indicated condition and each dataset’s control. See Table S3b for references,–. See also Figure S2, Table S3a and S3b.
FIGURE 3:
FIGURE 3:. IFN-I responsive microglia engulf neurons during cortical developmental remodeling.
(A) UMAP feature plot showing normalized expression of cluster 8 marker gene Ifitm3. (B) Representative image showing IFITM3+Cx3cr1GFP+ microglia (white arrowheads) in control or deprived hemispheres, P5 (scale bar 50μm). (C) Percent of IFITM3+ microglia in L4 vs L5, P5 (n=5 mice). (D) Representative image of ‘projecting’ and ‘engulfing’ IFITM3+ microglia in deprived barrel cortex, P5 (scale bar 20μm (left), 5μm (right)). (E) Quantification of microglial morphological subtypes described in Figure 3D, P5. Data represented as stacked bar graphs±SEM (n=4 mice). (F) Confocal image and orthogonal views of an IFITM3+ microglia (P5) containing multiple phagocytic cups (i, ii show nuclei-containing phagocytic cups that are distinct from the microglia nucleus) (scale bar 5μm). (G) Percent of IFITM3 and IFITM3+ microglia with phagocytic cups in P5 barrel cortex (n=3 mice). (H) Distribution of inclusion-containing microglia by number of inclusions, P5. Data represented as stacked bar graphs±SEM (n=3 mice). (I) RNA velocity analysis of data from Figure 1J, showing predicted future cell state colored by cluster (scVelo). Red dotted rectangle highlights putative transition from IFN-I responsive cluster 8 towards cluster 3 (See Table S2c). (J) Volcano plot of differentially expressed genes in cluster 3. (K) Representative image of IBA1+ microglia engulfing RorbcreTdT+ neurons in L5 barrel cortex, P5. Inset in L5 (right). White arrowheads show RorbcreTdT+ CD68+ phagolysosomes (scale bar 50 μm). (L) Representative image of IBA1+ microglia and Aldh11L1TdT+ astrocytes in the barrel cortex, P5 (scale bar 50μm). (M) Percent microglia containing TdTomato signal in Rorbcre:TdT or Aldh1l1TdT transgenic mice in barrel cortex, P5. (n=3 mice per group). (N) Representative image of a TdTomato+ (Mx1CRE:Rosa26LSL-TdT) IBA1+ microglial phagocytic cup forming around a Grin1+ nucleus, P5. Inset (right) with yellow arrowhead showing phagocytic cup around neuronal nucleus (scale bar 10μm). (O) Percent of microglia forming phagocytic cups around Grin1+ nuclei in the barrel cortex plotted by Mx1CreTdT expression (P5 n=3 mice; P7 n=5 mice). Data are represented as mean±SEM unless otherwise noted. Dots represent independent animals unless otherwise noted. Lines connect both hemispheres from the same mouse (C, O). Statistics: two-way ANOVA with Sidak post-hoc test (C, O); Fisher’s exact test (E); Welch’s t-test (G); Chi-square test (H). See also Figure S3 and Table S2c.
FIGURE 4:
FIGURE 4:. IFN-I signaling promotes microglial phagocytic function and restricts accumulation of DNA-damaged neurons.
(A) Schematic of Type I interferon receptor and ligands. (B) IFITM3+ microglia in deprived barrel cortex from Ifnar1+/+ and Ifnar1−/− mice, P5 (n=3 mice per group). (C) Representative images of microglia in barrel cortex from Ifnar1 and Ifnar1−/− mice, P5. Yellow outline shows microglia nucleus, green outlines show phagosomes (scale bar 15μm). (D) Phagocytic compartments per microglia in barrel cortex of Ifnar1+/+ and Ifnar1−/− mice, P5 (n=3 mice per group). (E) Distribution of phagocytic compartments per microglia in Ifnar1+/+ and Ifnar1−/− mice, P5. Data represented as stacked bar graph±SEM (n=3 mice). (F) Representative image and 3D render of microglia with multiple phagosomes in barrel cortex of Ifnar1−/− mice, P5. White arrowheads show DAPI+ phagosomes; yellow arrowheads show microglial nucleus. Insets highlight cross sections through each phagosome, colored as in 3Drender (scale bar 10μm). See also Movie S1. (G) Representative images of non-bubble microglia with a compact phagosome and a bubble microglia with an enlarged phagosome, P5. Yellow arrowhead shows nucleus, dashed line shows phagosome diameter in H (scale 10μm). (H) Left axis: diameter of largest microglial phagosome in barrel cortex from Ifnar1+/+ and Ifnar1−/− mice, P5. Violin plots show line at mean, dots show individual microglia. Right axis: mean diameter of microglial nuclei (n=57-76 microglia from 3 mice per group). ‘Bubble’ microglia defined as those with phagosomes larger than mean nucleus diameter. (I) Percent bubble microglia in barrel cortex from Ifnar1+/+ and Ifnar1−/− mice, P5 (n=3 mice per group). (J) Developmental time-course of bubble morphology microglia in barrel cortex from Ifnar1+/+ and Ifnar1−/− mice (P2 n=2; P5/P7/P90 n=3; P15 n=4). (K) Representative image of 53BP1 foci-containing neurons in barrel cortex of Ifnar1+/+ and Ifnar1−/− mice, P5. White circles outline nuclei with 53BP1+ foci, yellow square insets highlight 53BP1 staining (left) (scale bar 10μm). (L) Percent of all cells containing 53BP1+ foci in the barrel cortex from Ifnar1+/+ and Ifnar1−/− mice at P5. Data are represented as mean ± SEM. Dot per mouse (n= 6 mice for Ifnar1+/+, 5 for Ifnar1−/− Welch’s t-test). (M) Percent of all cells containing 53BP1+ foci in barrel cortex from Ifnar1+/+ and Ifnar1−/− mice, P15 (n=5 mice per group). Data are represented as mean±SEM unless otherwise noted. Dots represent independent animals unless otherwise noted. Statistics: Welch’s t-test (B, D, I, M); Fisher’s exact test (E); Mann Whitney test (H). See also Figure S4.
FIGURE 5:
FIGURE 5:. Microglial-autonomous IFN-I signaling and dsRNA sensing restricts the accumulation of DNA-damaged neurons.
(A) Representative confocal image of Ifnar1 mRNA transcript co-stained with IBA1 (top) or Aldh1l1eGFP reporter (bottom) in P5 somatosensory cortex (scale bar 50μm). (B) Quantification of Ifnar1 mRNA puncta in nuclei of microglia (IBA1+), astrocytes (Aldh1l1eGFP+), neurons (NeuN+) and endothelial cells (based on elongated morphology), P5. Data represented as violin plot (mean in black; quartiles in white). (C) Representative image of IBA1+ microglia in P5 barrel cortex from Cx3cr1CRE:Ifnar1flox/flox mice or P2ry12CreERT2 :Ifnar1flox/flox (50μg tamoxifen at P1,3,4) showing enlarged CD68+DAPI+ phagosome. Yellow arrow shows microglia nucleus, white arrows show phagosome (scale bar 10μm). (D) Left: 3D render of IBA1+ microglia in C (P2ry12CreERT2:Ifnar1flox/flox) showing enlarged DAPI+ CD68+ phagosome, scale bar 5μm). Top right shows a single Z slice. Bottom right shows the 3D render without IBA1 volume (scale bar 5μm). (E) Percent bubble microglia in barrel cortex from Ifnar1flox/flox vs. Cx3cr1CRE:Ifnar1flox/flox mice, P5 (n=5 mice per group). (F) Percent bubble microglia in barrel cortex from Ifnar1flox/flox vs. P2ry12CreERT2:Ifnarlflox/flox mice. P5 (50μg tamoxifen at P1,3,4) (n=6 mice for Ifnar1flox/flox and 5 for P2ry12CreERT2:Ifnar1flox/flox). (G) 53BP1 foci+ neurons in barrel cortex from Ifnar1flox/flox vs. Cx3cr1CRE:Ifnar1flox/flox mice, P5. White circles outline nuclei with 53BP1+ foci (scale bar 10μm). (H) Percent of all cells containing 53BP1+ foci in barrel cortex from Ifnar1flox/flox vs. Cx3cr1CRE:Ifnar1flox/flox mice, P5 (n=4 mice for Ifnar1flox/flox and 5 for Cx3cr1CRE:Ifnar1flox/flox). (I) Schematic of nucleic acid sensing pathways inducing IFN-I responses. (J) Percent IFITM3+ microglia in deprived barrel cortex from WT, Mavs−/− Cgas−/− and Tlr3−/− mice, P5 (n=4 mice for WT, Tlr3−/− and n=3 for Mavs−/− Cgas−/−). (K) Representative image of IBA1+ microglia in barrel cortex of Mavs−/− and Cgas−/− mice showing DAPI+ phagosome, P5. Yellow outline shows microglia nucleus, green outline shows phagocytic compartments (scale bar 10μm). (L) Percent bubble microglia in barrel cortex from WT, Mavs−/−, Cgas−/− and Tlr3−/− mice, P5 (n=3 mice for Cgas−/−, 4 Mavs−/− and Tlr3−/−, 6 WT). (M) 53BP1 foci+ neurons in the barrel cortex from Mavs+/+ vs Mavs−/− mice, P5. White dotted lines outline nuclei with 53BP1+ foci (scale bar 10μm). (N) Percent of cells with foci in barrel cortex from WT, Mavs−/− and Cgas−/− mice, P5 (n=3 mice for Cgas−/−, 4 Mavs−/−, 5 WT,). Data are represented as mean±SEM unless otherwise noted. Dots represent independent animals unless otherwise noted. Statistics: Welch’s t-test (E, F, H); Kruskal-Wallis with Dunn’s multiple comparisons (J, L); one-way ANOVA with Dunnett’s multiple comparisons (N) See also Figure S5 and Movie S1.
FIGURE 6:
FIGURE 6:. IFN-I is sufficient to promote neuronal engulfment by microglia.
(A) Experimental design: 10ng of IFNβ or vehicle (PBS) injected i.c.v. at P4, tissue collection at P5. Blue square shows region of motor cortex analyzed (within 300μm of injection site). (B) Representative images of IFITM3+ microglia (white arrowheads) in PBS vs. IFNβ injected mice, P5 (scale bar 50μm). (C) Percent IFITM3+ microglia in cortex of PBS vs. IFNβ injected mice, P5 (n=6 mice for PBS, 5 for IFNβ). (D) Percent IFITM3+ microglia in cortex Ifnar1flox/flox vs. Cx3cr1CRE:Ifnar1flox/flox mice injected with IFNβ, P5 (n=4 mice per group). (E) Percent IFITM3+ microglia in cortex of Ifnar1flox/flox vs. Syn1CRE:Ifnar1flox/flox mice injected with IFNβ, P5 (n=5 mice for Ifnar1flox/flox and 7 for Svn1CRE:Ifnar1flox/flox). (F) Representative images and 3D render of microglia in PBS vs. IFNβ injected mice, P5. Pink arrowheads show ‘projecting phagosomes’, white arrowhead shows CD68+ ‘soma phagosome’, yellow arrowhead shows nucleus (scale 5μm). (G) Quantification of microglial morphology subtypes (‘soma-associated’ and ‘projecting’ phagosomes as in F, ‘phagocytic cup forming’, or ‘ramified/homeostatic’) from PBS vs. IFNβ injected mice. Data represented as stacked bar graphs±SEM (n=6 mice for PBS, 5 for IFNβ). (H) Phagocytic compartments per microglia (IFITM3 vs. IFITM3+) in PBS vs. IFNβ injected mice (n=5 mice per group). (I) Representative images of neurons with 53BP1+ foci in PBS vs. IFNβ injected mice. White circles in inset outline nuclei with 53BP1+ foci (scale bar 50μm and inset scale bar 10μm). (J) Percent of all cells containing 53BP1+ foci in PBS vs. IFNβ injected mice (n=7 mice for PBS, 6 for IFNβ). (K) Schematic of viral overexpression strategy (nls-eGFP = nuclear-localized green fluorescent protein). (L) Representative low power image of IFITM3 induction following viral infection, P7. White square shows inset and white arrowheads show IFITM3+ microglia (scale bar 1mm and inset scale bar 30μm). (M) Representative image of a phagocytic microglia in an AAV-Syn1:Ifnb1-nls-eGFP injected brain, P7. White square shows inset, yellow arrowheads show IFITM3+ phagocytic cup around a nucleus (scale bar 5μm). (N) Percent IFITM3+ microglia in barrel cortex of virally infected mice, P7 (n=6 per group). (O) Quantification of microglial morphology subtypes (as in F and G) from virally infected mice, P7. Data represented as stacked bar graph±SEM (n=6 mice per group). (P) Schematic of zebrafish poly(I:C) injection and live imaging experiment. See Methods for details. (Q) Time series of microglia (green, Tg(mpeg:EGFP-CAAX)) and neurons (red; Tg(NBT:dsRed)) in the zebrafish optic tectum. Yellow arrowhead, top: a neuron contacted by a microglial process but not engulfed. Yellow arrowhead, bottom: a neuron engulfed and retracted towards the microglial soma. White circle shows original position of the engulfed neuron (scale bar 10μm). See also Movies S2-S3. (R) Distribution of process morphologies as indicated (see also Figure S6I). Data represented as stacked bar graphs±SEM (n=4 fish for PBS, 6 for poly(I:C)). Morphologies defined further in Figure S6I. (S) Percent of microglia engulfing at least one dsRed+ neuron during one hour. (n=4 fish for PBS, 6 for poly(I:C)). (T) Percent of microglia engulfing 0, 1, 2, or 3 dsRed+ neurons during image acquisition. Data are represented as stacked bar graphs±SEM (n=4 fish for PBS, 6 for poly(I:C)). Data are represented as mean±SEM unless otherwise noted. Dots represent independent animals unless otherwise noted. Statistics: Welch’s t-test (C, D, E, H, J, N, S); Fisher’s exact test (G, O, R, T) See also Figure S6 and Movies S2-S3.
FIGURE 7:
FIGURE 7:. IFN-I responsive microglia prevent tactile hypersensitivity.
(A) Schematic of barrel cortex circuits. (B) Representative images of CTIP2 in somatosensory cortex of P5 Ifnar1+/+ and Ifnar1−/− mice. White lines on the left highlight cortical layers (scale bar 100μm). (C) Relative CTIP2+ neuron density per mm2 in L5 in Ifnar1+/+ and Ifnar1−/− mice, P5 (n=3 mice per group). (D) Representative image showing co-localization of 53BP1+ foci with CTIP2 in barrel cortex L5 from Ifnar1−/− mice, P5. White circles outline the CTIP2+ 53BP1 foci+ neurons (scale bar 10μm). (E) Percent of 53BP1 foci+ neurons co-localizing with CTIP2 in barrel cortex L5 from Ifnar1−/− mice, P5 (n=3 mice). (F) Representative images of CTIP2+ neurons in somatosensory cortex of P15 Ifnar1+/+ and Ifnar1−/− mice. White lines on the left highlight cortical layers (scale bar 100μm). (G) Relative CTIP2+ neuron density in all cortical layers of the somatosensory cortex in P15 Ifnar1+/+ and Ifnar1−/− mice (n=6 mice per group). (H) Representative images of Parvalbumin+ neurons in somatosensory cortex of P15 Ifnar1+/+ and Ifnar1−/− mice. White lines on the left highlight cortical layers (scale bar 100μm). (I) Relative Parvalbumin+ neuron density in all cortical layers of the somatosensory cortex in P15 Ifnar1+/+ and Ifnar1−/− mice (n=6 mice per group). (J) Schematic of whisker nuisance assay. A higher score reflects increased aversive response to tactile stimulus. See Methods. (K) Whisker nuisance score in P15 Ifnar1+/+ and Ifnar1−/− mice (n=5 Ifnar1+/+ mice, 7 Ifnar1−/−, 3 independent experiments). (L) Whisker nuisance score in P15 Ifnar1flox/flox vs. Cx3cr1CRE:Ifnar1flox/flox mice (n=10 Ifnar1flox/flox mice, 14 Cx3cr1CRE:Ifnar1flox/flox, 4 independent experiments). (M) Whisker nuisance score in P15 Ifnar1flox/flox vs. Syn1CRE:Ifnar1flox/flox mice (n=7 Ifnar1flox/flox mice, 9 Syn1CRE:Ifnar1flox/flox, 2 independent experiments). Data are represented as mean±SEM unless otherwise noted. Dots represent independent animals unless otherwise noted. Statistics: Welch’s t-test (C, G, I, K, L, M) See also Figure S7.

Update of

References

    1. Forrest MP, Parnell E, and Penzes P (2018). Dendritic structural plasticity and neuropsychiatric disease. Nat. Rev. Neurosci 19, 215–234. - PMC - PubMed
    1. Bitzenhofer SH, P;öpplau JA, Chini M, Marquardt A, and Hanganu-Opatz IL (2021). A transient developmental increase in prefrontal activity alters network maturation and causes cognitive dysfunction in adult mice. Neuron 109, 1350–1364.e6. - PMC - PubMed
    1. Medendorp WE, Bjorefeldt A, Crespo EL, Prakash M, Pal A, Waddell ML, Moore CI, and Hochgeschwender U (2021). Selective postnatal excitation of neocortical pyramidal neurons results in distinctive behavioral and circuit deficits in adulthood. iScience 24, 102157. - PMC - PubMed
    1. Arguello PA, and Gogos JA (2012). Genetic and cognitive windows into circuit mechanisms of psychiatric disease. Trends Neurosci. 35, 3–13. - PubMed
    1. Prinz M, Jung S, and Priller J (2019). Microglia Biology: One Century of Evolving Concepts. Cell 1 79, 292–311. - PubMed

Substances