. 2024 Apr 8;42(4):623-645.e10.
doi: 10.1016/j.ccell.2024.02.016. Epub 2024 Mar 14.

Multimodal stimulation screens reveal unique and shared genes limiting T cell fitness

Affiliations

Multimodal stimulation screens reveal unique and shared genes limiting T cell fitness

Chun-Pu Lin et al. Cancer Cell. .

Abstract

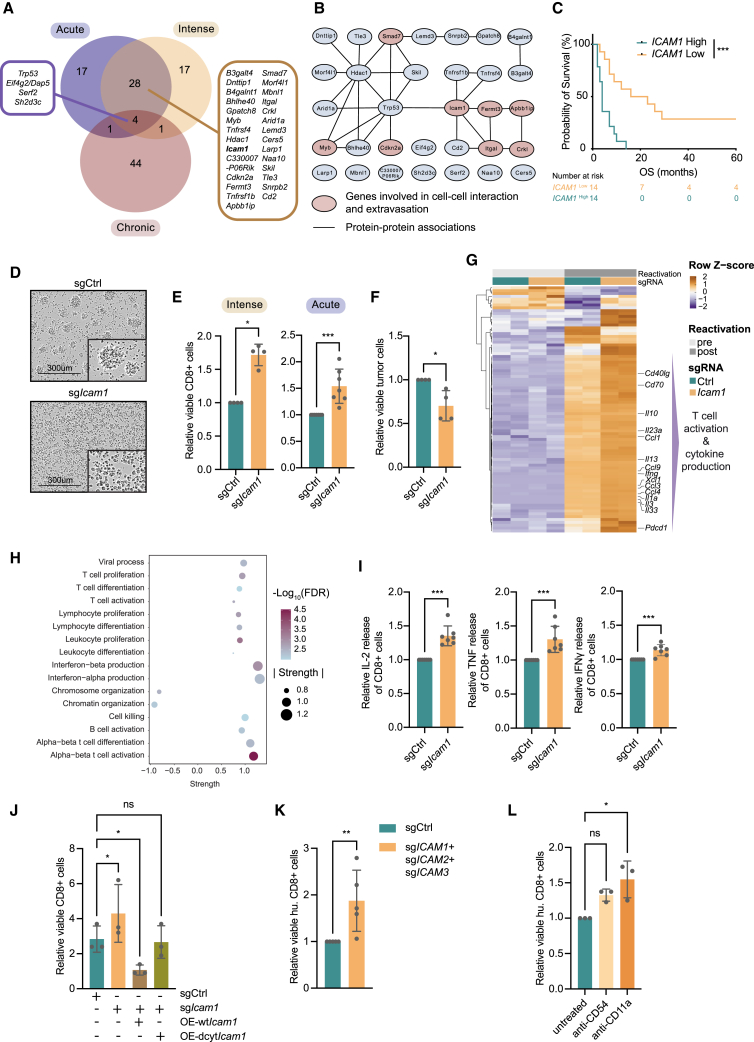
Genes limiting T cell antitumor activity may serve as therapeutic targets. It has not been systematically studied whether there are regulators that uniquely or broadly contribute to T cell fitness. We perform genome-scale CRISPR-Cas9 knockout screens in primary CD8 T cells to uncover genes negatively impacting fitness upon three modes of stimulation: (1) intense, triggering activation-induced cell death (AICD); (2) acute, triggering expansion; (3) chronic, causing dysfunction. Besides established regulators, we uncover genes controlling T cell fitness either specifically or commonly upon differential stimulation. Dap5 ablation, ranking highly in all three screens, increases translation while enhancing tumor killing. Loss of Icam1-mediated homotypic T cell clustering amplifies cell expansion and effector functions after both acute and intense stimulation. Lastly, Ctbp1 inactivation induces functional T cell persistence exclusively upon chronic stimulation. Our results functionally annotate fitness regulators based on their unique or shared contribution to traits limiting T cell antitumor activity.

Keywords: CRISPR-Cas9 screen; Ctbp1; Dap5; Icam1; T cells; activation-induced cell death; cancer immunotherapy; dysfunction; effector function; exhaustion.


Conflict of interest statement

Declaration of interests C.L., P.L., A.A., G.A., M.A.L., D.W.V., and D.S.P. are named as inventors on a patent filed by the Netherlands Cancer Institute and Oncode on the findings described in this manuscript. D.S.P. and M.A.L. are co-founders, shareholders, and advisors of Immagene.

Figures

None
Graphical abstract
Figure 1
Figure 1
Multimodal function-based genome-wide CRISPR knockout screens for genes contributing to T cell fitness upon differential stimulation (A) T cell stimulation screens setup. (B) Marker expression heatmap from flow cytometry analysis of T cells stimulated with indicated conditions as in (A). Z score indicates the fold change to resting cells. (C) MAGeCK analysis of screen results (Table S1). (D) Enrichment of individual sgRNAs targeting genes identified from published T cell screens. Numbers above plots indicate signed -Log10(MAGeCK score). (E) GSEA of GO biological process from screen hits (Table S1). FDR: false discovery rate. (F) GSEA of CD8 lineage gene sets from screen hits (Tables S1 and S5). NES: normalized effect size. (G) Numbers of overlapping genes from top 50 hits of each screen. Genes are listed by average effect size (Table S1).
Figure 2
Figure 2
Dap5 inactivation alleviates global inhibition of effector T cell fitness and enhances tumor-killing capacity (A) Enrichment of individual sgRNAs targeting overlapping genes (4 sgRNAs/gene). Numbers above plots indicate signed -Log10(MAGeCK score). (B) Kaplan-Meier OS curves of patients receiving TIL therapy (Besser cohort), with top and bottom third highest and lowest (33.3%) DAP5 or SERF2 expression in TIL products. Significance calculated by regular log rank test. (C) Viable cell number under indicated stimulation conditions, analyzed with two-tailed paired t test (n = 3–5 biological replicates). (D) Viable cell count after 96 h co-culturing with D4M.OVA cells, analyzed with Mann-Whitney test (n = 5 biological replicates). (E) Tumor cell survival after co-culture with Ctrl and Dap5-KO T cells, analyzed with two-tailed paired t test (n = 7 biological replicates). (F) Outline for generating human CD8 cells expressing MART-1-reactive 1D3 TCR. 1. Retroviral-transduction 2. Nucleofection. RNPs: ribonucleoprotein particles. (G) Viable human Ctrl and DAP5-KO MART-1 CD8 cell count after 72 h co-culture with A375-HLA-A02:01/MART-1 cells, analyzed with Mann–Whitney test (n = 4 biological replicates). (H) Transcriptomic profiling heatmap of indicated T cells pre/post 24 h-CD3 stimulation, showing significantly (p value <0.001) differentially expressed genes (Table S2). (I) Absolute Log2(fold-change) of CD3 stimulation-induced upregulated and downregulated genes, related to (H) (Table S2). (J) Flow cytometry analysis on cells, with or without 24 h-CD3 stimulation, analyzed with one-way ANOVA, followed by a Tukey post-hoc test (n = 9 biological replicates). (K) Representative flow cytometry plots (n = 2 biological replicates) showing apoptotic T cells. (L) Flow cytometry analysis of T cells 4 days after CD3 stimulation, analyzed with Mann-Whitney test (n = 4 biological replicates). (M) Outline of in vivo competition assay. (N) Left: Flow cytometry plot showing T cell mixes, input or isolated from tumors 3 days after ACT. Right: Quantification of in vivo competition assay, analyzed with two-tailed paired t test (n = 5 mice/group). (O) Outline of ACT tumor model. (P) B16.OVA tumor growth in mice treated with either Ctrl or Dap5-KO T cells, as in (O), analyzed with a two-tailed unpaired t test per time point. Error bars represent SEM (n = 9 mice/group). Error bars indicate SD, unless otherwise specified. p < 0.05; ∗∗p < 0.01; ∗∗∗p < 0.001; ∗∗∗∗p < 0.0001.
Figure 3
Figure 3
Loss of Icam1-mediated homotypic T cell interactions amplifies CD8 T cell expansion and improves effector functions shortly after TCR stimulation (A) Overlapping genes from top 50 hits from each screen, genes are ranked by average effect size. (B) STRING protein-protein interaction analysis of shared targets from the two boxes in (A) (32 genes). Interactions include direct (physical) and indirect (functional) associations. (C) Kaplan-Meier OS curves of patients receiving TIL therapy, (Besser cohort) with high or low ICAM1 expression in TIL products. Significance calculated with regular log rank test. (D) Microscopy images of indicated T cells 24 h after CD3 stimulation (n = 7 biological replicates). (E) Viable Ctrl and Icam1-KO T cell counts under indicated stimulation conditions as in the screens, analyzed with Mann-Whitney test (n = 4–7 biological replicates). (F) Viable B16.OVA cells after 4 days co-culture with indicated T cells, analyzed with Mann-Whitney test (n = 4 biological replicates). (G) Transcriptomic profiling heatmap of indicated T cells with or without 24 h-CD3 stimulation, showing significantly (p value <0.001) differentially expressed genes (Table S3). (H) Proteomic STRING enrichment analysis of differentially expressed proteins comparing Icam1-KO with Ctrl T cells after 24 h-CD3 stimulation, showing top enriched GO biological process (ranked by enrichment strength (Log10(observed/expected)) with FDR < 0.1 (Table S3). (I) Flow cytometry-based cytokine bead array showing cytokines released in the culture medium of indicated T cells after 24 h-CD3 stimulation, analyzed with Mann-Whitney test (n = 7 biological replicates). (J) Viable cell counts of Ctrl or Icam1-KO T cells ectopically expressing wild type (wt) or mutated ICAM1 (lacking the intracellular domain, dcyt). Cell count was assessed 4 days after CD3 stimulation; analyzed with one-way ANOVA with Holm-Sidak’s multiple comparisons test (n = 3 biological replicates). OE: overexpression. (K) Viable cell counts of Ctrl or ICAM1/2/3-KO human T cells 1 week after 24 h-CD3 stimulation, analyzed with Mann-Whitney test (n = 5 biological replicates). (L) Viable cell counts of human CD8 cells 1week after CD3 stimulation with or without CD54 (ICAM1) or CD11a (LFA1) blocking antibodies, analyzed with Kruskal-Wallis test with Dunn’s post-hoc test (n = 3 biological replicates). Error bars indicate SD. p < 0.05; ∗∗p < 0.01; ∗∗∗p < 0.001; ∗∗∗∗p < 0.0001.
Figure 4
Figure 4
Ctbp1 ablation induces T cell persistence exclusively under chronic stimulation, associated with reduced ZEB2/T-bet-dependent terminal differentiation (A) Overlapping genes from top 50 hits of each screen, listing top exclusive genes from the chronic stimulation screen (ranked by effect size). Genes selected for validation are in bold. (B) -Log10(MAGeCK score) for all genes in the chronic stimulation screen. (C) In vitro validation of top-ranking hits exclusively from the chronic stimulation screen, showing relative viable T cell count after 11 days chronic D4M.OVA stimulation as in the screen. Top 25 genes with 4/4 enriched sgRNAs were re-ranked by effect size (LFC, log2(fold change)), and top 10 genes were selected for validation. Cell count fold-change was normalized to resting condition (Figure S4B). Analyzed with one-way ANOVA, followed by a Dunnett post-hoc test from three biological replicates with two different sgRNAs per replicate (n = 3x2). (D) Relative viable cell counts of T cells expressing indicated sgRNAs after prolonged (3 weeks) chronic D4M.OVA stimulation. Genes with significantly increased cell count after chronic stimulation (Figure 4C), but without proliferation (dis-) advantage (+/− 25% change) under resting condition (Figure S4B), were selected for prolonged chronic in vitro stimulation. Analyzed with one-way ANOVA, followed by a Dunnett post-hoc test from three biological replicates with two different sgRNAs per replicate (n = 3x2). (E) Relative viable cell counts of T cells expressing Ctrl or different sgRNAs targeting Ctbp1 after > 2 weeks chronic tumor-antigen-stimulation. Analyzed with one-way ANOVA with Holm-Sidak’s multiple comparisons test (n = 3 biological replicates). (F) Relative viable cell counts of Ctrl and Ctbp1-KO T cells after > 2 weeks chronic B16.OVA or D4M.OVA stimulation, analyzed with Mann-Whitney test (n = 4 biological replicates). (G) Relative viable cell counts of indicated Pmel/Cas9 T cells after >2 weeks chronic B16 tumor cell stimulation. Analyzed with Mann-Whitney test (n = 4 biological replicates). (H) Relative viable cell counts of human Ctrl and Ctbp1-KO MART-1 CD8 cells after 3–5 weeks co-culturing with D10 melanoma cells (expressing endogenous MART-1 antigen). Analyzed with Mann-Whitney test from four biological replicates with two different sgRNAs per replicate (n = 4x2). (I) Transcriptomic profiling heatmap of indicated T cells 3 weeks post D4M.OVA chronic stimulation, showing significantly (p value <0.001) differentially expressed genes. Pure T cells were sorted by flow cytometry (Table S4). (J) GSEA of exhaustion signature, Chronic_>D15 (UP in Tex, as in Figure 1F), comparing Ctbp1-KO to Ctrl T cells after chronic stimulation. (K) Immunoprecipitation mass spectrometry (IP-MS) analysis of CTBP1 from wt OT-I/Cas9 cells after CD3 stimulation (n = 2 independent experiments with different IP buffers, see also Figure S4H; Table S4). Proteins identified from both independent IP-MS are in pink. 1% Triton X-100 IP buffer was used. (L) GSEA of ZEB1-KO_UP (AIGNER_ZEB1_TARGETS) and ZEB2-KO_UP signatures (UP in ZEB1 or ZEB2 KO cells), comparing Ctrl and Ctbp1-KO T cells after chronic stimulation (Table S5). (M) Flow cytometry analysis of indicated T cells after 3 weeks chronic stimulation, analyzed with two-tailed paired t test (n = 4 biological replicates). (N) Expression of memory precursor (MP) signature genes known to be repressed by T-bet but either dependent or independent of ZEB2 regulation, related to I) (Table S4). (O) Quantification of (N). Analyzed with two-tailed unpaired t test (n = 3 biological replicates). Error bars indicate SD. p < 0.05; ∗∗p < 0.01; ∗∗∗p < 0.001; ∗∗∗∗p < 0.0001.
Figure 5
Figure 5
Blocking CTBP1-mediated terminal T cell differentiation preserves T cell effector function and enables long-term tumor control (A) Crystal violet (CV) staining quantification of viable B16.OVA tumor cells after 4 days co-cultured with equal amounts of indicated OT-I/Cas9 cells that were rested or chronically stimulated with tumor cells for 3 weeks. Analyzed with two-tailed paired t test (n = 3 biological replicates). (B) Flow cytometry analysis of IFNγ and TNF double-positive population of indicated OT-I/Cas9 cells after 3 weeks D4M.OVA stimulation. Cells were re-stimulated with PMA/Ionomycin prior to analysis. Left: representative plot. Right: Quantification. Analyzed with Mann-Whitney test (n = 7 biological replicates). (C) As in (B), showing Ki67 expression, analyzed with two-tailed paired t test (n = 4 biological replicates). (D–G) Flow cytometry analyses of indicated marker expression on Ctrl and Ctbp1-KO T cells after 3 weeks chronic D4M.OVA stimulation, analyzed with two-tailed paired t test (D, E, G) or Mann-Whitney test (F). Data points indicate biological replicates. (H) Outline of in vivo prolonged tumor antigen stimulation ACT experiment, related to Figures 5I–5L, S5H, and S5I. (I) Flow cytometry analyses of marker expression on transferred T cells isolated from tumors 7 days after viable tumor cell transplantation, as in (H). KLRG1-/CD127+ cells are considered less terminally differentiated. Analyzed with two-tailed unpaired t test (n = 6 mice/group). (J) Tumor size 20 days after viable tumor injection, as in (H) (when first mouse dropped out at tumor endpoint), showing data pooled from 2 independent experiments. Analyzed with two-tailed unpaired t test. (n = 18 mice/group). (K) Measurement of tumor outgrowth as in (H), analyzed with two-tailed unpaired t test (n = 18 mice/group). Error bars indicate SEM. (L) Kaplan-Meier plot depicting the survival of B16.OVA tumor-bearing mice as in (H), analyzed with regular log rank test (n = 18 mice/group). (M) CTBP1 expression in CD8Tex and CD8T cells from 49 scRNA-seq datasets (pan-cancer). Expression level was directly derived from TISCH2 website analysis (Table S2). TPM: transcripts per million. Analyzed with Wilcoxon test (n = 49 independent datasets). Error bars indicate SD unless otherwise specified. p < 0.05; ∗∗p < 0.01; ∗∗∗p < 0.001; ∗∗∗∗p < 0.0001.
Figure 6
Figure 6
Unique and shared genes limiting T cell fitness identified in multimodal stimulation screens (Left) When effector T cells receive TCR stimulation, they undergo rapid proliferation accompanied by AICD, limiting expansion. When antigen-stimulation persists, cells eventually become terminally differentiated, apoptotic, or dysfunctional. (Right) Intense, acute, and chronic stimulation screens reveal factors regulating either common or specific T cell fitness traits. Dap5 depletion in activated T cells stimulates global mRNA translation, upregulates cell cycle gene activity, and suppresses FAS expression, allowing cell pool expansion under all three stimulation conditions. Icam1 ablation or Icam-LFA1 interaction blockade prevents T cell hyperclustering upon stimulation, allowing increased exposure to stimulation signals. This contributes to their stronger cytotoxicity and expansion, especially after intense and acute stimulation. On the contrary, Ctbp1 depletion does not influence T cell expansion in the short run, but benefits their long-term persistence and functionality exclusively under chronic stimulation. It exerts this effect by hindering CTBP1/ZEB2/T-bet co-regulated effector terminal differentiation.

Similar articles

Cited by

References

    1. Borghaei H., Paz-Ares L., Horn L., Spigel D.R., Steins M., Ready N.E., Chow L.Q., Vokes E.E., Felip E., Holgado E., et al. Nivolumab versus Docetaxel in Advanced Nonsquamous Non–Small-Cell Lung Cancer. N. Engl. J. Med. 2015;373:1627–1639. doi: 10.1056/NEJMOA1507643/SUPPL_FILE/NEJMOA1507643_APPENDIX.PDF. - DOI - PMC - PubMed
    1. Van Den Berg J.H., Heemskerk B., Van Rooij N., Gomez-Eerland R., Michels S., Van Zon M., De Boer R., Bakker N.A.M., Jorritsma-Smit A., Van Buuren M.M., et al. Tumor infiltrating lymphocytes (TIL) therapy in metastatic melanoma: boosting of neoantigen-specific T cell reactivity and long-term follow-up. J. Immunother. Cancer. 2020;8:e000848. doi: 10.1136/JITC-2020-000848. - DOI - PMC - PubMed
    1. Hodi F.S., O'Day S.J., McDermott D.F., Weber R.W., Sosman J.A., Haanen J.B., Gonzalez R., Robert C., Schadendorf D., Hassel J.C., et al. Improved Survival with Ipilimumab in Patients with Metastatic Melanoma. N. Engl. J. Med. 2010;363:711–723. doi: 10.1056/NEJMOA1003466. - DOI - PMC - PubMed
    1. Maude S.L., Frey N., Shaw P.A., Aplenc R., Barrett D.M., Bunin N.J., Chew A., Gonzalez V.E., Zheng Z., Lacey S.F., et al. Chimeric Antigen Receptor T Cells for Sustained Remissions in Leukemia. N. Engl. J. Med. 2014;371:1507–1517. doi: 10.1056/NEJMOA1407222/SUPPL_FILE/NEJMOA1407222_DISCLOSURES.PDF. - DOI - PMC - PubMed
    1. Dudley M.E., Wunderlich J.R., Robbins P.F., Yang J.C., Hwu P., Schwartzentruber D.J., Topalian S.L., Sherry R., Restifo N.P., Hubicki A.M., et al. Cancer regression and autoimmunity in patients after clonal repopulation with antitumor lymphocytes. Science. 2002;298:850–854. doi: 10.1126/SCIENCE.1076514/SUPPL_FILE/DUDLEY.SOM.PDF. - DOI - PMC - PubMed