. 2024 Mar 15;13(1):75.
doi: 10.1038/s41377-024-01418-0.

Ultra-high-Q free-space coupling to microtoroid resonators

Affiliations

Ultra-high-Q free-space coupling to microtoroid resonators

Sartanee Suebka et al. Light Sci Appl. .

Abstract

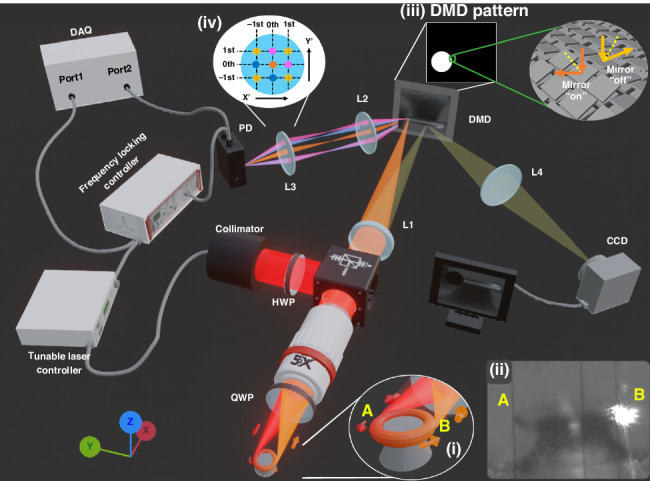
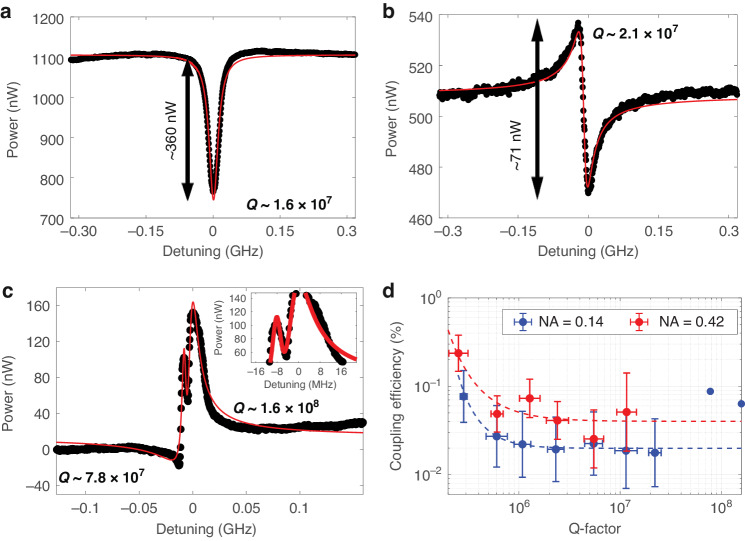
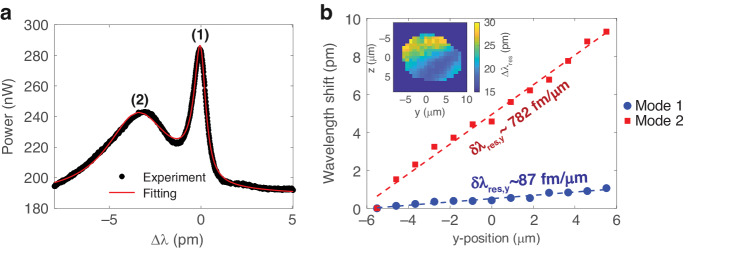
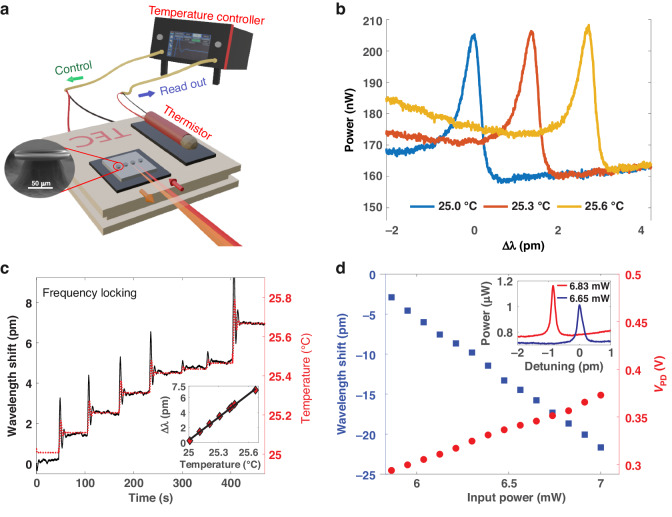
Whispering gallery mode (WGM) microtoroid resonators are one of the most sensitive biochemical sensors in existence, capable of detecting single molecules. The main barrier for translating these devices out of the laboratory is that light is evanescently coupled into these devices though a tapered optical fiber. This hinders translation of these devices as the taper is fragile, suffers from mechanical vibration, and requires precise positioning. Here, we eliminate the need for an optical fiber by coupling light into and out from a toroid via free-space coupling and monitoring the scattered resonant light. A single long working distance objective lens combined with a digital micromirror device (DMD) was used for light injection, scattered light collection, and imaging. We obtain Q-factors as high as 1.6 × 10 8 with this approach. Electromagnetically induced transparency (EIT)-like and Fano resonances were observed in a single cavity due to indirect coupling in free space. This enables improved sensing sensitivity. The large effective coupling area (~10 μm in diameter for numerical aperture = 0.14) removes the need for precise positioning. Sensing performance was verified by combining the system with the frequency locked whispering evanescent resonator (FLOWER) approach to perform temperature sensing experiments. A thermal nonlinear optical effect was examined by tracking the resonance through FLOWER while adjusting the input power. We believe that this work will be a foundation for expanding the implementation of WGM microtoroid resonators to real-world applications.


Conflict of interest statement

J.S. owns a financial stake in Femtorays Technologies, which develops label-free molecular sensors.

Figures

Fig. 1
Fig. 1. Overview of the free-space coupling system.
L1: tube lens. L2 and L3 are bi-convex lenses and together form a 4f configuration to collect several diffraction orders on the photodetector (PD). L4, which is also a bi-convex lens, is the imaging lens. The yellow-brown cone indicates illumination light which comes from a ring light around the objective and not from the cavity. Inset (i) Schematic of the coupled microtoroid in free space. The laser converges at edge A to couple into the cavity as indicated by the red cone. At the resonance wavelength, the coupled wavelength is confined in the cavity. The scattering light from edge B is then collected by the same objective lens to observe the resonance wavelength as indicated by the orange cone. Inset (ii) Image from the CCD during an experiment. Vertical black lines are due to inactive pixel lines. Inset (iii) DMD pattern to select the ROI. Micromirrors in the white area are directed to the PD. The mirrors in the black area are directed to CCD for imaging. Inset (iv) Schematic of different diffraction orders on the L3 plane
Fig. 2
Fig. 2. Resonance line shapes and free space coupling efficiency.
ac Resonance line shapes observed from the free-space coupling system. Black dots and solid red lines show experimental results, and their relevant curve fit depending on their shape. a Lorentzian line shape (fitted with Eq. (1)) b standard Fano line shape (fitted with Eq. (2)) c generalized Fano line shape (fitted with Eq. (3)). d Efficiency vs Q-factor for two different objective lenses. Dashed lines indicate the trend. Blue and red plots show results from NA = 0.14 and 0.42 objective lenses, respectively. The data from 140 resonance modes from 57 microtoroids was divided into ten different groups by Q factor in log scale. The error bars were then plotted as the standard deviation of the Q-factor and % coupling efficiency in each group, see Fig. S7 in Supplementary Note 3 for more detail
Fig. 3
Fig. 3. Free-space coupling map.
The ×5 objective lens (NA = 0.14) was used for all panels. a Resonance curve at different microtoroid position numbers, which correspond to the lines indicated in b. b Color indicates the resonance power. The y position is defined to be zero at the highest resonance power calculated from Eq. (8). Positive y-positions mean decreased beam-cavity distance. c Fano parameter and phase shift vs y position. d Resonance power calculated from Eq. (8) and Q-factor calculated from linewidth obtained from Eq. (2) vs y-position. Dashed blue line indicates the figure of merit level (a.u.). y positions in the range of −2.5 to 7.5 μm provide maximum figure of merit
Fig. 4
Fig. 4. Free-space coupling map.
The ×5 objective lens (NA = 0.14) was used for all panels. a SEM image of a microtoroid. The yellow circle diameter is the minor diameter. b Resonance curve at y,z=0,0, which is the position with the highest power. c, d Spectrograms of light scattering out of the microtoroid, when scanned along the y axis (c) and the z axis (d). Δλ represents the detuning wavelength. e Resonance power map in the YZ plane (f) Resonance wavelength shift map in the YZ plane. Only data with coupling powers higher than 0.06 times the max coupling power are plotted in color. g Background map in the YZ plane. h, i Power along the y axis at z = 0 (h) and along the z axis at y = 0 (i). Solid lines show the fits to a Gaussian equation for determining the FWHM
Fig. 5
Fig. 5. Mode crossing induced by positioning the microtoroid relative to the laser focus.
a Resonance curve with two resonance modes fitted with Eq. (3). b Resonance wavelength shift along y axis at z = 0. (Inset) Map of the difference in resonance wavelength shift between the two modes
Fig. 6
Fig. 6. Free-space coupling map of fundamental and higher-order modes.
Data were acquired using a ×20 objective lens (NA = 0.42). a Coupling map of the fundamental mode. Dashed red lines indicate the y and z axes. b Coupling map of a higher order mode. The dashed white circle shows the microtoroid cross-section corresponding to the circle in Fig. 4a, inset. The microtoroid center is on the right side. c Simulated electric field distribution using COMSOL. The labels along the lower axis show the distance from microtoroid’s axis of revolution. The color indicates the electric field magnitude. White arrows represent the electric field direction
Fig. 7
Fig. 7. Coupling zone sizes.
The normalized efficiency is shown along the a x axis, b y axis, and c z axis for a ×5 and a ×20 objective lens (NA = 0.14 and NA = 0.42). Each curve is fitted with a Gaussian equation as shown as a solid line. For NA = 0.14 in b, c, there are three sets of data. The blue solid lines show the fit to the average data. The shaded areas indicate the standard deviation from the average of experiment data (n = 3)
Fig. 8
Fig. 8. Temperature sensing experiment using free-space coupling.
a Schematic of the experimental setup. Red and orange cones represent input and scattering light, respectively. b Resonance curves at different temperatures. ∆λ, the wavelength detuning, is defined to be zero for the peak wavelength at the starting time. c Temperature sensing results using FLOWER. The black and red lines indicate resonance wavelength shift and temperature measured from the thermistor. (Inset) Resonance wavelength shift vs temperature. The sensor shows a strong linearity providing a slope of 10.2 pm/°C. d Thermal nonlinearity observation. The resonance wavelength shift and photodetector signal (VPD) vs free space input laser power using FLOWER. (Inset) Resonance curves with two different free space input laser powers were observed using a scanning method

References

    1. Su J. Label-free biological and chemical sensing using whispering gallery mode optical resonators: past, present, and future. Sensors. 2017;17:540. doi: 10.3390/s17030540. - DOI - PMC - PubMed
    1. Armani DK, et al. Ultra-high-Q toroid microcavity on a chip. Nature. 2003;421:925–928. doi: 10.1038/nature01371. - DOI - PubMed
    1. Suebka S, et al. How fast it can stick: visualizing flow delivery to microtoroid biosensors. ACS Sens. 2021;6:2700–2708. doi: 10.1021/acssensors.1c00748. - DOI - PubMed
    1. Su J, Goldberg AF, Stoltz BM. Label-free detection of single nanoparticles and biological molecules using microtoroid optical resonators. Light Sci. Appl. 2016;5:e16001. doi: 10.1038/lsa.2016.1. - DOI - PMC - PubMed
    1. Lu, T. et al. Split frequency sensing methods and systems. US Patent US 8,593,638 (2013).