. 2024 Mar 15;15(1):2270.
doi: 10.1038/s41467-024-46210-1.

Proinflammatory polarization of engineered heat-inducible macrophages reprogram the tumor immune microenvironment during cancer immunotherapy

Affiliations

Proinflammatory polarization of engineered heat-inducible macrophages reprogram the tumor immune microenvironment during cancer immunotherapy

Yanan Xue et al. Nat Commun. .

Abstract

The success of macrophage-based adoptive cell therapy is largely constrained by poor polarization from alternatively activated (M2-like) to classically activated (M1-like) phenotype in the immunosuppressive tumor microenvironment (TME). Here, we show that the engineered macrophage (eMac) with a heat-inducible genetic switch can induce both self-polarization of adoptively transferred eMac and re-polarization of tumour-associated macrophages in response to mild temperature elevation in a mouse model. The locoregional production of proinflammatory cytokines by eMac in the TME dose not only induces the strong polarization of macrophages into a classically activated phenotype, but also ensures that the side effects typical for systemically administrate proinflammatory cytokines are avoided. We also present a wearable warming device which is adaptable for human patients and can be remotely controlled by a smartphone. In summary, our work represents a safe and efficient adoptive transfer immunotherapy method with potential for human translation.


Conflict of interest statement

The authors declare no competing interests.

Figures

Fig. 1
Fig. 1. Schematic illustration of wireless remote control of macrophage polarization by an intelligent warming device (iWarm) for melanoma immunotherapy.
a Engineering of BMDMs and polarization of macrophages by smartphone-controlled iWarm for tumor immunotherapy. Mechanism of inducible heat shock (HS) regulation of dCas9-based transcriptional activation of Ifng and IFN-γ secretion before (b) and after heating (c). Hyperthermia in the intracellular microenvironment induces the transformation of the heat shock factor from inactive monomers to active trimers that are able to translocate into the nucleus. Subsequently, the binding between the intranuclear trimers and the heat shock element of the HSP70 promoter results in the transcription of dCas9 system. The assembled CRISPR/dCas9 gene-regulation system then activates IFN-γ expression.
Fig. 2
Fig. 2. Characterization of the wireless-controlled heat-inducible gene expression.
a The interface of application (APP) for the remote control of iWarm. b Detailed electric circuit diagram of the iWarm. c The remote control of iWarm from home via internet and the real-time temperature cycle curve of iWarm after heating and cooling of five cycles in lab. d Illustration of wireless control of EGFP expression in macrophages. e RAW264.7 cells were transfected with HSP70-EGFP plasmids and cultured for 8 h before being heated at different temperature for 30 min controlled by a smartphone. This experiment was repeated three times independently with similar results. The positive EGFP cells were evaluated 24 h after the heat shock and quantitative analysis of EGFP fluorescence by ImageJ (f). n = 3 biologically independent samples. EGFP expression after wireless-controlled heating at 42 °C for different duration (g), and quantitative analysis of EGFP fluorescence 24 h after the heating (h). This experiment was repeated three times independently with similar results. i Illumination time-dependent HS-mediated ON-OFF kinetics of transgene expression. By lentiviral transduction, EGFP expression was monitored every day after the heat shock at 42 °C for 30 min, which was carried at day 0, day 3, and day 6, respectively. This experiment was repeated three times independently with similar results. The EGFP-positive cells were further quantified by ImageJ (j). n = 3 biologically independent samples. Data are presented as mean ± SD and statistical significance was calculated via one-way analysis of variance (ANOVA) with Dunnett’s multiple comparison tests in (f) and (h). *P < 0.05; **P < 0.01; ***P < 0.001; ****P < 0.0001. Source data are provided as a Source Data file.
Fig. 3
Fig. 3. Heat shock (HS) polarizes engineered BMDMs (eBMDM) into a M1 phenotype in vitro.
a Illustration of engineering process of BMDM and the polarization of eBMDM by wireless-controlled secretion of IFN-γ. b The increase of IFN-γ by eBMDM after HS at 42 °C for 30 min. c The increment of IFN-γ by eBMDM after HS at 42 °C for 30 min at day 1 and day 3, respectively. The green arrow in (b) and (c) refers to the time point of HS. d Flow cytometry analysis and (e) quantitative analysis of CD86+ macrophages in eBMDM after the indicated treatment. RT-qPCR analysis of M1 macrophages markers (f) and M2 macrophages markers (g) after the indicated treatment. IFN-γ treated BMDMs and IL-4-treated BMDMs were used as positive controls. h Illustration of proinflammatory cytokines-mediated inhibition of tumor proliferation by using Transwell system. i Proinflammatory cytokines-mediated inhibition of tumor proliferation was determined by CCK8 assay with the indicated treatment. j Illustration of the phagocytosis of B16F10 cells by polarized M1 eBMDM. k, l Flow cytometry and quantitative analysis of the phagocytosis of BMDMs after the specified treatment. m Fluorescence images of the phagocytosis by BMDMs. B16F10 cells were labeled with CFSE (green), the cell membrane of eBMDM was labeled with DiI (red), and the nuclei of both cells were stained with DAPI (blue). The white arrows point to the B16F10 cell phagocytized by macrophages. n Illustration of the chemotaxis of eBMDM by Transwell assay. o The tumor-targeting tropism was evaluated by the number of BMDMs that migrates through the semipermeable membrane. p Quantitative analysis of cell migration ability in (o) after the specified treatment. CM stands for culture medium. Data are presented as mean ± SD, n = 3 biologically independent samples in (bo). Statistical significance was calculated via two-tailed paired t-test in (b) and one-way ANOVA with a Sidak’s multiple comparisons in (e) and one-way ANOVA with a Tukey’s multiple comparisons test in (i), (l) and (p). *P < 0.05; **P < 0. 01; ***P < 0.001; ****P < 0.0001. Source data are provided as a Source Data file.
Fig. 4
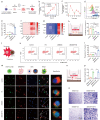
Fig. 4. eBMDM-mediated treatment in vivo controlled by iWarm.
a Fluorescence image of the eBMDM distribution in major organs and the tumor tissue after the intravenous (i.v.) injection of DiI-labeled eBMDM for 24 h. b Bioluminescence image of major organs and tumor tissue after the i.v. injection of HSP-luciferase-expressing eBMDM for 24 h, followed by locoregional hyperthermia in tumor tissue. c Bioluminescence image of tumor tissue after i.v. injection of HSP-luciferase-expressing eBMDM, followed by locoregional hyperthermia in tumor tissue for different times. d Illustration of B16F10 tumor therapy in vivo with eBMDM via remote control of locoregional hyperthermia. e In vivo bioluminescence images of mice after the specified treatment at day 0, day 7, day 14, and day 21, where B16F10 cells were tagged with luciferase. f Individual and g average tumor growth curves after the specified treatment. h Survival curves of mice after the specified treatment. i Illustration of wireless-controlled eBMDM for treating B16F10 tumor metastasis in vivo. j Bioluminescence image of lung metastatic nodules of the B16F10 tumors after the treatment. k H&E staining of lung metastatic nodules of B16F10 tumor after the treatment. Data are presented as mean ± SD, n = 3 biologically independent mice or samples in (a), (b), (j), (k); n = 4 biologically independent mice or samples in (cg) and n = 10 biologically independent mice in (h). Statistical significance was calculated via one-way ANOVA with a Tukey’s multiple comparisons test in (g). *P < 0.05; **P < 0.01; ***P < 0.001; ****P < 0.0001. Source data are provided as a Source Data file.
Fig. 5
Fig. 5. Wireless-controlled iWarm mediated the polarization of eBMDM and re-polarization of TAMs into a M1 phenotype, which trigger robust antitumor immunity in vivo.
RT-qPCR analysis of M1 (a) and M2 (b) macrophages markers in tumor tissues after the indicated treatment. c Flow cytometry analysis of the polarization of macrophages in tumor tissues after the indicated treatment. CD86+ is the marker of M1 macrophages, while CD206+ is the marker of M2 macrophages. d Quantitative analysis of the M1/M2 ratio of macrophages in (c). e Flow cytometry analysis the CD8+ T cells in tumor tissues after eBMDM treatment with or without heat shock. f, g Quantitative analysis of the ratio of CD8+ T cells in CD45+ cells and CD3+ cells. h IFN-γ and TNF-α levels in tumor tissues collected from mice after the indicated treatment. i IL-4 and IL-10 levels in tumor tissues collected from mice after the indicated treatment. j Multiplex IHC images of M1 macrophage and eBMDM infiltration in tumor tissues. In merged figures, DiI-positive and CD86-positive cells (orange) represent M1 eBMDM, CD86-positive only cells (green) represent re-polarized TAMs. k IHC images of M2 macrophage infiltration in tumor tissues. Data are presented as mean ± SD, n = 3 biologically independent samples in (ak). Statistical significance was calculated via one-way ANOVA with a Sidak’s multiple comparisons in (d) and one-way ANOVA with a Tukey’s multiple comparison tests in (fi). *P < 0.05; **P < 0.01; ***P < 0.001; ****P < 0.0001. Source data are provided as a Source Data file.
Fig. 6
Fig. 6. Macrophage depletion attenuates antitumor activity of adoptive eBMDM therapy mediated by wireless-controlled iWarm.
a Illustration of macrophage depletion and adoptive eBMDM therapy with wireless iWarm in vivo. b In vivo bioluminescence images of mice after the specified treatment at day 16. c, d The inhibition of tumor growth of tumor-bearing mice after the indicated treatment. e The survival curve of tumor-bearing mice after the indicated treatment. f Flow cytometry analysis the macrophages infiltration in tumor tissues after the indicated treatment. CD11bF4/80+ is the marker of macrophages. g The quantitative analysis of F4/80+ CD86+ macrophages in tumor tissues after the indicated treatment by flow cytometry. h Multiplex IHC images of macrophage and eBMDM infiltration in tumor tissues. i Flow cytometry analysis the CD4+ T cells and CD8+ T cells in tumor tissues after the indicated treatment. The quantitative analysis of the ratio of CD4+ T cells (j) and CD8+ T cells (k) in tumor tissues after the indicated treatment by flow cytometry. l IFN-γ levels in tumor tissues collected from mice after the indicated treatment. Data are presented as mean ± SD, n = 4 biologically independent mice in (bd); n = 10 biologically independent mice in (e), and n = 3 biologically independent samples in (gl). Statistical significance was calculated via one-way ANOVA with a Tukey’s multiple comparison tests in (d), (g), and (jl). *P < 0.05; **P < 0. 01; ***P < 0.001; ****P < 0.0001. Source data are provided as a Source Data file.
Fig. 7
Fig. 7. IFN-γ neutralization attenuates antitumor activity of adoptive eBMDM therapy mediated by wireless-controlled iWarm.
a Illustration of IFN-γ neutralization and adoptive eBMDM therapy with wireless iWarm in vivo. b In vivo bioluminescence images of mice after the specified treatment at day 11. Average (c) and individual (d) tumor growth curves after the specified treatment. e IFN-γ levels in tumor tissues collected from mice after the indicated treatment. Flow cytometry analysis the M1 polarization (f) and the M2 polarization (h) of macrophages in tumor tissues after the indicated treatment. CD86+ is the marker of M1 macrophages, while CD206+ is the marker of M2 macrophages. Quantitative analysis of the M1 (g) and M2 (i) ratio of macrophages in (e) and (g). j Flow cytometry analysis the CD8+ T cells in tumor tissues after the indicated treatment. k Quantitative analysis of the ratio of CD8+ T cells. Data are presented as mean ± SD, n = 3 biologically independent mice or samples in (ak). Statistical significance was calculated via two-tailed unpaired t-test in (c) and one-way ANOVA with a Tukey’s multiple comparison tests in (e), (g), (i), and (k). *P < 0.05; **P < 0.01; ***P < 0.001; ****P < 0.0001. Source data are provided as a Source Data file.

Similar articles

Cited by

References

    1. Larson RC, Maus MV. Recent advances and discoveries in the mechanisms and functions of CAR T cells. Nat. Rev. Cancer. 2021;21:145–161. doi: 10.1038/s41568-020-00323-z. - DOI - PMC - PubMed
    1. Myers JA, Miller JS. Exploring the NK cell platform for cancer immunotherapy. Nat. Rev. Clin. Oncol. 2021;18:85–100. doi: 10.1038/s41571-020-0426-7. - DOI - PMC - PubMed
    1. Anderson NR, Minutolo NG, Gill S, Klichinsky M. Macrophage-based approaches for cancer immunotherapy. Cancer Res. 2021;81:1201–1208. doi: 10.1158/0008-5472.CAN-20-2990. - DOI - PubMed
    1. Weber EW, Maus MV, Mackall CL. The emerging landscape of immune cell therapies. Cell. 2020;181:46–62. doi: 10.1016/j.cell.2020.03.001. - DOI - PMC - PubMed
    1. Shah NN, et al. Bispecific anti-CD20, anti-CD19 CAR T cells for relapsed B cell malignancies: a phase 1 dose escalation and expansion trial. Nat. Med. 2020;26:1569–1575. doi: 10.1038/s41591-020-1081-3. - DOI - PubMed