. 2024 Mar 15;15(1):2340.
doi: 10.1038/s41467-024-46665-2.

Translation efficiency driven by CNOT3 subunit of the CCR4-NOT complex promotes leukemogenesis

Affiliations

Translation efficiency driven by CNOT3 subunit of the CCR4-NOT complex promotes leukemogenesis

Maryam Ghashghaei et al. Nat Commun. .

Erratum in

Abstract

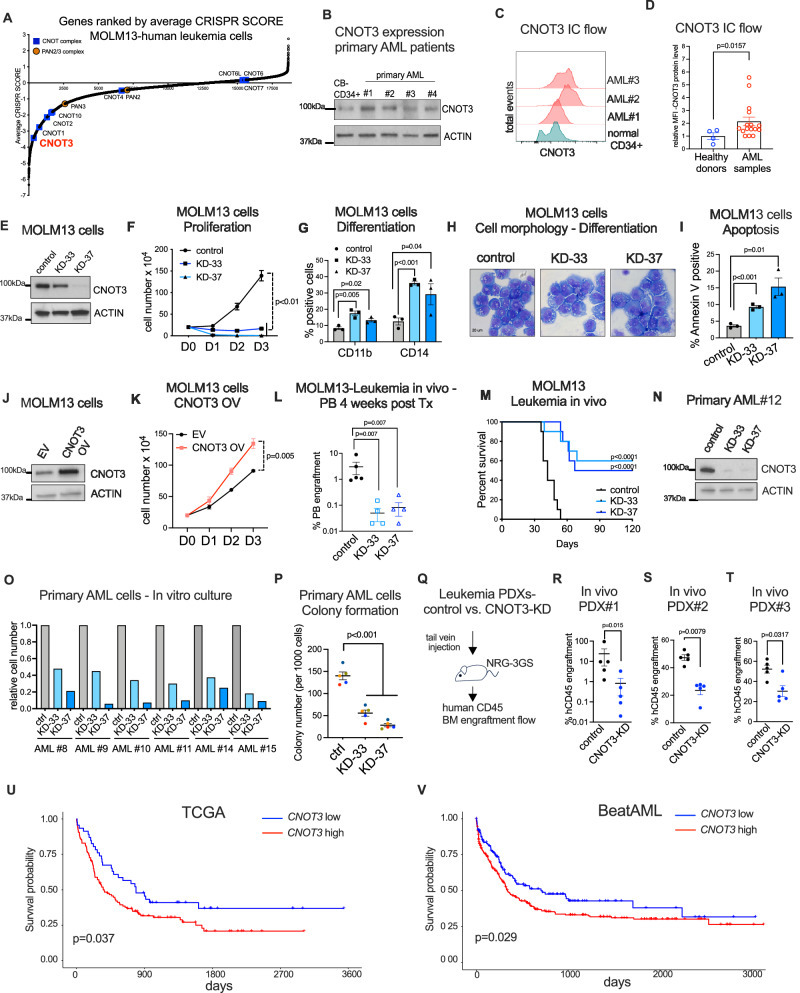
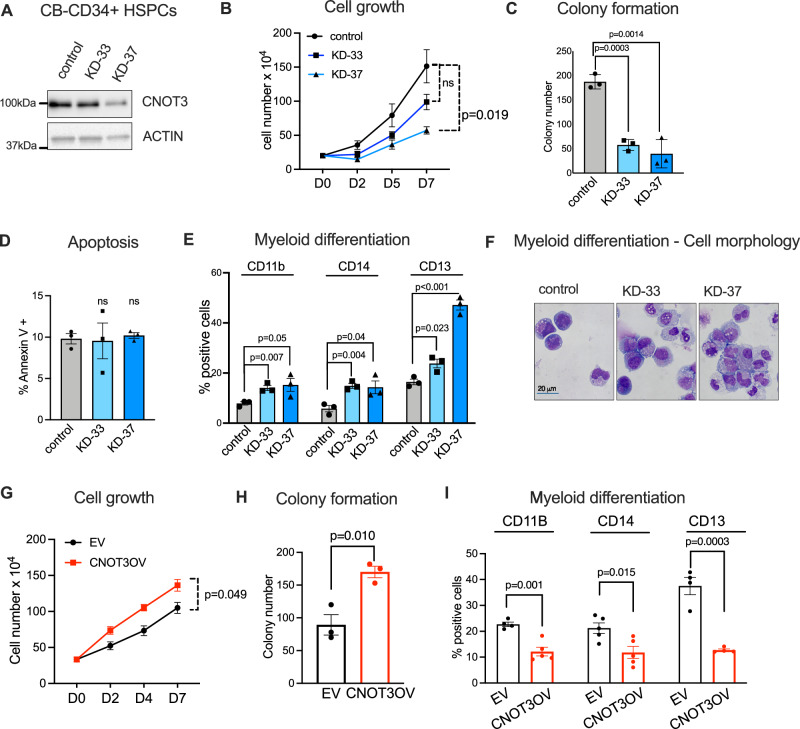
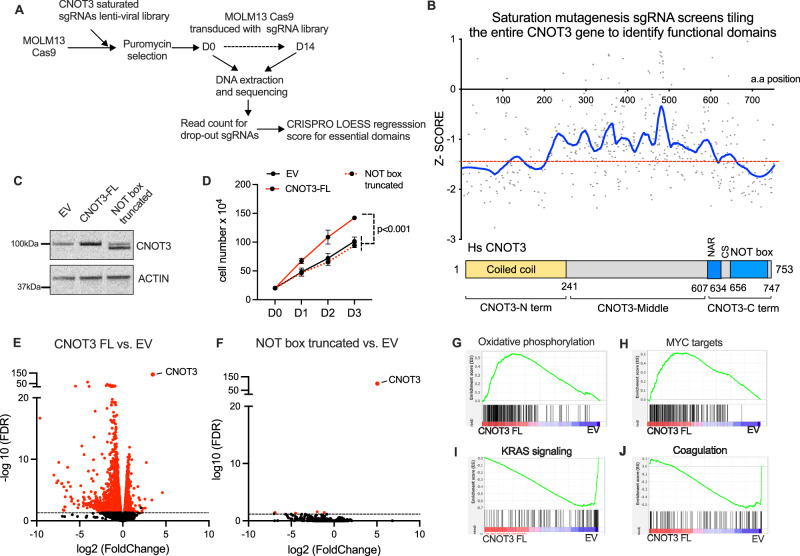
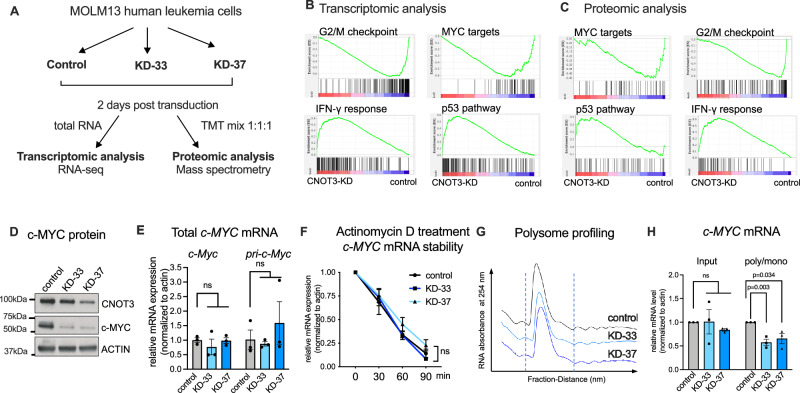
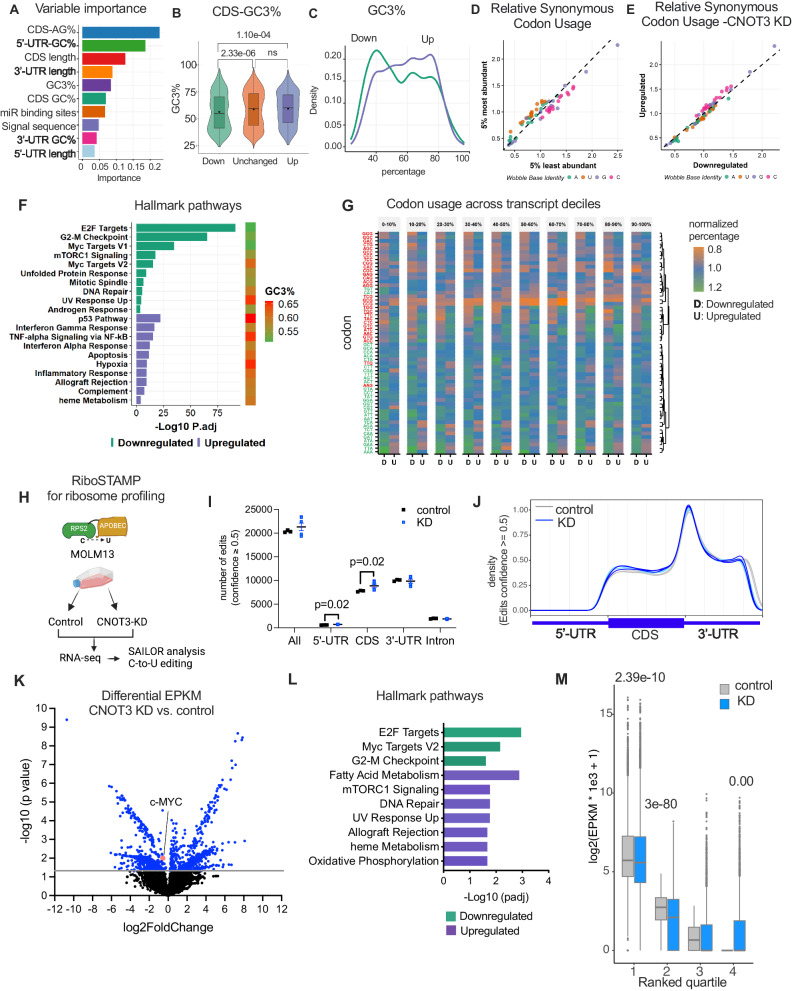
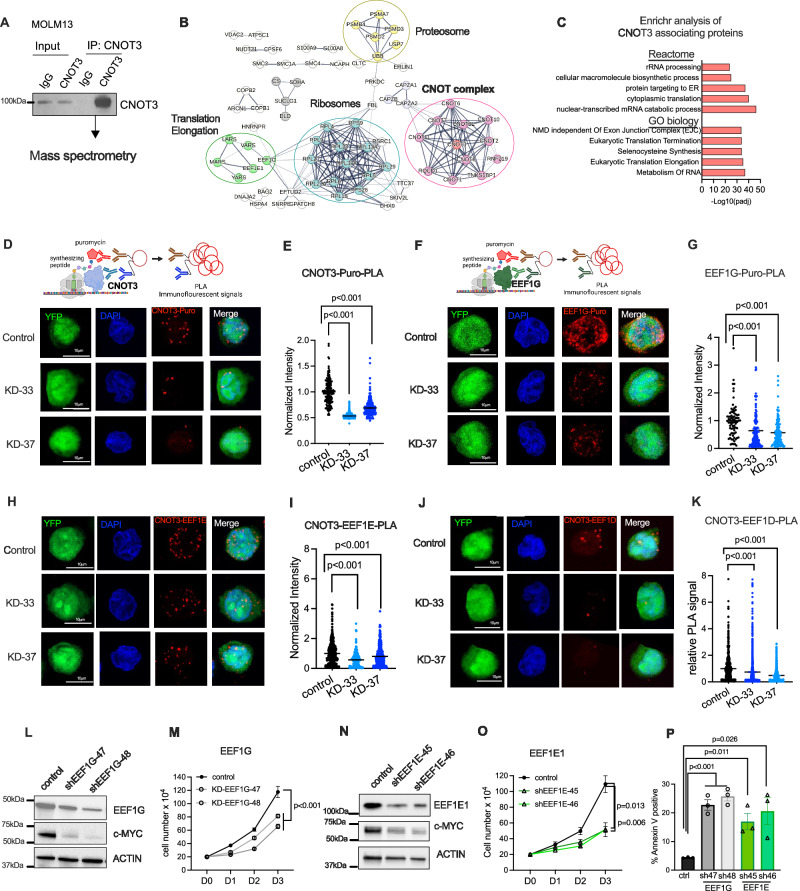
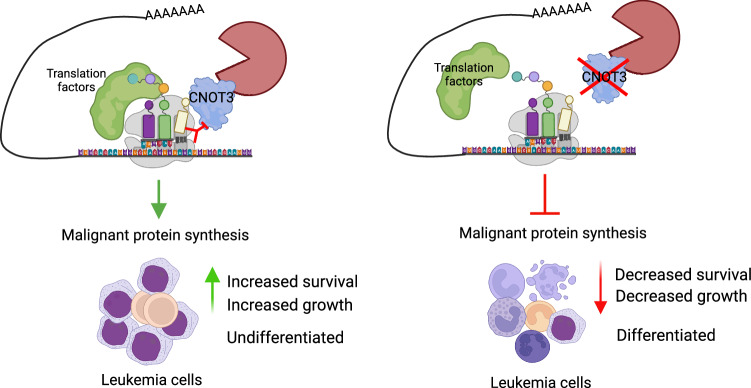
Protein synthesis is frequently deregulated during tumorigenesis. However, the precise contexts of selective translational control and the regulators of such mechanisms in cancer is poorly understood. Here, we uncovered CNOT3, a subunit of the CCR4-NOT complex, as an essential modulator of translation in myeloid leukemia. Elevated CNOT3 expression correlates with unfavorable outcomes in patients with acute myeloid leukemia (AML). CNOT3 depletion induces differentiation and apoptosis and delayed leukemogenesis. Transcriptomic and proteomic profiling uncovers c-MYC as a critical downstream target which is translationally regulated by CNOT3. Global analysis of mRNA features demonstrates that CNOT3 selectively influences expression of target genes in a codon usage dependent manner. Furthermore, CNOT3 associates with the protein network largely consisting of ribosomal proteins and translation elongation factors in leukemia cells. Overall, our work elicits the direct requirement for translation efficiency in tumorigenesis and propose targeting the post-transcriptional circuitry via CNOT3 as a therapeutic vulnerability in AML.


Conflict of interest statement

The authors declare no competing interest.

Figures

Fig. 1
Fig. 1. CNOT3 is essential for leukemogenesis.
A CRISPR score rank for essentiality in MOLM13 leukemia cells of subunits of deadenylation complexes—CCR4-NOT complex and PAN2/PAN3 complex. B Immunoblots showing CNOT3 protein in CB-CD34+ cells and primary AML patient cells. C Representative flow plots showing detection of endogenous CNOT3 in healthy donors vs. primary AML patient cells (AML samples). D Quantification of median fluorescent intensity (MFI) of CNOT3 levels in healthy donors (n = 4) vs. primary AML patient cells (n = 16). Data shown as mean ± s.e.m, p value calculated by Mann–Whitney test. EI MOLM-13 expressing either a scramble (control) shRNA or CNOT3-targeting shRNAs (KD33 and KD-37). E Immunoblots showing efficient knock down of CNOT3. F Cell proliferation. G Quantitative summary of flow cytometry analysis of myeloid markers CD11b and CD14. H Representative H&E images. I Percentage of Annexin-V positive cells by flow cytometry. J, K MOLM-13 cells expressing empty vector (control) or cDNA expressing CNOT3 (CNOT3-OV). J Representative immunoblots confirming CNOT3 overexpression. K Cell proliferation. Graphs (F, G, I, K) showing data as mean ± s.e.m, n = 3 independent experiments, p values calculated by two-tailed student’s t test. L Percentage of human CD45 positive cells in peripheral blood (PB) of NSG recipient mice 4 weeks post transplantation. Control n = 5; KD-33 n = 4; KD-37 n = 4. mean ± s.e.m, p < 0.001, Mann–Whitney test. M Kaplan–Meier curves. Control n = 10; KD-33 n = 10; KD-37 n = 10. p < 0.001, Log-rank test. N Immunoblots showing knockdown of CNOT3 n = 1 sample. O In vitro culture n = 6 primary samples and P Colony formation. n = 5 primary samples. Data shown mean ±  s.e.m., p < 0.001, two-tailed Student’s t test. Q Experimental scheme to assess leukemia in vivo. RT Percentage of human leukemia CD45+ cells in recipient animals in three independent PDX models. N = 5 per group. mean ± s.e.m, p values calculated by Mann–Whitney test. U, V High expression of CNOT3 mRNA correlates with poor prognosis in AML patients. Kaplan–Meier curves showing outcomes of AML patients in U TCGA-AML high n = 117 vs. low n = 46; V Beat AML high n = 271 vs. low n = 141. p values calculated using Log-rank test. Source data are provided as Source Data files for figures (B, DG, IT).
Fig. 2
Fig. 2. CNOT3 suppress differentiation of primary HSPCs.
AF Cord blood-derived human CD34+ hematopoietic stem/progenitor cells (CB-CD34+ cells) were transduced with lentiviruses expressing either a scramble (control) shRNA or CNOT3-targeting shRNAs (KD33 and KD-37). Cells were selected for puromycin resistance and assayed 3 days post-transduction. A Representative immunoblots showing efficient depletion of CNOT3. ACTIN serves as loading control. B Cell proliferation in liquid culture supplemented with cytokines. C Colony formation. Cells were plated on methylcellulose supplemented with cytokines. D Percentage of apoptotic cells by flow cytometry analysis for Annexin-V positivity. E Quantitative summary of flow cytometry analysis of myeloid differentiation markers CD11b, CD14, and CD13. F Representative H&E images of morphological evaluation of CB-CD34+ cells upon CNOT3 depletion. All graphs (AE) show data as mean ±  s.e.m. n = 3 independent experiments, p values calculated by two-tailed student’s t test. GI CB-CD34+ cells were transduced with lentiviruses carrying either an empty vector backbone or cDNA expressing CNOT3. Reporter gene YFP is present within the lentiviral vector Cells were sorted based on YFP positivity 3 days post-transduction. G Cell proliferation in liquid culture supplemented with cytokines. H Colony formation. Cells were plated on methylcellulose supplemented with cytokines. I Quantitative summary of flow cytometry analysis of myeloid differentiation markers CD11b, CD14, and CD13. All graphs GI showing data as mean ± s.e.m, n = 3 independent experiments, p values calculated by two-tailed student’s t test. Source data are provided as Source Data files for figures (AE, GI).
Fig. 3
Fig. 3. NOT box domain is essential for CNOT3 function in AML.
A Experimental scheme of CRISPR/Cas9 tilling sgRNA mutagenesis screen for essential domains of CNOT3 in MOLM13 myeloid leukemia cells. B Top- Graphs presenting z score of individual sgRNAs and smoothed out the distribution of score for functional domains. Read counts for drop-out and/or enrichment of each sgRNA were used to calculate functional scores of gRNAs to specific protein domains using the CRISPRO pipeline. LOESS regression was used to smooth the tiling signals from individual sgRNAs (gray dots) to identify essential amino acids and domains. Bottom–Annotations of CNOT3 structural domains. C Immunoblots showing expression of full-length CNOT3 (CNOT3-FL) and NOT box-truncated proteins. ACTIN serves as loading control. D Cell proliferation of MOLM13 cells transduced with empty vector (EV) control, cDNA expressing full-length CNOT3 or NOT box-truncated CNOT3. Data shown as mean ± s.e.m., n = 3 independent experiments, p < 0.001, two-tailed Student’s t test. E, F Volcano plots showing the distribution of differentially expressed genes upon overexpression of E Full-length CNOT3 (CNOT3-FL) and (F) NOT box-truncated CNOT3 in comparison to empty vector control. GJ Gene set enrichment analysis (GSEA) of RNA-seq dataset shown in E. Source data are provided as Source Data files for figures (BD).
Fig. 4
Fig. 4. CNOT3 controls translation of c-MYC.
A Experimental scheme of omic profiling by RNA-sequencing and proteomic analysis by tandem mass tag (TMT) mass spectrometry. MOLM-13 cells were transduced with lentiviruses expressing either a scramble (control) shRNA or CNOT3-targeting shRNAs (KD33 and KD-37). Cells were selected for puromycin resistance and assayed 2 days post-transduction. n = 3 independent experiments. B, C Gene set enrichment analysis (GSEA) of B transcriptomic profiling and C proteomic analysis of CNOT3 depleted cells vs. control as described in A. D Immunoblot confirming efficient knockdown of CNOT3 and reduction of c-MYC upon CNOT3 depletion in MOLM13 cells. ACTIN serves as loading control. E Quantitative qRT-PCR assessment of mature c-MYC transcript and primary (unprocessed) c-MYC transcript in MOLM13 cells. F Quantitative qRT-PCR measure of c-MYC abundance over time after treatment of cells with actinomycin D to inhibit transcription. ACTIN serves as housing keeping gene control. G Polysome profiling of CNOT3 depleted cells vs. control. Graphs showing optical density profiles (ODA254) of RNA across polysome gradients. Mono di-some and polysome fractions are shown. H Quantitative qRT-PCR measure of c-MYC abundance in input and relative abundance in polysome vs. monosome fractions. All n = 3 independent experiments, two-tailed Student’s t test, ns not significant. All graphs show data as mean ± s.e.m, n = 3 independent experiments, p values calculated by two-tailed student’s t test. Source data are provided as Source Data files for figures (DF, H).
Fig. 5
Fig. 5. Global assessments of CNOT3 mRNA targets.
A Summary of ranked importance score of variables determining transcripts upregulated (n = 1760); downregulated (n = 1456), or unchanged (n = 15779) upon CNOT3-KD. n = 3 control vs. CNOT3-KD (KD-33 and KD-37) independent biological samples. B Violin plot showing analysis of CDS-GC3 percentage in downregulated, unchanged, and upregulated genes. One-way ANOVA test, p values denoted. The boxplots show the 0th (Q0) percentile, the 100th percentile (Q100), and black squares denote the mean. Q0 = 0.237, 0.213, and 0.255; Q100 = 0.965, 0.989, and 0.954 and the interquartile range = 0.294, 0.279, and 0.261 for downregulated, unchanged, and upregulated, respectively. C Density plot showing GC3 percentage. D, E Relative synonymous codon usage analysis of (D) top 5% most vs. least abundant genes in MOLM13 cells, E genes down- and upregulated upon CNOT3 knockdown. F Gene enrichment analysis showing enriched hallmark pathways and transcripts’ GC3 contents. Fisher’s exact test. G Heatmap showing enrichment of genetic codons presented in upregulated; downregulated, or unchanged genes. H Experimental scheme of ribosome profiling by RiboSTAMP (RPS2-STAMP) method to evaluate translation activity in MOLM13 cells in control vs. CNOT3 KD. Image created using BioRender. I Total number of APOBEC-mediated editing events scored with ≥ 0.5 confidence level along the entire transcripts and within 5′UTR and CDS. Mann–Whitney tests, p value denoted. Source data provided as Source Data Fig. 5I. J Metagenomic view of editing events across transcripts. K Volcano plot showing differential EPKM analysis CNOT3 KD vs. control. L Gene enrichment analysis of genes in J. Fisher’s exact test. M Comparison of normalized EPKM values between control (n = 3) vs. CNOT3 depleted conditions (n = 6) in 4 quartile groups (graphs showing minima = 0; for each group control vs. KD: maxima, center, bounds of box (lower-25th percentile and higher- 75th percentile) and whiskers: group 1:68863 vs. 62139, 51.9 vs. 46.7, 24.9 and 153.1 vs. 18.7 and 147.6, 345.5 vs. 341; group 2: 28.5 vs. 293, 5.7 vs. 3.3, 2.8 and 9.3 vs. 0 vs. 8.5, 19 vs. 21.4; group 3: 6.1 vs. 979, 0.59 vs. 0, 0 and 1.8 vs. 0 and 2.09, 4.5 vs. 5.24; group 4: control all value = 0 and KD: 833, 0, 0 and 2.7, 6.8). Wilcoxon rank-sum one-sided test, p values denoted.
Fig. 6
Fig. 6. CNOT3 associates with translation machinery in AML.
A Experimental scheme of immunoprecipitation and mass spectrometry analysis to uncover CNOT3 associating proteins. B STRING network analysis of proteins associating with CNOT3. C Enrichr analysis of functional protein groups preferentially associating with CNOT3 in leukemia cells. D Representative images of CNOT3-Puro-Proximity Ligation Assay (PLA) performed in control (scramble) shRNA vs. CNOT3 depleted KD-33 and KD-37 MOLM13 cells. E Quantitative summary of CNOT3-Puro-PLA in D. F Representative images of EEF1G-Puro-PLA performed in control (scramble) shRNA vs. CNOT3 depleted KD-33 and KD-37 MOLM13 cells. G Quantitative summary of EEF1G-Puro-PLA in F. Schemes in D, and F created using BioRender. Each dot represents data obtained from one cell. H Representative images of CNOT3-EEF1E-PLA performed in control (scramble) shRNA vs. CNOT3 depleted KD-33 and KD-37 MOLM13 cells. I Quantitative summary of CNOT3-EEF1E-PLA in H. J Representative images of CNOT3-EEF1D-PLA performed in control (scramble) shRNA vs. CNOT3 depleted KD-33 and KD-37 MOLM13 cells. K Quantitative summary of CNOT3-EEF1D-PLA in J. All graphs show data as mean ± s.e.m. two-tailed Student’s t test, ***p < 0.001. LP MOLM-13 cells were transduced with lentiviruses expressing either a scramble (control) shRNA or EEF1E-targeting shRNAs (KD-47 and KD-48) or EEF1D-targeting shRNAs (KD-45 and KD-46). Cells were selected for puromycin resistance and assayed 3 days post-transduction. LN Immunoblots showing efficient knockdown of EEF1E and EEF1D, respectively. ACTIN serves as loading control. MO Cell proliferation. P Percentage of apoptotic cells by flow cytometry analysis for Annexin-V positivity. n = 3 independent experiments. All graphs showing data as mean ± s.e.m, p values were calculated by two-tailed student’s t test. Source data are provided as Source Data files for figures (A, C, E, G, I, KP).
Fig. 7
Fig. 7. Model for CNOT3 function in AML.
CNOT3 facilitates optimal translation by associating with translation machinery and monitoring decoding ribosomes to efficiently drive protein synthesis of malignant gene expression programs. This is critical for the maintenance of survival and the undifferentiated state of leukemia cells. Figure created using BioRender.

Similar articles

Cited by

References

    1. Hanahan, D. Hallmarks of cancer: new dimensions. Cancer Discov.12, 31–46 (2022). - PubMed
    1. Robichaud, N., Sonenberg, N., Ruggero, D. & Schneider, R. J. Translational control in cancer. Cold Spring Harb. Perspect. Biol.11, a032896 (2019). - PMC - PubMed
    1. Lindsley, R. C. & Ebert, B. L. The biology and clinical impact of genetic lesions in myeloid malignancies. Blood122, 3741–3748 (2013). - PubMed
    1. Chen, S., Benbarche, S. & Abdel-Wahab, O. Splicing factor mutations in hematologic malignancies. Blood138, 599–612 (2021). - PMC - PubMed
    1. Jin, Z., MacPherson, K., Liu, Z. & Vu, L. P. RNA modifications in hematological malignancies. Int. J. Hematol.117, 807–820 (2023). - PubMed