. 2024 Mar 15;15(1):2342.
doi: 10.1038/s41467-024-46669-y.

Highly sensitive spatial transcriptomics using FISHnCHIPs of multiple co-expressed genes

Affiliations

Highly sensitive spatial transcriptomics using FISHnCHIPs of multiple co-expressed genes

Xinrui Zhou et al. Nat Commun. .

Abstract

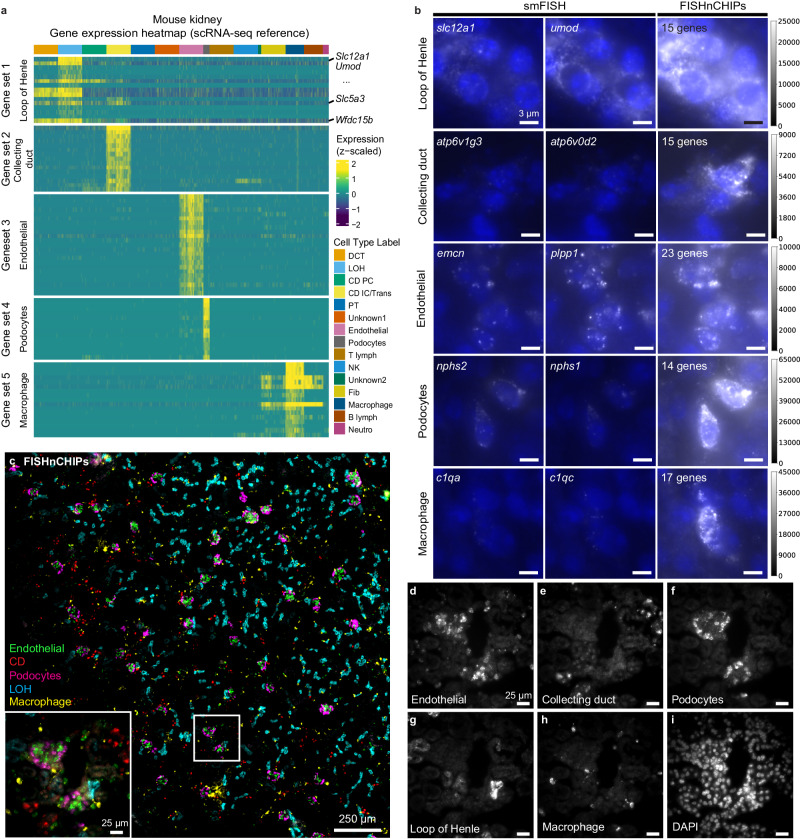
High-dimensional, spatially resolved analysis of intact tissue samples promises to transform biomedical research and diagnostics, but existing spatial omics technologies are costly and labor-intensive. We present Fluorescence In Situ Hybridization of Cellular HeterogeneIty and gene expression Programs (FISHnCHIPs) for highly sensitive in situ profiling of cell types and gene expression programs. FISHnCHIPs achieves this by simultaneously imaging ~2-35 co-expressed genes (clustered into modules) that are spatially co-localized in tissues, resulting in similar spatial information as single-gene Fluorescence In Situ Hybridization (FISH), but with ~2-20-fold higher sensitivity. Using FISHnCHIPs, we image up to 53 modules from the mouse kidney and mouse brain, and demonstrate high-speed, large field-of-view profiling of a whole tissue section. FISHnCHIPs also reveals spatially restricted localizations of cancer-associated fibroblasts in a human colorectal cancer biopsy. Overall, FISHnCHIPs enables fast, robust, and scalable cell typing of tissues with normal physiology or undergoing pathogenesis.


Conflict of interest statement

The authors declare the following competing financial interests: The FISHnCHIPs technology described in the manuscript was filed under Singapore Patent Application No. 0202260245V on 29 Nov 22. We are in the process of filing an international PCT. Agency for Science Technology and Research (A*STAR) is the patent applicant and the inventors are K.HC., X.Z., W.Y.S., N.H., J.B., N.C. and J.J.L.G. The remaining authors declare no competing interest.

Figures

Fig. 1
Fig. 1. FISHnCHIPs schematic.
a Cell-by-gene count matrix from single-cell RNA sequencing (scRNA-seq) can be used to cluster cell types, which are characterized by their unique gene expression profiles (red cells express genes A–D; green cells express genes E–I). b Genes that are co-expressed with each other are spatially co-localized in the same cells within a tissue. By designing fluorescently labeled oligonucleotide probes to target a large set of co-expressed transcripts, FISHnCHIPs can improve the sensitivity of fluorescence detection. c Combined with repeated rounds of hybridization and washing, FISHnCHIPs enables robust and scalable mapping of cell types in tissue samples.
Fig. 2
Fig. 2. Comparison of FISHnCHIPs and single-molecule RNA FISH (smFISH) in mouse kidney tissue.
a Gene expression heatmap from the scRNA-seq reference data and their corresponding cell clusters. Heatmap shows expression of the 84 FISHnCHIPs genes that are correlated to the top differentially expressed (DE) genes in the 5 selected cell types, sampling a maximum of 300 cells per cluster. Cell type labels are distal convoluted tubule (DCT), loop of Henle (LOH), collecting duct principal cell (CD PC), collecting duct intercalated cell/collecting duct transitional cell (CD IC/Trans), proximal tubule (PT), unknown1, endothelial cell, podocytes, T-lymphocytes (T lymph), natural killer cell (NK), unknown2, fibroblasts (fib), macrophage, B lymphocytes (B lymph), neutrophil (neutro). b Unprocessed smFISH images of a mouse kidney tissue slice in 5 selected cell types are shown in the left and middle panels. FISHnCHIPs labels 14–23 co-expressed genes simultaneously to detect target cell types and their images are shown in the right panels. The smFISH and FISHnCHIPs images are scaled to the same camera intensity range for each cell type. Nuclei staining with DAPI is shown in blue. Scale bar, 3 μm. c Composite FISHnCHIPs image with each cell type assigned a pseudo color: endothelial (green), collecting duct (red), podocyte (magenta), loop of Henle (blue) and macrophage (yellow). Scale bar, 250 μm. Insert: Zoomed-in region of the white box. Scale bar, 25 μm. di Zoomed-in region of the white box insert in (c). Scale bar, 25 μm.
Fig. 3
Fig. 3. FISHnCHIPs profiling of 18 gene modules in the mouse cortex.
a Gene-gene correlation heatmap (of the pairwise Pearson’s correlation (r) coefficients) grouped into 18 clusters of gene modules (colored boxes, M1-M18). Each module (14 genes on average) was imaged sequentially under an automated fluidics-coupled fluorescence microscope system. Example FISHnCHIPs images of a mouse brain tissue slice stained for gene module 1, 2, 3, and 18. Scale bar, 50 μm. b Single cells were segmented using DAPI stain and the cell masks were applied to define 6180 cells after quality control. Heatmap of the mean fluorescence intensity per cell for each imaged module. The cell-by-module intensity matrix was clustered using the Louvain algorithm, resulting in eight cell clusters. cj Spatial maps of the detected cells, colored by their cell types: Glutamatergic neurons (gray), GABAergic neurons (purple), astrocytes (blue), oligodendrocytes (red), endothelial cells (cyan), microglial cells (orange), peri-vascular cells (green), and vascular leptomeningeal cells (yellow). Scale bar, 500 μm. k Scatter plot of cell type frequency detected by MERFISH versus FISHnCHIPs fitted with a linear regression model: y=0.025+x,R2=0.96, where x,y is the cell type frequency in FISHnCHIPs and in MERFISH, respectively. The gray band surrounding the regression line represents the 95% confidence interval for the linear regression model. Insert is a pie chart showing the proportion of each FISHnCHIPs cluster. Source data are provided as a Source Data file.
Fig. 4
Fig. 4. FISHnCHIPs profiling of 20 gene expression programs in the mouse cortex.
af 6 out of 20 FISHnCHIPs images of a mouse brain tissue slice stained for programs ExcL2, ExcL5p3, ExcL6p1, ExcL6p2, IntSst, and IntPv. An average of 16 co-expressed genes were imaged concurrently. Scale bar, 500 μm. g Single cells were segmented and a total of 2794 passed quality control. Heatmap of the mean fluorescence intensity per cell for each imaged program. The cell-by-program intensity matrix was clustered using the Louvain algorithm, resulting in 11 clusters. We used the program annotations to label the cluster identities. h Uniform manifold approximation and projection (UMAP) colored by cluster. is Spatial maps of the detected cells, colored by their cell types: L2/3 excitatory neurons (blue), L3/4 excitatory neurons (purple), L4/5 excitatory neurons (orange), L5p1 excitatory neurons (gray), L5/6 excitatory neurons (red), L6p1 excitatory neurons (white), IntPv inhibitory neurons (cyan), IntSst inhibitory neurons (light green), IntNpy/CckVip inhibitory neurons (yellow), hippocampus (light blue), and subiculum (dark green). Scale bar, 400 μm. t Composite image of the detected cell clusters. Cortical depth distance (for u, v) was calculated based on the two white arcs (see materials and methods). Some programs exhibited gradual intensity variation along the cortical depth (see cell-by-program intensity heatmap ordered by increasing cortical depth in Supplementary Fig. 7). Kernel Density Estimate (KDE) of cell density for excitatory neurons (u) and inhibitory neurons (v) along the cortical depth. Source data are provided as a Source Data file.
Fig. 5
Fig. 5. Large FOV FISHnCHIPs profiling of 53 gene modules in the mouse brain.
a The cell-by-module intensity matrix of the FISHnCHIPs data for 54,834 cells was clustered to reveal 18 major cell types. Sub-clustering revealed finer subtypes that were also spatially distinct (see Supplementary Fig. 12). b Uniform manifold approximation and projection (UMAP) representation for all cells, colored by their cell types. c Composite image of the detected cells, colored by their cell types. Scale bar, 1000 μm. du Spatial map of the 18 clusters: neurons 1, 2, 3, 4, 5, 6, 7, and 8, astrocytes, blood vessel associated cells, endothelial cells, ependymal cells, immature oligodendrocytes, mature oligodendrocytes 1 and 2, microglial, pericytes, and unknown. Scale bar, 1000 μm. Color scheme is the same for (au). Source data are provided as a Source Data file.
Fig. 6
Fig. 6. FISHnCHIPs imaging of cancer associated fibroblasts (CAFs) subtypes in human colorectal cancer (CRC) tissue.
ad FISHnCHIPs images of cancer associated fibroblasts 1 (CAF-1), cancer associated fibroblasts 2 (CAF-2), colon epithelium, immune cells (HLA genes). Scale bar 200 um. e Composite image with pseudo colors: colon epithelium (white), CAF-1 (cyan), CAF-2 (purple) and immune cells (yellow). Scale bar, 200 μm. f Zoomed-in region of the white box insert in (e). Scale bar, 25 μm. g Centroids of the segmented cell masks for CAF-1 (cyan), CAF-2 (purple), immune cells (yellow). Scale bar, 200 μm. h Box plots of the number of immune cells within 100 μm radius of CAF-1 (cyan) and CAF-2 (purple) cells. Immune cells were found 0.74-fold less frequently in the vicinity of CAF-2 than CAF-1. Number of cells, n: CAF-1: 2946, CAF-2: 2671, examined over 1 experiment. A technical replicate is provided as Supplementary Fig. 16. The box plots show the median (center line), the first and third quartiles (box limits), and 1.5 × the interquartile range (whiskers). p = 1.4 × 10−72, 2-sided Mann-Whitney U test. Source data are provided as a Source Data file.

Similar articles

Cited by

References

    1. Rao A, Barkley D, França GS, Yanai I. Exploring tissue architecture using spatial transcriptomics. Nature. 2021;596:211–220. doi: 10.1038/s41586-021-03634-9. - DOI - PMC - PubMed
    1. Lewis SM, et al. Spatial omics and multiplexed imaging to explore cancer biology. Nat. Methods. 2021;18:997–1012. doi: 10.1038/s41592-021-01203-6. - DOI - PubMed
    1. Moffitt JR, Lundberg E, Heyn H. The emerging landscape of spatial profiling technologies. Nat. Rev. Genet. 2022;23:741–759. doi: 10.1038/s41576-022-00515-3. - DOI - PubMed
    1. Ståhl PL, et al. Visualization and analysis of gene expression in tissue sections by spatial transcriptomics. Science. 2016;353:78–82. doi: 10.1126/science.aaf2403. - DOI - PubMed
    1. Stickels RR, et al. Highly sensitive spatial transcriptomics at near-cellular resolution with Slide-seqV2. Nat. Biotechnol. 2021;39:313–319. doi: 10.1038/s41587-020-0739-1. - DOI - PMC - PubMed