. 2024 Mar 15;15(1):2360.
doi: 10.1038/s41467-024-46673-2.

Clearance of persistent SARS-CoV-2 associates with increased neutralizing antibodies in advanced HIV disease post-ART initiation

Affiliations

Clearance of persistent SARS-CoV-2 associates with increased neutralizing antibodies in advanced HIV disease post-ART initiation

Farina Karim et al. Nat Commun. .

Abstract

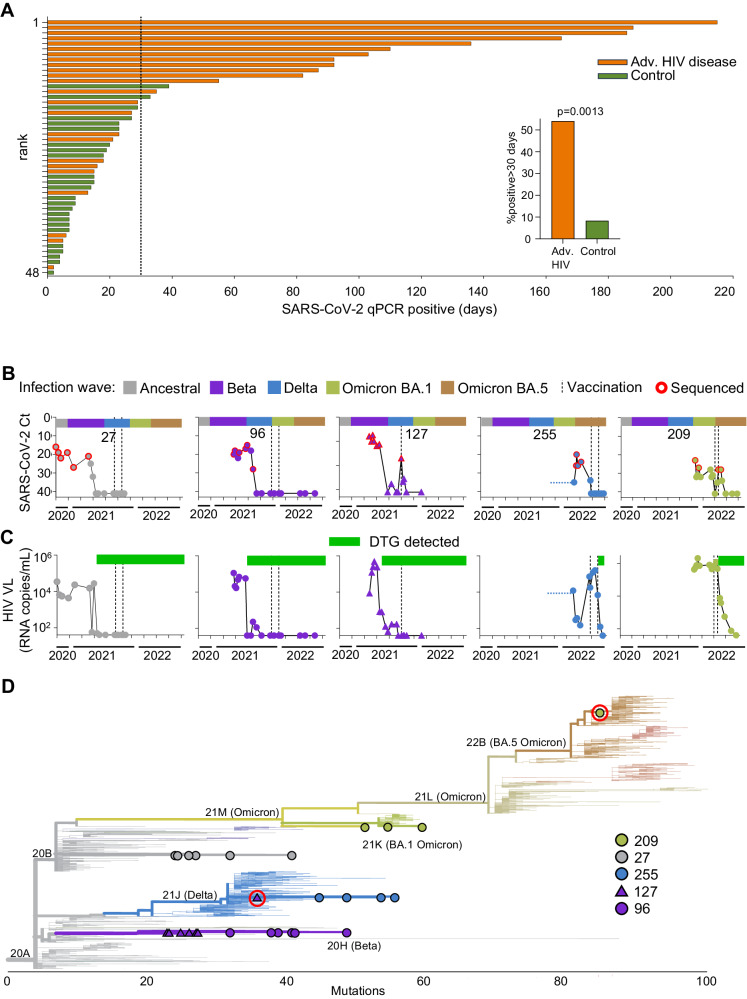
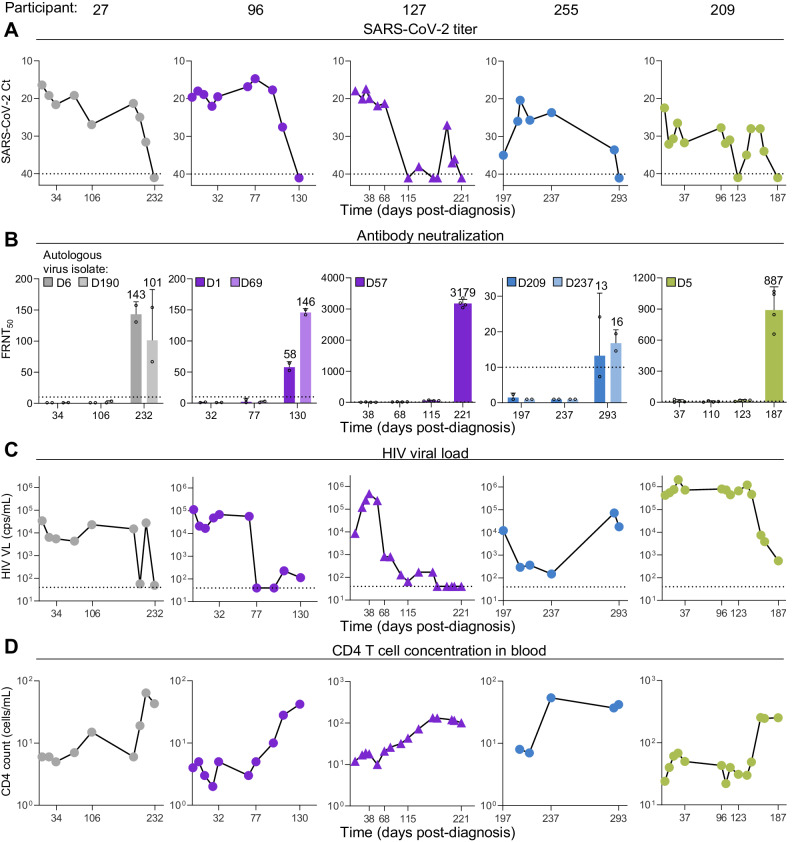
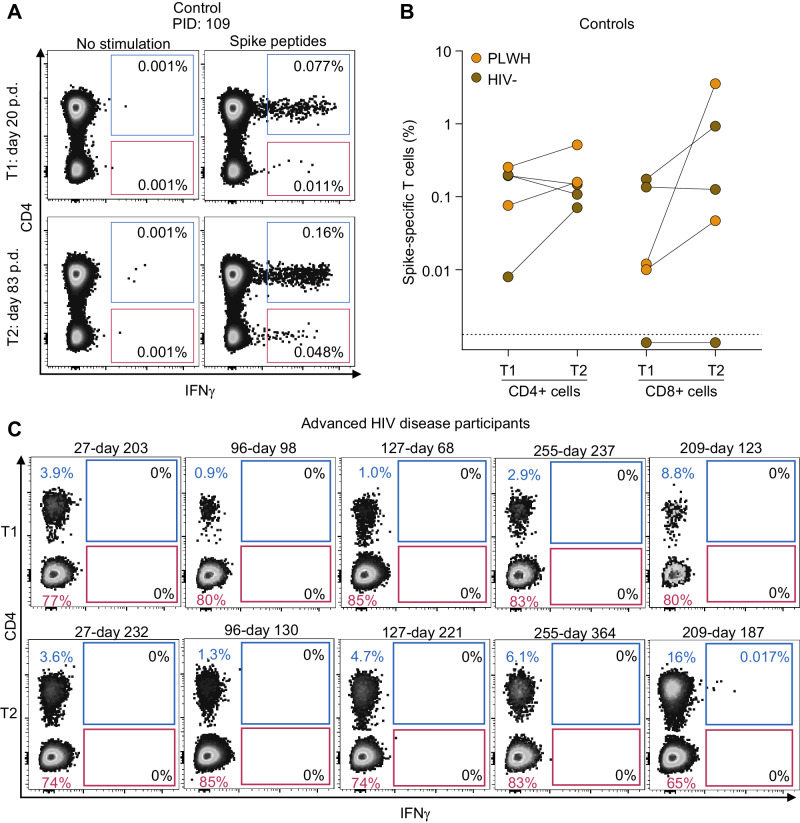
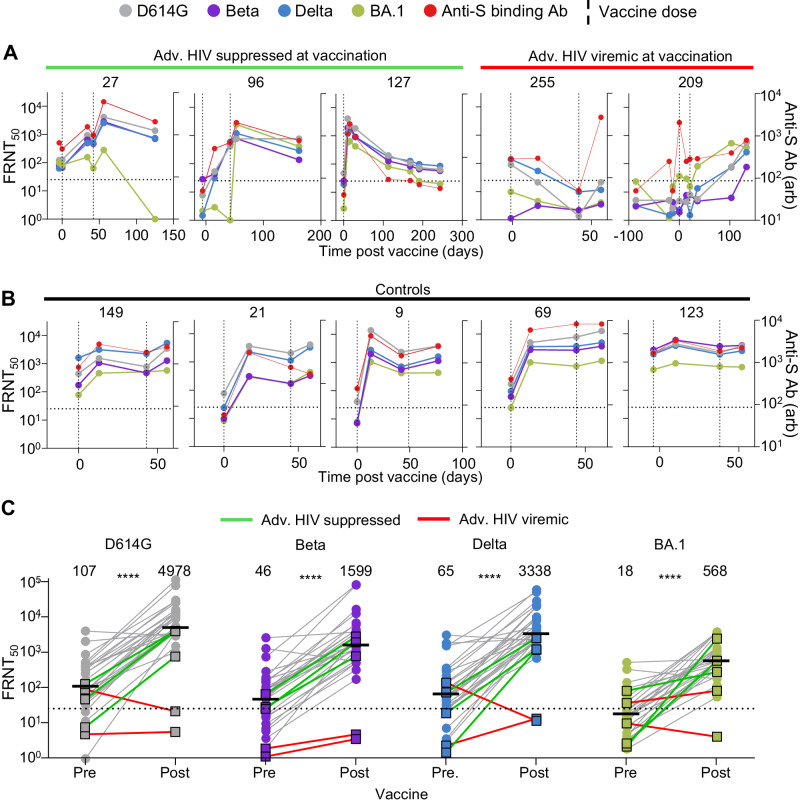
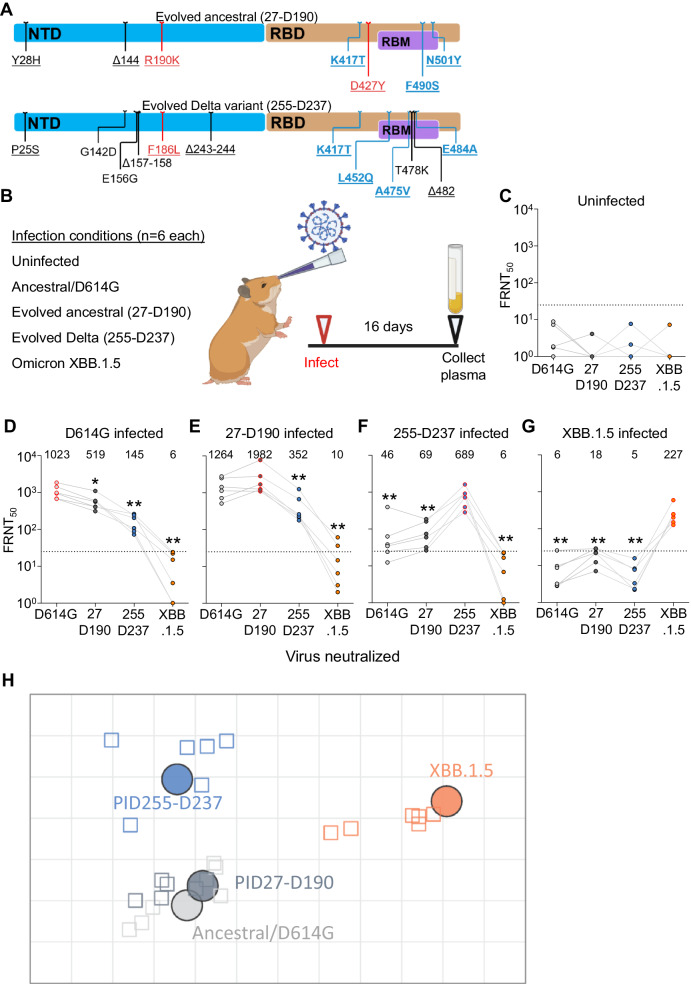
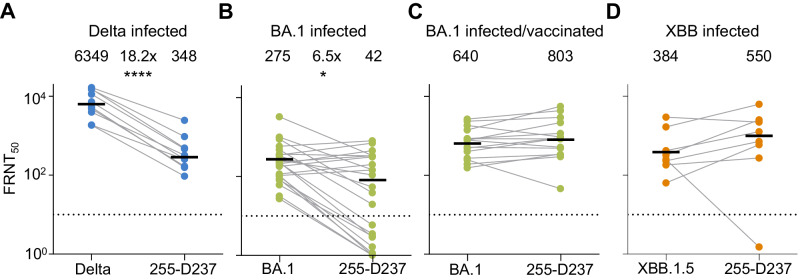
SARS-CoV-2 clearance requires adaptive immunity but the contribution of neutralizing antibodies and T cells in different immune states is unclear. Here we ask which adaptive immune responses associate with clearance of long-term SARS-CoV-2 infection in HIV-mediated immunosuppression after suppressive antiretroviral therapy (ART) initiation. We assembled a cohort of SARS-CoV-2 infected people in South Africa (n = 994) including participants with advanced HIV disease characterized by immunosuppression due to T cell depletion. Fifty-four percent of participants with advanced HIV disease had prolonged SARS-CoV-2 infection (>1 month). In the five vaccinated participants with advanced HIV disease tested, SARS-CoV-2 clearance associates with emergence of neutralizing antibodies but not SARS-CoV-2 specific CD8 T cells, while CD4 T cell responses were not determined due to low cell numbers. Further, complete HIV suppression is not required for clearance, although it is necessary for an effective vaccine response. Persistent SARS-CoV-2 infection led to SARS-CoV-2 evolution, including virus with extensive neutralization escape in a Delta variant infected participant. The results provide evidence that neutralizing antibodies are required for SARS-CoV-2 clearance in HIV-mediated immunosuppression recovery, and that suppressive ART is necessary to curtail evolution of co-infecting pathogens to reduce individual health consequences as well as public health risk linked with generation of escape mutants.


Conflict of interest statement

The authors declare no competing interests.

Figures

Fig. 1
Fig. 1. Persistent SARS-CoV-2 infection and mutations in advanced HIV disease.
A SARS-CoV-2 duration in 24 advanced HIV disease and 24 non-immunosuppressed participants (controls) matched for age and sex. Infection periods analyzed had at least two consecutive SARS-CoV-2 positive qPCR results, one detecting the full set of assay targets. Possible re-infection periods (positive results separated by two or more negatives) were excluded. x axis is time in days with vertical dashed line denoting 30 days, y axis is rank according to infection duration from longest to shortest. Inset: frequency of SARS-CoV-2 infections lasting for 30 days or more: 11 of 24 (54%) in advanced HIV disease and 2 of 24 (8%) in control participants. P = 0.0013 by two-sided Fisher’s Exact Test. B SARS-CoV-2 infection through time in five participants with advanced HIV disease and vaccination. x axis represents complete infection period, including possible reinfections, and bar above each graph represents the timing of the infection waves for each variant/strain in South Africa. Timeline is continuous and same for all participants shown with ticks on x axis indicating 2 months intervals; the total period covered is the last two months of 2020, all of 2021, and first 8 months of 2022. y axis represents the qPCR cycle threshold (Ct) value, inversely proportional to the SARS-CoV-2 viral titer. Red circles represent successfully sequenced timepoints and vertical dashed lines represent Pfizer BNT162b2 mRNA vaccination times. C HIV viral loads for the participants measured in the blood as RNA copies/mL. Green bars above graphs denote periods of adherence to dolutegravir (DTG) based ART. D Phylogenetic tree of sequenced virus samples through time for each participant (27: gray circles, 96: purple circles, 127: purple triangles, 127: blue circles, 209: green circles). x axis represents mutation distance from ancestral clade 20A. Potential reinfections in participants 127 and 209 are highlighted with red circles. Tree generated using Nextclade (https://clades.nextstrain.org/).
Fig. 2
Fig. 2. SARS-CoV-2 clearance in advanced HIV disease immunosuppression associates with neutralizing antibody response.
A SARS-CoV-2 titers measured as qPCR Ct through time until SARS-CoV-2 clearance for participants 27, 96, 127, 255, and 209. x axis is time in days post-SARS-CoV-2 diagnosis. y axis is SARS-CoV-2 titer as Ct value. B Neutralization of autologous virus by participant plasma sampled at different timepoints. One to two viruses were isolated and tested per participant. Viruses are indicated top left on each graph by day of isolation (denoted by D prefix) post-diagnosis. Four independent experiments were performed per participant. The numbers above bars are geometric mean FRNT50, and error bars are geometric mean standard deviations of FRNT50 determined from two (two participant viral isolates tested) or four (one isolate tested) independent experiments, with individual experiments shown as points. C HIV viral load during SARS-CoV-2 infection period. D CD4 T-cell concentrations during SARS-CoV-2 infection period. Horizontal dashed lines represent limits of quantification in all panels.
Fig. 3
Fig. 3. SARS-CoV-2-specific T-cell responses in controls and advanced HIV disease.
A Flow cytometry results showing detection of SARS-CoV-2-specific responses in CD4 and CD8 T cells. T cells were stimulated with spike peptide pools matching the infecting variant and CD4 and CD8 T-cell responses detected by the presence of intracellular interferon-gamma (IFN-γ). The left plot shows unstimulated sample and right plot is 16 h post-peptide stimulation for control participant 109 (PID 109). p.d, days post-diagnosis. B CD4 and CD8 T-cell frequencies at two timepoints (T1, post infection; T2, post-vaccination) for each control participant (HIV-uninfected: brown points; controlled HIV: orange points). C Flow cytometry results showing CD4 (blue) and CD8 T-cell (red) frequencies in advanced HIV disease participants at two timepoints (T1, pre-SARS-CoV-2 clearance; T2, post-SARS-CoV-2 clearance). There was sufficient PBMC sample for one test per timepoint.
Fig. 4
Fig. 4. Vaccine responses in advanced HIV disease participants.
A Longitudinal neutralization and anti-spike antibody levels before and after vaccination with the Pfizer BNT162b2 mRNA vaccine in the three advanced HIV disease participants who suppressed HIV at vaccination (27, 96, 127) and the two who did not (255, 209). Neutralization tested against ancestral/D614G SARS-CoV-2 (gray), Beta variant (purple), Delta variant (blue), and Omicron BA.1 subvariant (green). Timing of vaccine doses is represented by vertical dashed lines. x axis is time in days post-first vaccine dose and negative numbers represent pre-vaccine period. The left y axis is neutralization as FRNT50 and right y axis is anti-spike antibody level as arbitrary units (arb). B Longitudinal neutralization and anti-spike antibody levels before and after vaccination in five participants with no advanced HIV disease. C Neutralization of SARS-CoV-2 D614G, Beta, Delta and Omicron BA.1 viral isolates pre-vaccination and after last administered dose by plasma from n = 31 participants comprising the two participants with advanced HIV disease and HIV viremia (red lines), the three participants with advanced HIV disease and HIV suppression (green lines) and 26 participants with no advanced HIV disease (gray lines). y axis is neutralization as FRNT50. The numbers above groups are geometric means and statistical comparison is between participant FRNT50 values before and after vaccination. All P values were ****P < 0.0001 by a two-sided Mann–Whitney test, with exact values being P = 1 × 10−10 (D614G), 2 × 10−9 (Beta), 2 × 10−10 (Delta), and 9 × 10−12 (Omicron BA.1). All FRNT50 values are geometric means from two or three independent experiments.
Fig. 5
Fig. 5. Antigenic distances of SARS-CoV-2 evolved from ancestral and Delta infections in the hamster model.
A Substitutions and deletions in the N-terminal domain (NTD) and receptor binding domain (RBD) of SARS-CoV-2 spike in 27-D190 and 255-D237. Blue mutations: known antibody escape. Red mutations: mutations with global prevalence below 0.01%. RBM: receptor binding motif. Representation and characterization based on the Stanford Coronavirus Antiviral and Resistance Database (https://covdb.stanford.edu). B Schematic of hamster infection experiment. Six animals in two independent experiments were used per infection condition with FRNT50 values determined once for each animal. Parts of (B) created with BioRender.com. C Neutralization of ancestral D614G, 27-D190, 255-D237, and Omicron XBB.1.5 subvariant viruses in uninfected hamsters. DG Neutralization of the same viruses at 16 days post infection in hamsters infected with ancestral/D614G (D), 27-D190 (E), 255-D237 (F), and the XBB.1.5 subvariant (G). Numbers above the points and horizontal bars are geometric means for the group. Significance was determined by a two-sided Mann–Whitney test relative to the autologous (infecting) virus. Significant P values from left to right were: 0.03, 0.002, 0.002. 0.009, 0.002. 0.009, 0.002, 0.002, 0.002, 0.002, 0.002. H Antigenic map of neutralization data presented in (DG). Virus strains/variants are shown as colored circles and hamster plasma samples as open squares with the color corresponding to the infecting virus. Each square on the grid corresponds to a twofold decrease in neutralization. Map created using Racmacs (https://acorg.github.io/Racmacs/).
Fig. 6
Fig. 6. Neutralization of Delta evolved virus by participants with Delta and Omicron infection elicited immunity.
A Neutralization of 255-D237 virus compared to Delta variant virus by plasma samples from ten participants infected during the Delta infection wave in South Africa. ****P = 4 × 10−5 by a two-sided Mann–Whitney test. B Neutralization of the 255-D237 compared to Omicron BA.1 subvariant virus in plasma samples from 24 participants infected with Omicron BA.1. FRNT50 for one participant was out of the range of the graph but included in the calculation of the geometric mean. *P = 0.03 by a two-sided Mann–Whitney test. C Neutralization of 255-D237 compared to Omicron BA.1 virus in plasma samples from 15 vaccinated participants with Omicron BA.1 breakthrough infection. D Neutralization of the 255-D237 compared to the Omicron XBB.1.5 subvariant virus in plasma from eight participants infected during XBB derivative infection period in South Africa. All samples collected approximately 2–3 weeks post-diagnosis. The numbers above the points and horizontal bars are geometric means for the group with FRNT50 values determined once for each participant/virus combination.

References

    1. Thorne LG, et al. Evolution of enhanced innate immune evasion by SARS-CoV-2. Nature. 2022;602:487–495. doi: 10.1038/s41586-021-04352-y. - DOI - PMC - PubMed
    1. Diamond MS, Kanneganti TD. Innate immunity: the first line of defense against SARS-CoV-2. Nat. Immunol. 2022;23:165–176. doi: 10.1038/s41590-021-01091-0. - DOI - PMC - PubMed
    1. Sette A, Crotty S. Adaptive immunity to SARS-CoV-2 and COVID-19. Cell. 2021;184:861–880. doi: 10.1016/j.cell.2021.01.007. - DOI - PMC - PubMed
    1. Cele S, et al. SARS-CoV-2 prolonged infection during advanced HIV disease evolves extensive immune escape. Cell Host Microbe. 2022;30:154–162.e155. doi: 10.1016/j.chom.2022.01.005. - DOI - PMC - PubMed
    1. Karim, F. et al. Persistent SARS-CoV-2 infection and intra-host evolution in association with advanced HIV infection. Preprint at https://www.medrxiv.org/content/10.1101/2021.06.03.21258228v1 (2021). - DOI

Supplementary concepts