. 2024 Mar 15;7(1):334.
doi: 10.1038/s42003-024-06026-7.

Identification of membrane curvature sensing motifs essential for VPS37A phagophore recruitment and autophagosome closure

Affiliations

Identification of membrane curvature sensing motifs essential for VPS37A phagophore recruitment and autophagosome closure

Yansheng Ye et al. Commun Biol. .

Abstract

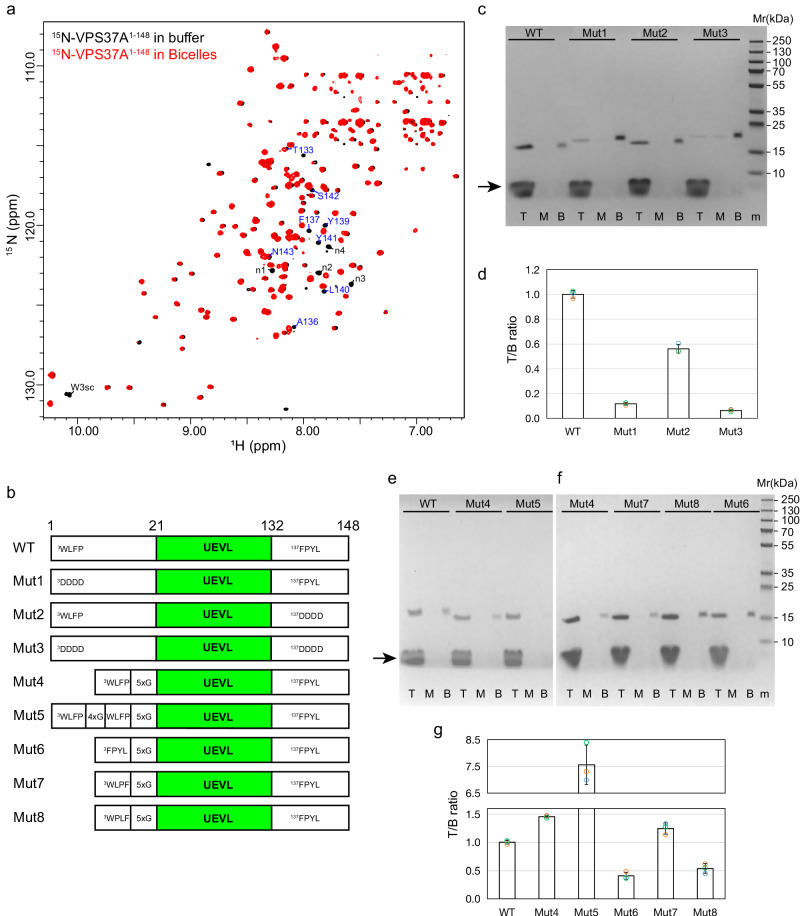
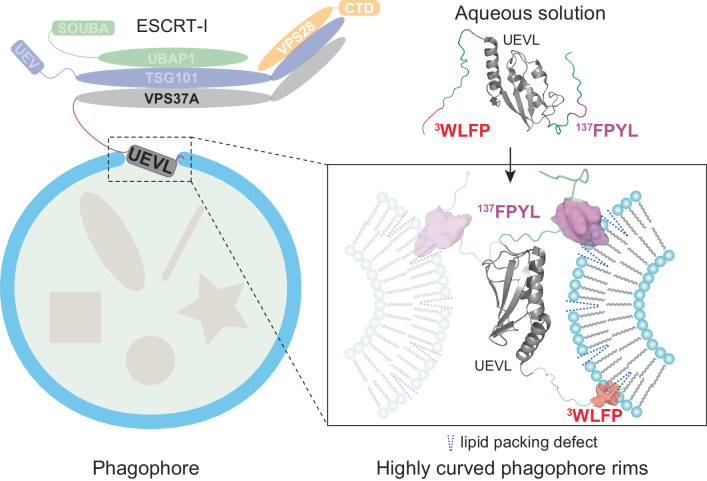
VPS37A, an ESCRT-I complex component, is required for recruiting a subset of ESCRT proteins to the phagophore for autophagosome closure. However, the mechanism by which VPS37A is targeted to the phagophore remains obscure. Here, we demonstrate that the VPS37A N-terminal domain exhibits selective interactions with highly curved membranes, mediated by two membrane-interacting motifs within the disordered regions surrounding its Ubiquitin E2 variant-like (UEVL) domain. Site-directed mutations of residues in these motifs disrupt ESCRT-I localization to the phagophore and result in defective phagophore closure and compromised autophagic flux in vivo, highlighting their essential role during autophagy. In conjunction with the UEVL domain, we postulate that these motifs guide a functional assembly of the ESCRT machinery at the highly curved tip of the phagophore for autophagosome closure. These results advance the notion that the distinctive membrane architecture of the cup-shaped phagophore spatially regulates autophagosome biogenesis.


Conflict of interest statement

The authors declare no competing interests.

Figures

Fig. 1
Fig. 1. VPS37A1–148 selectively interacts with highly curved membranes.
a Gel images of liposome flotation assays for VPS37A1–148 mixed with sonicated or extruded liposomes with membrane pore sizes of 50, 100, or 200 nm (POPC:DOPG:DOPE = 3:2:5, protein:lipid = 1:400, molar ratio). T, M, and B represent the top, middle, and bottom layers after centrifugation. The protein marker is indicated by m. The arrow indicates the lipid band. The amount of VPS37A1–148 in the top layer relative to that in the bottom layer (T/B) is quantitated by ImageJ and plotted in b. b Plots of VPS37A1–148 in top layer versus bottom layer (T/B) for extruded liposomes (POPC:DOPG:DOPE = 3:2:5) with membrane pore sizes of 50, 100, or 200 nm, and sonicated liposomes containing 0, 10, 30, or 50% PE (molar ratio, referred to as S-0%, S-10%, S-30%, and S-50%, respectively). Data are presented as mean ± SD (standard deviation). Quantifications were obtained from three separate measurements (n = 3). c Gel images of liposome flotation assays for VPS37A1–148 mixed with sonicated liposomes consisting of 20% DOPG and 0, 10, 30, or 50% of PE (molar ratio). Their plots are shown in b. The protein marker is indicated by m. The arrow indicates the lipid band. d Gel images of liposome flotation assays for VPS37A1–148 mixed with sonicated liposomes containing 0 or 55% of DOPE (molar ratio) without negatively charged lipids, and with sonicated liposomes (POPC:DOPS:DOPE = 3:2:5, protein:lipid = 1:400, molar ratio). Samples with VPS37A1–148 proteins alone (-liposomes) or liposomes alone (-protein) were performed as controls. The protein marker is indicated by m. The arrow indicates the lipid band.
Fig. 2
Fig. 2. Two conserved hydrophobic motifs in VPS37A1–148 interact with the membrane.
a Overlay of 15N-labeled VPS37A1–148 TROSY spectra in the absence (black) and presence (red) of bicelles (DMPC:DMPG:DHPC = 4:1:10, molar ratio, q = 0.5). Several perturbed resonances are labeled with their assignments. Unassigned resonances are labeled with n1 to n4. b Diagrams of VPS37A1–148 constructs for in vitro study. c Gel images of liposome flotation assays for VPS37A1–148 wildtype (WT), Mut1, Mut2, and Mut3 mixed with sonicated liposomes (POPC:DOPG:DOPE = 3:2:5, protein:lipid = 1:400, molar ratio). T, M, and B represent the top, middle, and bottom layers after centrifugation. The protein marker is indicated by m. The arrow indicates the lipid band. d Plots of VPS37A1–148 WT, Mut1, Mut2, and Mut3 in the top layer relative to the bottom layer in flotation experiments (c) using sonicated liposomes (POPC:DOPG:DOPE = 3:2:5). The T/B ratios of mutants are normalized to the ratio of VPS37A1–148 WT using the same batch of sonicated liposomes. The amount of protein in the top layer relative to the bottom layer (T/B) is quantitated by ImageJ. Data are presented as mean ± SD from three independent experiments (n = 3 for each construct). e Gel images of liposome flotation assays for VPS37A1–148 WT, Mut4, and Mut5 mixed with sonicated liposomes (POPC:DOPG:DOPE = 3:2:5, protein:lipid = 1:400, molar ratio). T, M, and B represent the top, middle, and bottom layers after centrifugation. The arrow indicates the lipid band. f Gel images of liposome flotation assays for Mut4, Mut5, Mut6, Mut7, and Mut8 mixed with sonicated liposomes (POPC:DOPG:DOPE = 3:2:5, protein:lipid = 1:400, molar ratio). T, M, and B represent the top, middle, and bottom layers after centrifugation. Protein marker is indicated by m. g Plots of VPS37A1–148 WT, Mut4, Mut5, Mut6, Mut7, and Mut8 in the top relative to the bottom layer (T/B) in flotation experiments (e, f) using sonicated liposomes (POPC:DOPG:DOPE = 3:2:5). The T/B ratios of mutants are normalized to the ratio of VPS37A1–148 WT using the same batch of sonicated liposomes. The amount of protein in the top layer relative to the bottom layer (T/B) is quantitated by ImageJ. Data are presented as mean ± SD from three independent experiments (n = 3 for each construct).
Fig. 3
Fig. 3. Mutations in the VPS37A N-terminal hydrophobic membrane-binding motifs impair phagophore targeting of the ESCRT-I complex for autophagosome closure.
ah VPS37A KO U-2 OS cells were stably transduced with GFP-tagged VPS37A wildtype (GFP-WT) or a mutant with both 3WLFP and 137FPYL motifs mutated to DDDD (GFP-HMsDM). In b, d the resultant cells were further transduced with pHuji-LC3 and HaloTag (HT)-LC3, respectively. a Immunoblot analysis of whole-cell lysates (input) and immunoprecipitates (GFP-Trap) from the indicated cells. b Confocal images of cells that were transfected with the indicated siRNAs for 45 h and starved for 3 h. Magnified images in the boxed areas are shown in the right panels. GFP-HMsDM signals detected on LC3-positive structures are indicated by dotted circles. Scale bars represent 10 μm, and 1 μm in the magnified images. c Quantification of GFP-VPS37A-positive foci area per cell in b (n ≥ 50) with two-way ANOVA followed by Tukey’s multiple comparisons. d Confocal images of cells that were starved for 3 h in the presence or absence of Bafilomycin A1 (BafA1) and subjected to the HT-LC3 autophagosome completion assay using the indicated membrane-impermeable (MIL) and -permeable (MPL) HaloTag ligands. Scale bars represent 10 μm. e Quantification of the MIL/MPL fluorescence intensity ratio for each cell in the starvation plus BafA1 treatment group (n = 50) with one-way ANOVA followed by Tukey’s multiple comparisons. The data shown are relative to the mean of GFP-WT-expressing cells. f Immunoblot analysis of cells that were starved for 3 h in the presence or absence of BafA1. p62 is a cargo degraded by autophagy, and LC3-II (a covalent conjugation form of LC3 to the amino headgroup of phosphatidylethanolamine lipid) is an autophagic marker. g, h Dot plots of LC3-II and p62 band intensities relative to the mean of untreated GFP-WT-expressing cells (g) and LC3-II and p62 degradation ratios relative to GFP-WT-expressing cells (h) in f (= 3). Data in g and h are analyzed with two-way and one-way ANOVA followed by Tukey’s multiple comparisons, respectively. All values in the graphs are mean ± SD. ns, not significant.
Fig. 4
Fig. 4. The VPS37A UEVL domain is indispensable for autophagosome closure.
ci VPS37A KO U-2 OS cells were stably transduced with the indicated GFP-tagged VPS37A constructs. a Overlay of ten lowest-energy NMR structures of VPS37A21–148. The unstructured region of residues 133 to 148 is not shown. N and C indicate N- and C- terminals, respectively. b Diagram of VPS37A and mutants for in vivo study. c Immunoblot analysis of whole-cell lysates (input) and immunoprecipitates (GFP-Trap) from the indicated cells. d Confocal images of cells that were transfected with the indicated siRNAs for 45 h and starved for 3 h. Magnified images in the arrowhead-indicated areas are shown in the bottom panels. Scale bars represent 10 μm, and 1 μm in the magnified images. e Quantification of GFP-VPS37A-positive and CHMP4B-positive foci area per cell in d (n ≥ 60) with one-way ANOVA followed by Tukey’s multiple comparisons. f Confocal images of cells that were transduced with HT-LC3, starved for 3 h in the presence or absence of BafA1, and subjected to the HT-LC3 autophagosome completion assay using the indicated HaloTag ligands. Scale bars represent 10 μm. g Quantification of the MIL/MPL fluorescence intensity ratio for each cell in the starvation plus BafA1 treatment group (n = 50) with the Kruskal–Wallis test followed by Dunn’s multiple comparisons. The data shown are relative to the mean of GFP-WT-expressing cells. h Immunoblot analysis of cells that were starved for 3 h in the presence or absence of BafA1. i Dot plots of LC3-II and p62 degradation ratios relative to GFP-WT-expressing cells in h (n = 3) with one-way ANOVA followed by Tukey’s multiple comparisons. All values in the graphs are mean ± SD. ns, not significant.
Fig. 5
Fig. 5. A model for the recruitment of VPS37A to the phagophore.
Interactions of highly curved membrane edges of the phagophore with two hydrophobic motifs of the VPS37A N-terminal domain recruit (or contribute to the recruitment of) the ESCRT-I complex to the phagophore.

Similar articles

Cited by

References

    1. Melia TJ, Lystad AH, Simonsen A. Autophagosome biogenesis: from membrane growth to closure. J. Cell Biol. 2020;219:e202002085. doi: 10.1083/jcb.202002085. - DOI - PMC - PubMed
    1. Nakatogawa H. Mechanisms governing autophagosome biogenesis. Nat. Rev. Mol. Cell Biol. 2020;21:439–458. doi: 10.1038/s41580-020-0241-0. - DOI - PubMed
    1. Chang C, Jensen LE, Hurley JH. Autophagosome biogenesis comes out of the black box. Nat. Cell Biol. 2021;23:450–456. doi: 10.1038/s41556-021-00669-y. - DOI - PMC - PubMed
    1. Shibutani ST, Yoshimori T. A current perspective of autophagosome biogenesis. Cell Res. 2014;24:58–68. doi: 10.1038/cr.2013.159. - DOI - PMC - PubMed
    1. Takahashi Y, et al. An autophagy assay reveals the ESCRT-III component CHMP2A as a regulator of phagophore closure. Nat. Commun. 2018;9:2855. doi: 10.1038/s41467-018-05254-w. - DOI - PMC - PubMed

Publication types

MeSH terms

Substances