. 2024 Jul;45(7):1451-1465.
doi: 10.1038/s41401-024-01250-7. Epub 2024 Mar 15.

Notoginsenoside R1 promotes Lgr5+ stem cell and epithelium renovation in colitis mice via activating Wnt/β-Catenin signaling

Affiliations

Notoginsenoside R1 promotes Lgr5+ stem cell and epithelium renovation in colitis mice via activating Wnt/β-Catenin signaling

Zhi-Lun Yu et al. Acta Pharmacol Sin. 2024 Jul.

Abstract

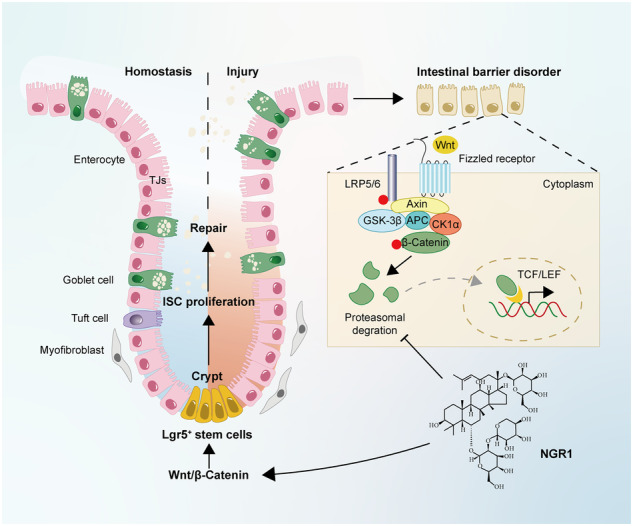
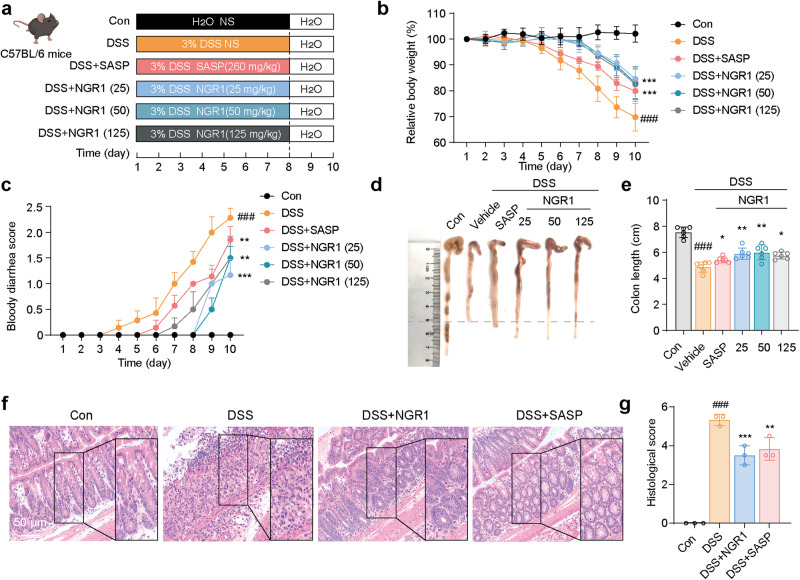
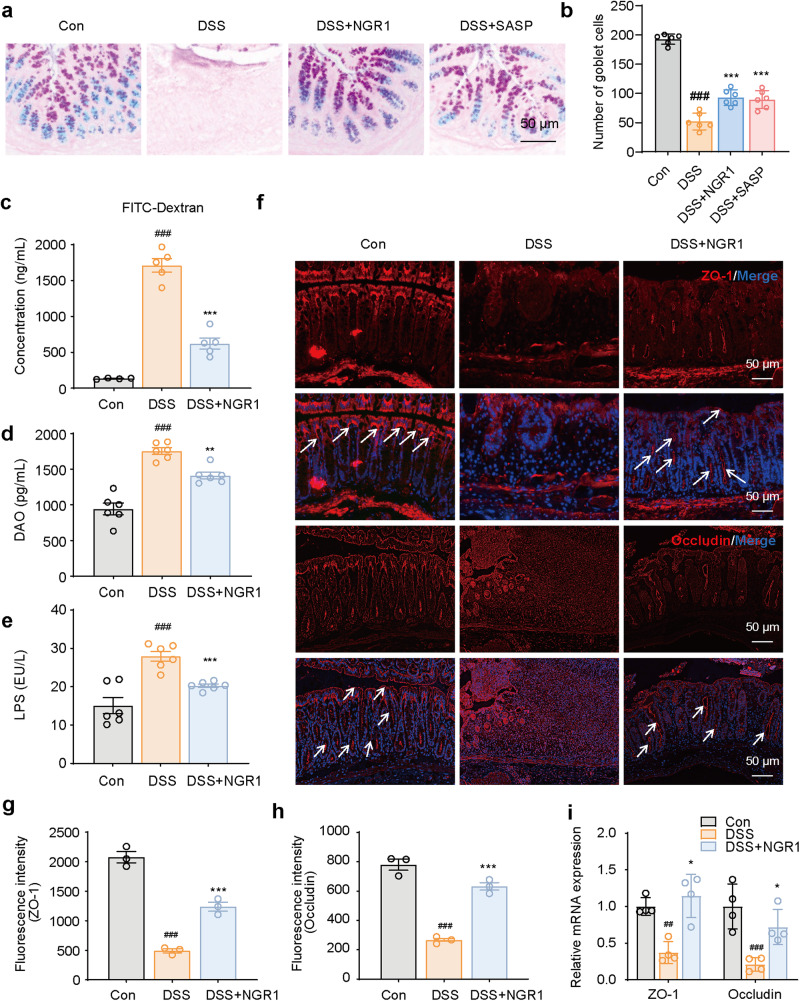
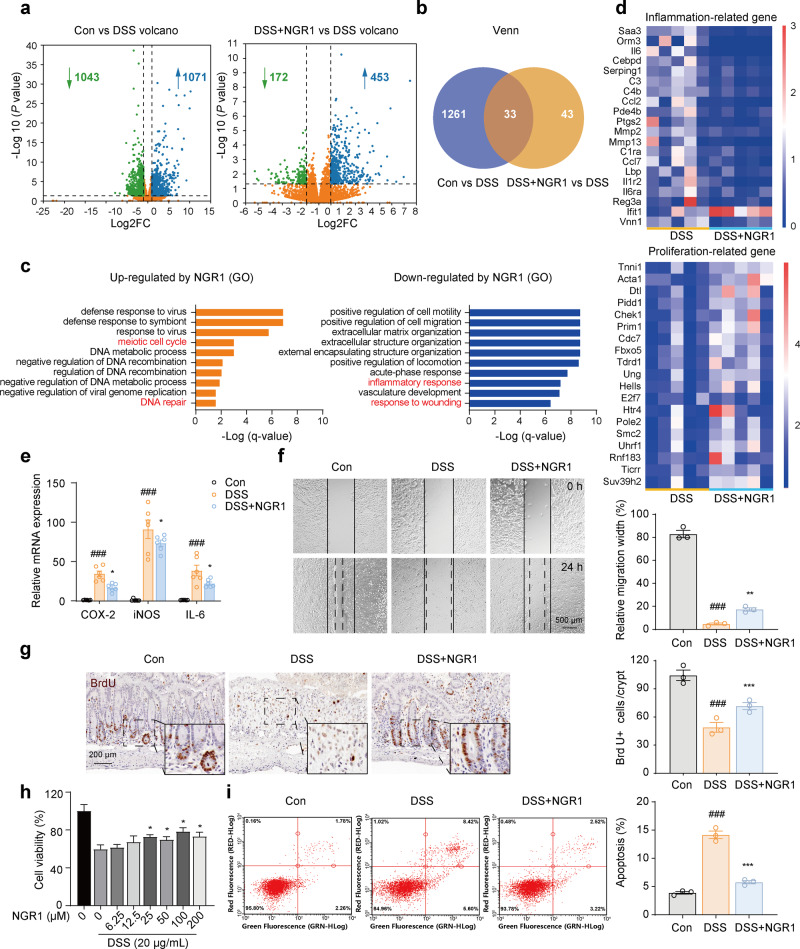
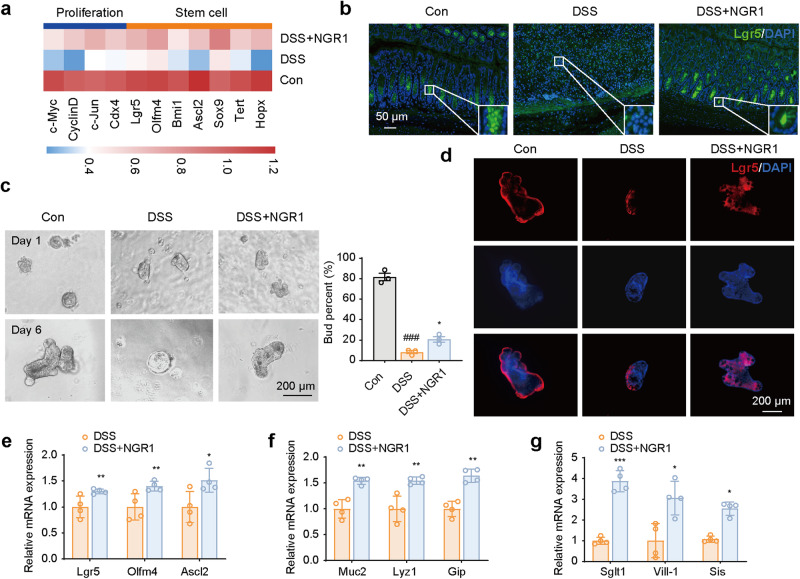
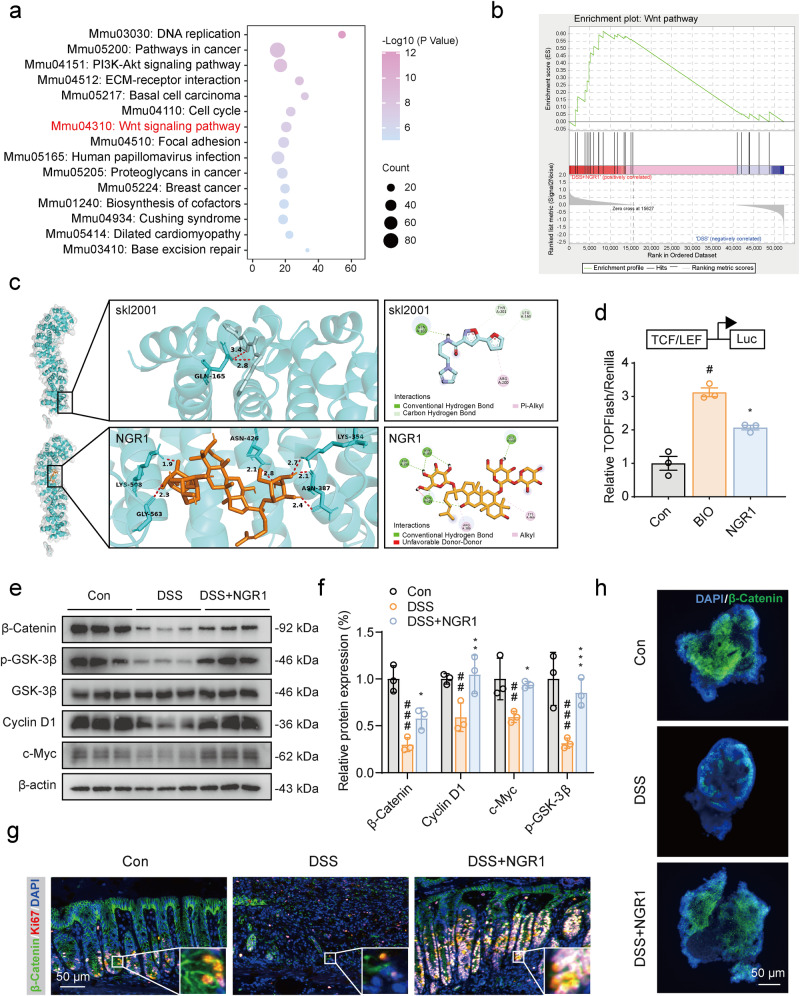
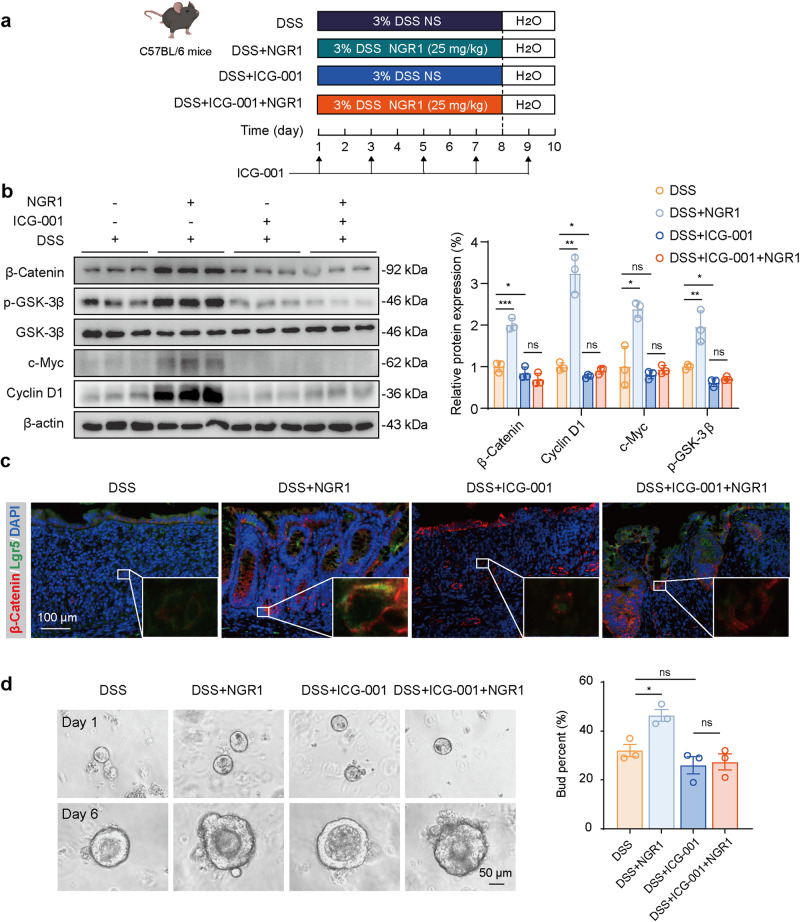
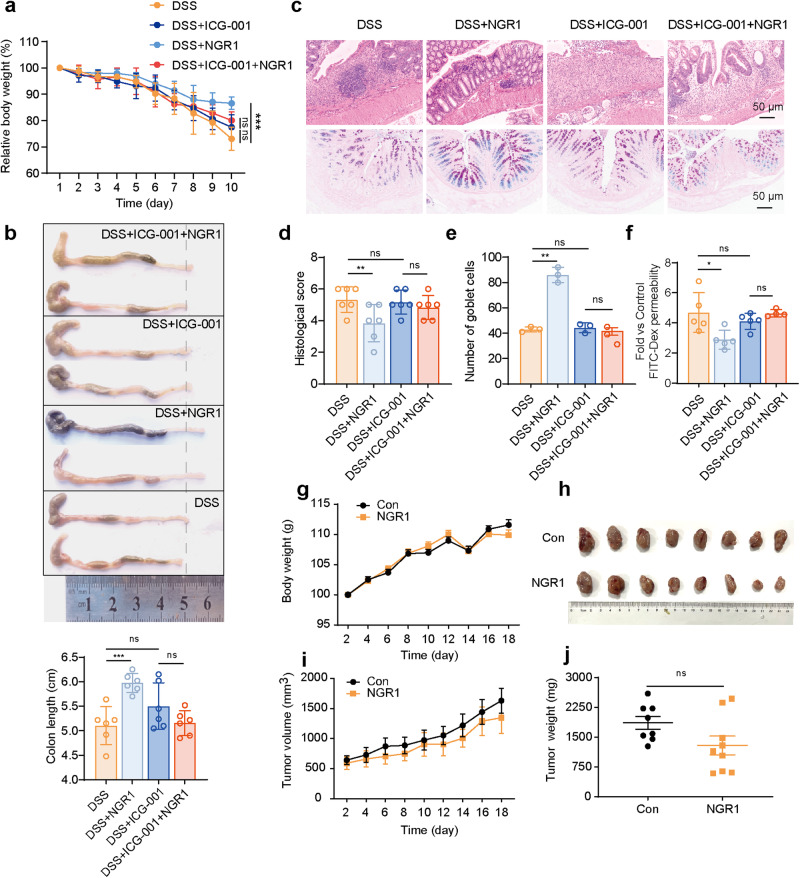
Inflammatory bowel disease (IBD) is characterized by persistent damage to the intestinal barrier and excessive inflammation, leading to increased intestinal permeability. Current treatments of IBD primarily address inflammation, neglecting epithelial repair. Our previous study has reported the therapeutic potential of notoginsenoside R1 (NGR1), a characteristic saponin from the root of Panax notoginseng, in alleviating acute colitis by reducing mucosal inflammation. In this study we investigated the reparative effects of NGR1 on mucosal barrier damage after the acute injury stage of DSS exposure. DSS-induced colitis mice were orally treated with NGR1 (25, 50, 125 mg·kg-1·d-1) for 10 days. Body weight and rectal bleeding were daily monitored throughout the experiment, then mice were euthanized, and the colon was collected for analysis. We showed that NGR1 administration dose-dependently ameliorated mucosal inflammation and enhanced epithelial repair evidenced by increased tight junction proteins, mucus production and reduced permeability in colitis mice. We then performed transcriptomic analysis on rectal tissue using RNA-sequencing, and found NGR1 administration stimulated the proliferation of intestinal crypt cells and facilitated the repair of epithelial injury; NGR1 upregulated ISC marker Lgr5, the genes for differentiation of intestinal stem cells (ISCs), as well as BrdU incorporation in crypts of colitis mice. In NCM460 human intestinal epithelial cells in vitro, treatment with NGR1 (100 μM) promoted wound healing and reduced cell apoptosis. NGR1 (100 μM) also increased Lgr5+ cells and budding rates in a 3D intestinal organoid model. We demonstrated that NGR1 promoted ISC proliferation and differentiation through activation of the Wnt signaling pathway. Co-treatment with Wnt inhibitor ICG-001 partially counteracted the effects of NGR1 on crypt Lgr5+ ISCs, organoid budding rates, and overall mice colitis improvement. These results suggest that NGR1 alleviates DSS-induced colitis in mice by promoting the regeneration of Lgr5+ stem cells and intestinal reconstruction, at least partially via activation of the Wnt/β-Catenin signaling pathway. Schematic diagram of the mechanism of NGR1 in alleviating colitis. DSS caused widespread mucosal inflammation epithelial injury. This was manifested by the decreased expression of tight junction proteins, reduced mucus production in goblet cells, and increased intestinal permeability in colitis mice. Additionally, Lgr5+ ISCs were in obviously deficiency in colitis mice, with aberrant down-regulation of the Wnt/β-Catenin signaling. However, NGR1 amplified the expression of the ISC marker Lgr5, elevated the expression of genes associated with ISC differentiation, enhanced the incorporation of BrdU in the crypt and promoted epithelial restoration to alleviate DSS-induced colitis in mice, at least partially, by activating the Wnt/β-Catenin signaling pathway.

Keywords: ICG-001; Wnt/β-Catenin pathway; inflammatory bowel disease; intestinal stem cells; notoginsenoside R1.


Conflict of interest statement

The authors declare no competing interests.

Figures

None
Schematic diagram of the mechanism of NGR1 in alleviating colitis. DSS caused widespread mucosal inflammation epithelial injury. This was manifested by the decreased expression of tight junction proteins, reduced mucus production in goblet cells, and increased intestinal permeability in colitis mice. Additionally, Lgr5+ ISCs were in obviously deficiency in colitis mice, with aberrant down-regulation of the Wnt/β-Catenin signaling. However, NGR1 amplified the expression of the ISC marker Lgr5, elevated the expression of genes associated with ISC differentiation, enhanced the incorporation of BrdU in the crypt and promoted epithelial restoration to alleviate DSS-induced colitis in mice, at least partially, by activating the Wnt/β-Catenin signaling pathway.
Fig. 1
Fig. 1. NGR1 relieves the symptoms of colitis mice caused by DSS.
a The drawing chart presented the animal experimental procedure. b Changes in body weight in mice of each group. The data were plotted as a percentage of the weight at baseline. Each bar represents the mean ± SD (n = 6 per group). (c) The occurrence of bloody diarrhea. The data are plotted as a percentage of the total mice that had bloody diarrhea at different time points. Each bar represents the mean ± SEM (n = 6 per group). (d, e) Colonic-length changes in mice of each group. f Colonic pathological injury was examined by H&E staining. Scale bar = 50 μm. g Histology scores were counted and presented. Each bar represents the mean ± SD (n = 3 per group). ###P < 0.001 vs. Control group; *P < 0.05, **P < 0.01, ***P < 0.001 vs. DSS group.
Fig. 2
Fig. 2. NGR1 enhances intestinal barrier in colitis mice.
a Colonic pathological injury was examined by AB-PAS staining. Scale bar = 50 μm. b Quantitative analysis of goblet cells. c The FITC-dextran fluorescence intensity in serum was measured by microplate reader (n = 4–5). d, e DAO and LPS in serum, examined by ELISA. Each bar represents the mean ± SD (n = 6 per group). f Representative ZO-1 and Occludin immunofluorescence-stained sections of colonic tissue (scale bar = 100 μm). g, h Relative fluorescence intensity statistics of ZO-1 and Occludin (n = 3 per group). i mRNA expression levels of ZO-1 and Occludin (n = 4 per group). Each bar represents the mean ± SD. ##P < 0.05, ###P < 0.001 vs. Control group; *P < 0.05, **P < 0.01, ***P < 0.001 vs. DSS group.
Fig. 3
Fig. 3. NGR1 remodels the intestinal gene expression profile, downregulates pro-inflammatory genes, and promotes the repair of epithelial injury.
a Volcano plots of RNA-sequencing of differentially expressed genes in the colon. b Venn diagram of the intersection of Control, DSS and DSS + NGR1 group. c GO analyses showing up/down-regulated gene clusters after NGR1 treatment. d Heatmaps of inflammation and proliferation-related genes (n = 5 per group). e RT-qPCR analysis of the expression of inflammatory mediators of COX-2, iNOS, and IL-6 in the colon samples of mice. Each bar represents the mean ± SD (n = 6 per group). f Representative images of scratch wound assays for NCM460 cell monolayers at 0 and 24 h after scratching. Each bar represents the mean ± SD (n = 3 per group). g Representative BrdU immunohistochemical-stained sections of colonic tissue (scale bar = 200 μm). Each bar represents the mean ± SD (n = 3 per group). h Effect of NGR1 on the viability of NCM460 cells (n = 3 per group). i The apoptosis of NCM460 cells was detected by flow cytometry with annexin V-FITC/PI double staining, and the experiment was repeated three times. Each bar represents the mean ± SD (n = 3 per group). ###P < 0.001 vs. Control group; *P < 0.05, **P < 0.01, ***P < 0.001 vs. DSS group.
Fig. 4
Fig. 4. NGR1 protects against the damage of Lgr5+ intestinal stem cell induced by DSS.
a Heatmaps of proliferation associated and stem cell-associated genes (n = 6 per group). b Representative Lgr5 immunofluorescence-stained sections of colonic tissue (scale bar = 50 μm). c Representative budding diagram of intestinal crypt Organoid, and the number of Organoid buds was counted and presented. (scale bar = 200 μm) (n = 3 per group). d Representative Lgr5 immunofluorescence-stained sections of Organoid. Scale bar = 200 μm. eg Effects of NGR1 on the expression of Lgr5, Olfm4, Ascl2, Muc2, Lyz1, Gip, Sglt1, Vill-1, and Sis mRNA in Organoid (n = 4 per group). Each bar represents the mean ± SD. ###P < 0.001 vs. Control group; *P < 0.05, **P < 0.01, ***P < 0.001 vs. DSS group.
Fig. 5
Fig. 5. NGR1 activates the Wnt/β-Catenin signaling in colitis mice.
a The KEGG pathway enrichment analysis of differential genes after NGR1 treatment. b GSEA analysis of Wnt signaling pathway-associated genes in DSS + NGR1 group and DSS group mice. Normalized enrichment score (NES) and false discovery rates (FDR) are indicated. c Molecular docking of skl2001/NGR1 and β-Catenin proteins and their binding sites. d Transcriptional activity of TOPFlash was determined using luciferase reporter assay. e, f Representative protein expression levels of β-Catenin, p-GSK-3β, Cyclin D1, c-Myc and β-actin. Each bar represents the mean ± SD (n = 3 per group). g Representative β-Catenin (green) and Ki67 (red) immunofluorescence-stained sections of colonic tissue. h Representative β-Catenin immunofluorescence-stained protein expression in Organoid. #P < 0.05 ##P < 0.01, ###P < 0.001 vs. Control group; *P < 0.05, **P < 0.01, ***P < 0.001 vs. DSS group.
Fig. 6
Fig. 6. ICG-001 abolishes the protective effect of NGR1 on DSS-induced colitis.
a The drawing chart presented the animal experimental procedure. b Representative protein expression levels of β-Catenin, p-GSK-3β, Cyclin D1, c-Myc and β-actin. Each bar represents the mean ± SD (n = 3 per group). c Representative Lgr5 (green) and β-Catenin (red) immunofluorescence-stained sections of colonic tissue. d Representative budding diagram of intestinal crypt Organoid, and the number of Organoid buds were counted and presented. Each bar represents the mean ± SD (n = 3 per group). *P < 0.05, **P < 0.01, ***P < 0.001 vs. DSS group.
Fig. 7
Fig. 7. ICG-001 inhibites the activation of Wnt/β-Catenin signaling by NGR1.
a Changes in body weight in mice of each group. The data were plotted as a percentage of the weight at baseline. Each bar represents the mean ± SD (n = 6 per group). b Colonic-length changes in mice of each group. Each bar represents the mean ± SD (n = 5–6 per group). c Colonic pathological injury was examined by H&E staining and AB-PAS staining. Scale bar = 50 μm. d Histology scores were counted and presented. e Quantitative analysis of goblet cells. f The fluorescence intensity of FITC-dextran was detected by fluorescence spectroscopy. Each bar represents the mean ± SD (n = 3–6 per group). g The mice body weight changes were monitored throughout the study. Each bar represents the mean ± SD (n = 8–9 per group). h Tumors were taken out after sacrifice of animal. i Tumor volume was measured during the test period. Each bar represents the mean ± SD (n = 8–9 per group). j Tumor weights were measured after the sacrifice of animal. Each bar represents the mean ± SD (n = 8–9 per group). *P < 0.05, **P < 0.01, ***P < 0.001 vs. DSS group.

Similar articles

Cited by

References

    1. Villablanca EJ, Selin K, Hedin CRH. Mechanisms of mucosal healing: treating inflammatory bowel disease without immunosuppression? Nat Rev Gastroenterol Hepatol. 2022;19:493–507. doi: 10.1038/s41575-022-00604-y. - DOI - PubMed
    1. Windsor JW, Kaplan GG. Evolving epidemiology of IBD. Curr Gastroenterol Rep. 2019;21:40. doi: 10.1007/s11894-019-0705-6. - DOI - PubMed
    1. Borren NZ, van der Woude CJ, Ananthakrishnan AN. Fatigue in IBD: epidemiology, pathophysiology and management. Nat Rev Gastroenterol Hepatol. 2019;16:247–59. doi: 10.1038/s41575-018-0091-9. - DOI - PubMed
    1. Stange EF, Schroeder BO. Microbiota and mucosal defense in IBD: an update. Expert Rev Gastroenterol Hepatol. 2019;13:963–76. doi: 10.1080/17474124.2019.1671822. - DOI - PubMed
    1. Hou Q, Huang J, Ayansola H, Masatoshi H, Zhang B. Intestinal stem cells and immune cell relationships: potential therapeutic targets for inflammatory bowel diseases. Front Immunol. 2020;11:623691. doi: 10.3389/fimmu.2020.623691. - DOI - PMC - PubMed