. 2024 Mar;4(3):364-378.
doi: 10.1038/s43587-024-00583-6. Epub 2024 Mar 15.

A single-nuclei paired multiomic analysis of the human midbrain reveals age- and Parkinson's disease-associated glial changes

Affiliations

A single-nuclei paired multiomic analysis of the human midbrain reveals age- and Parkinson's disease-associated glial changes

Levi Adams et al. Nat Aging. 2024 Mar.

Abstract

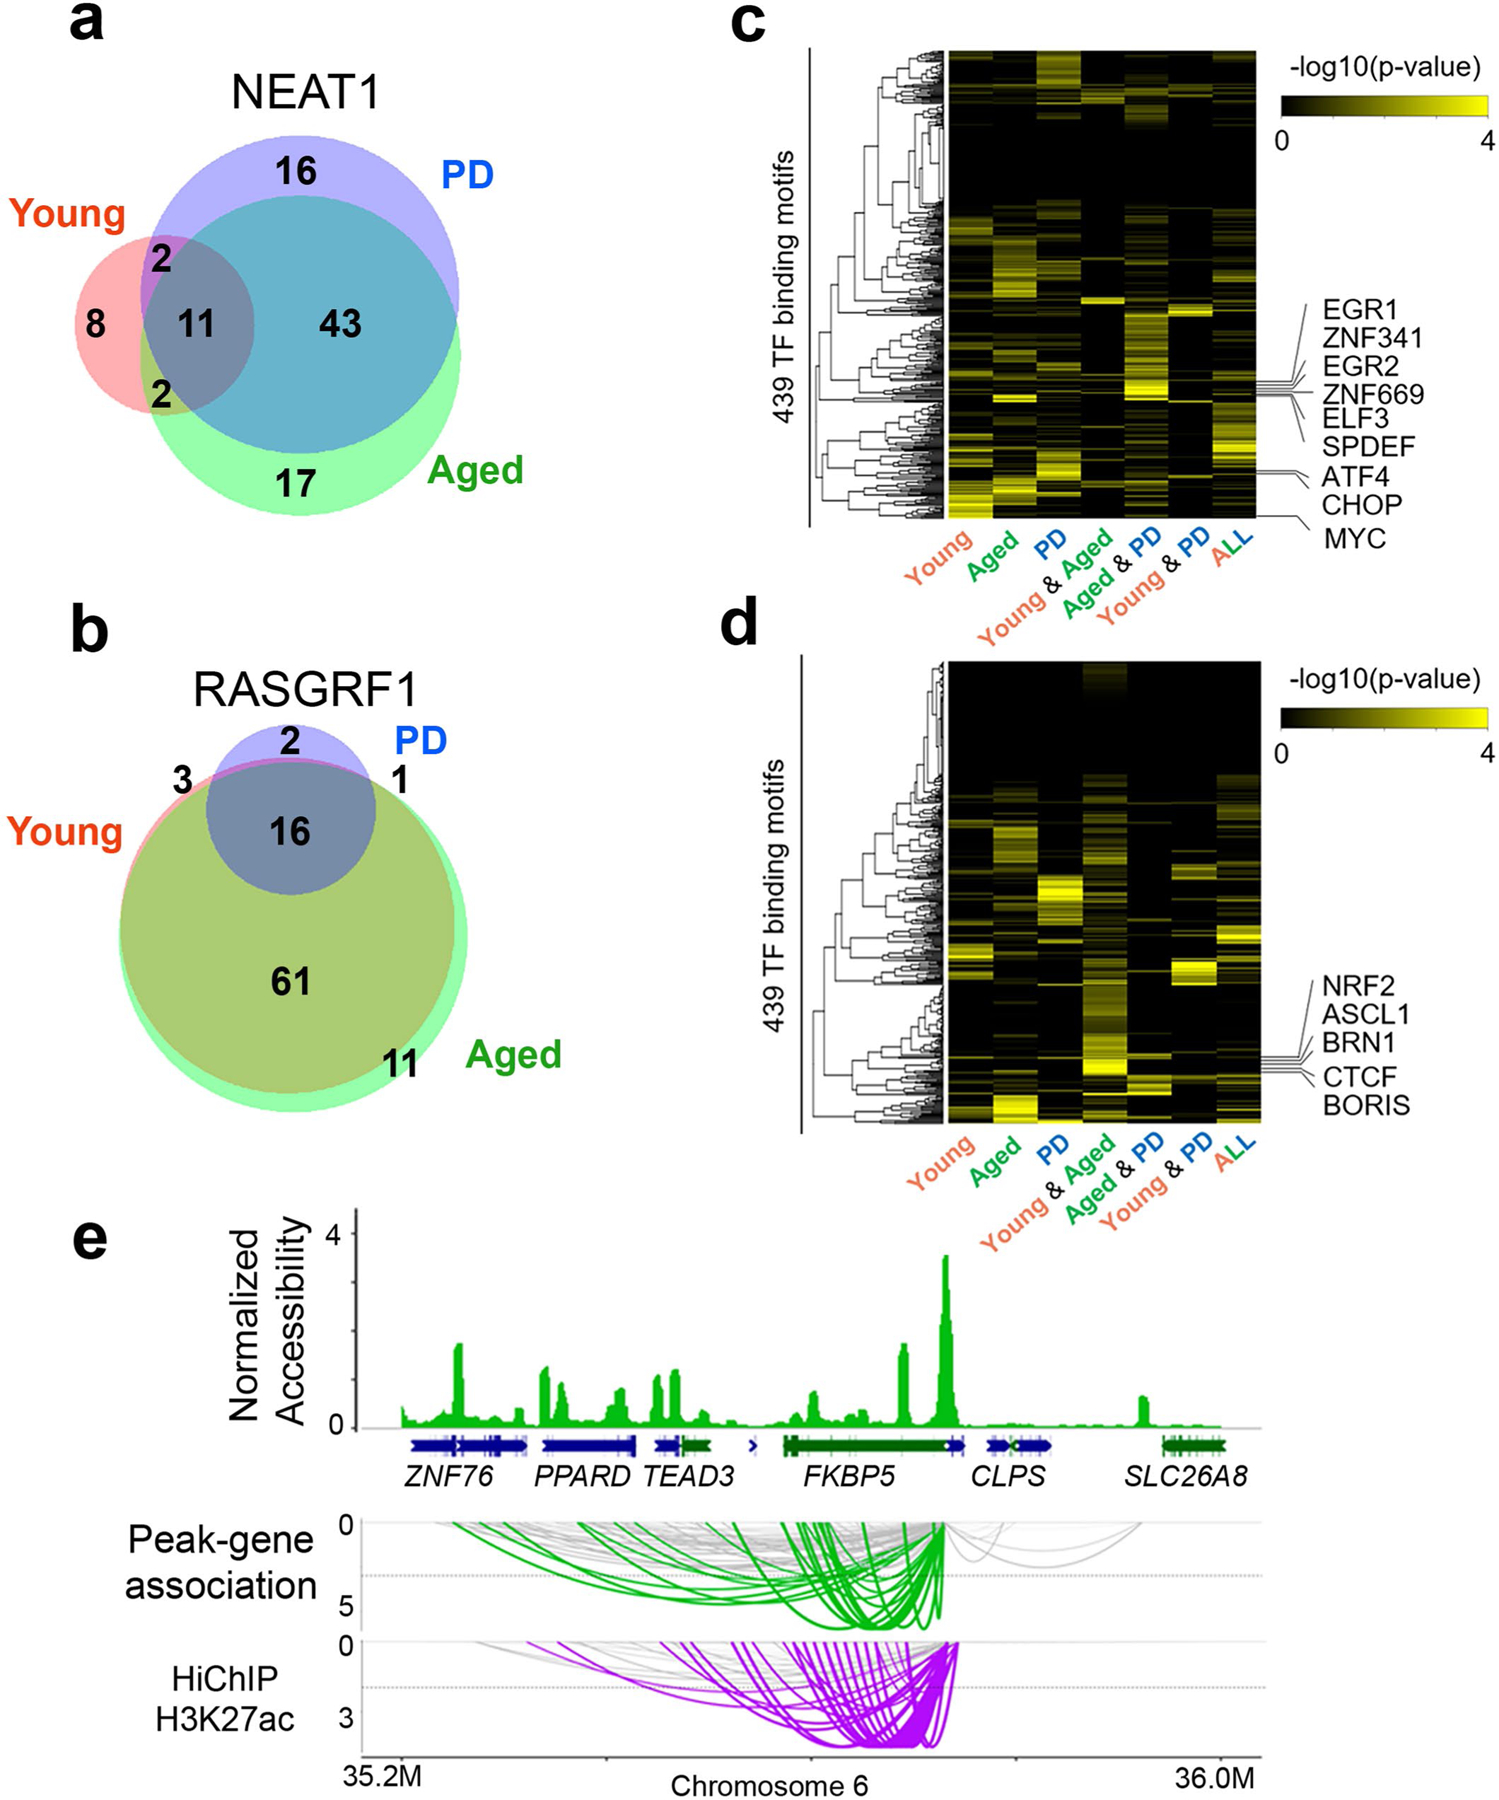
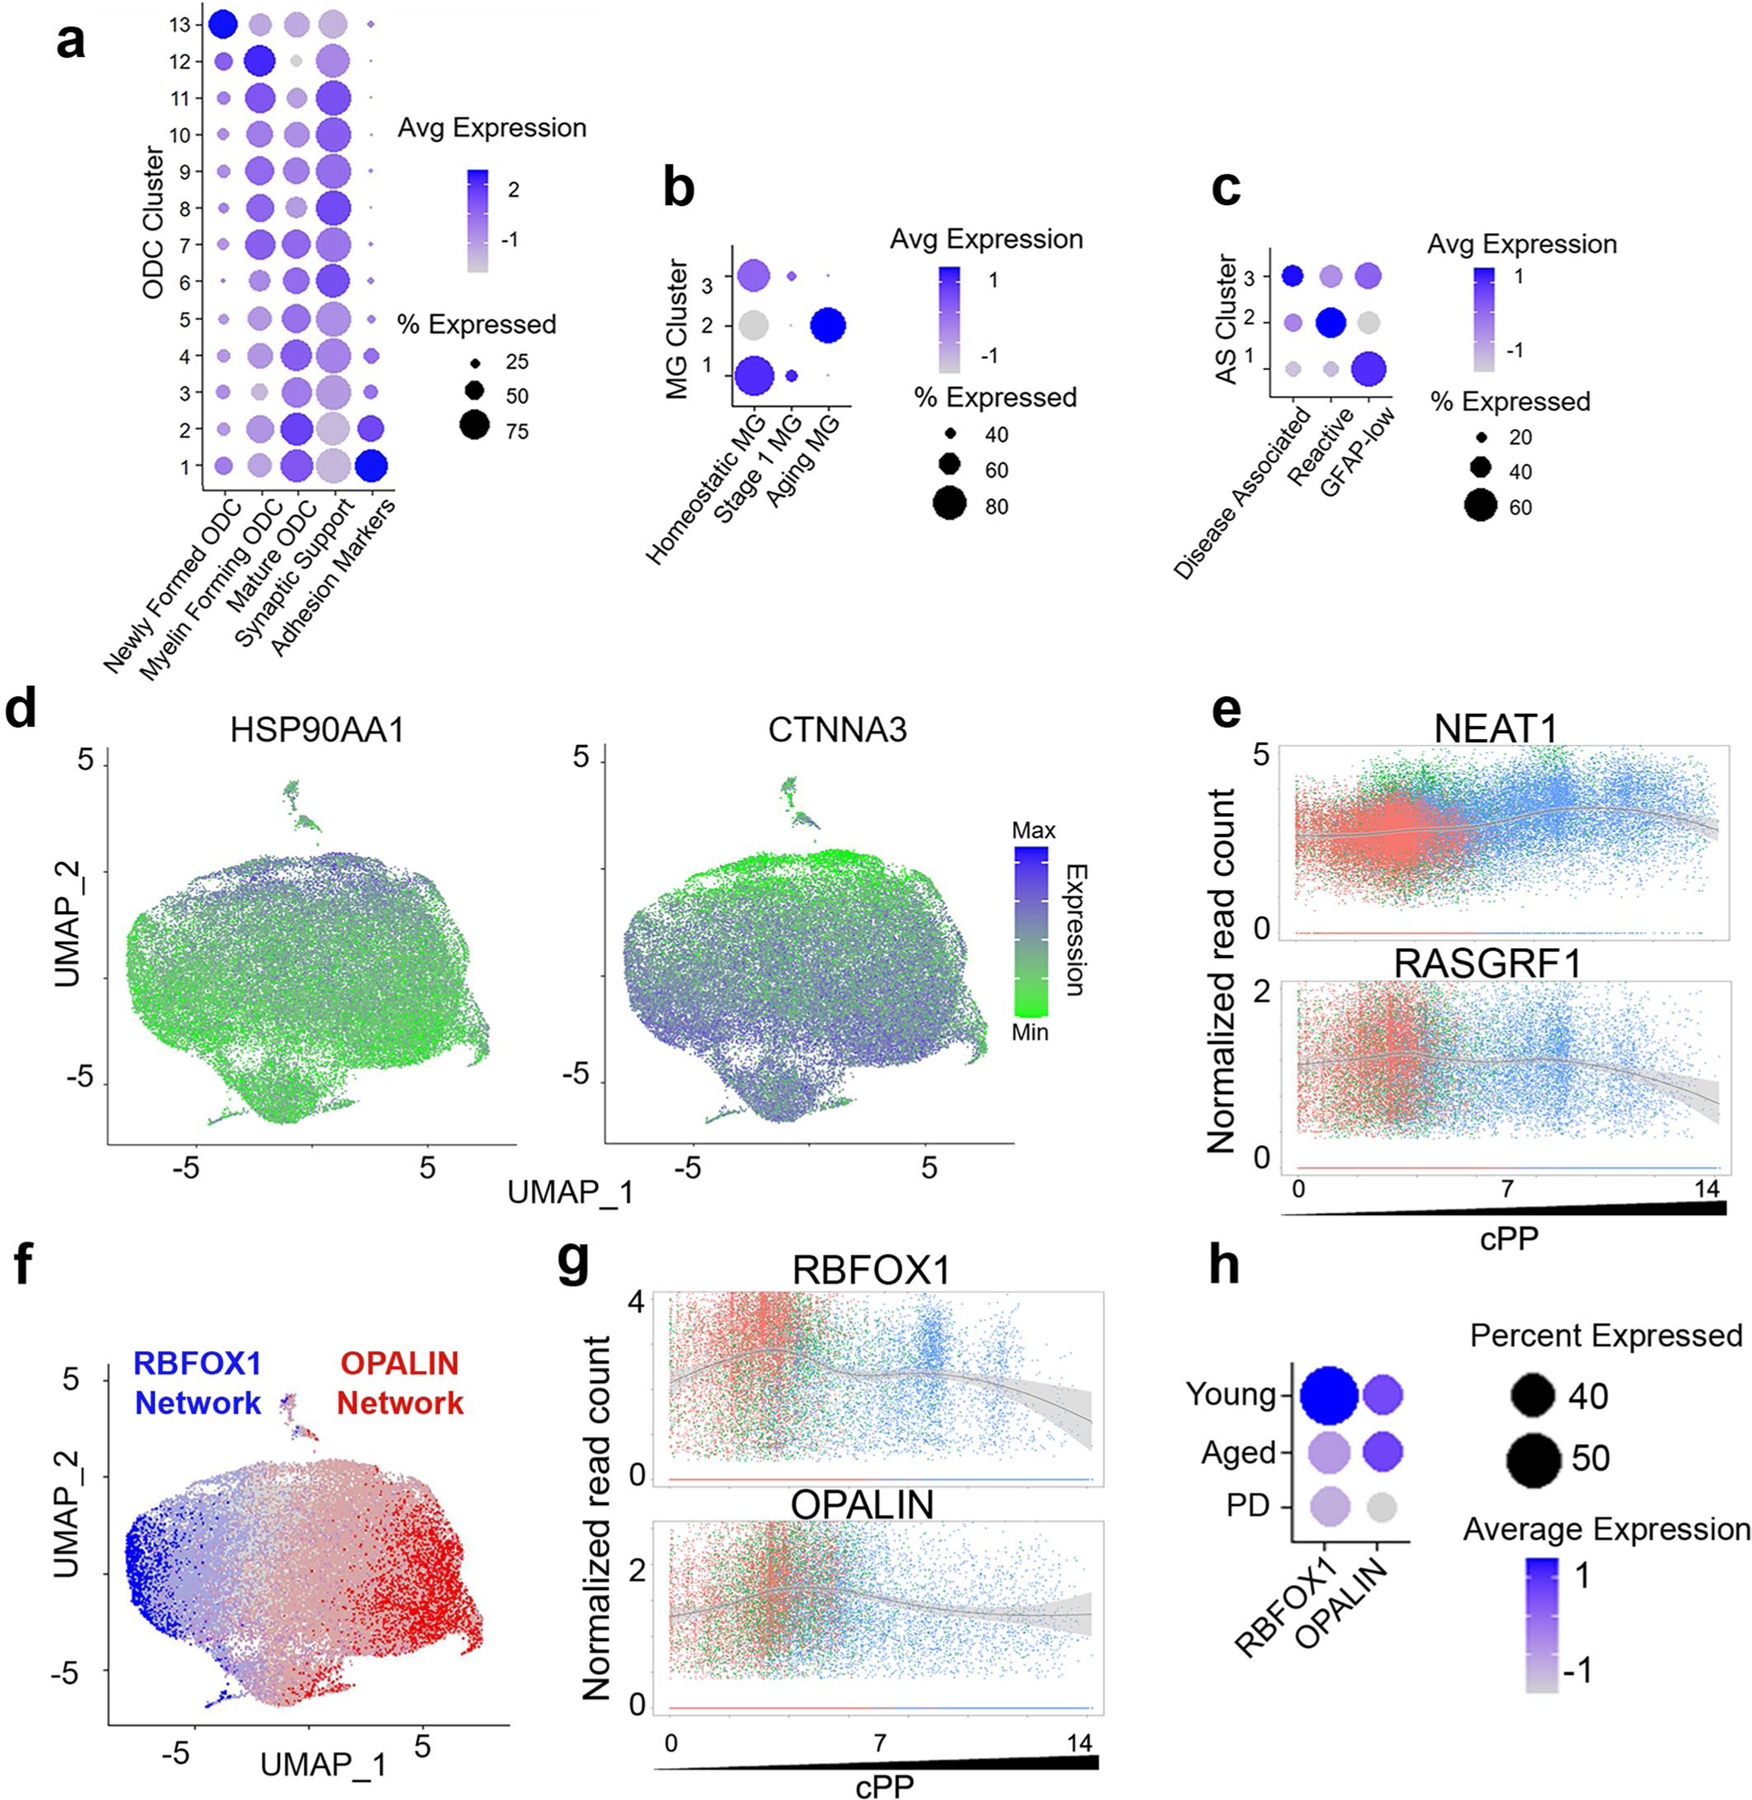
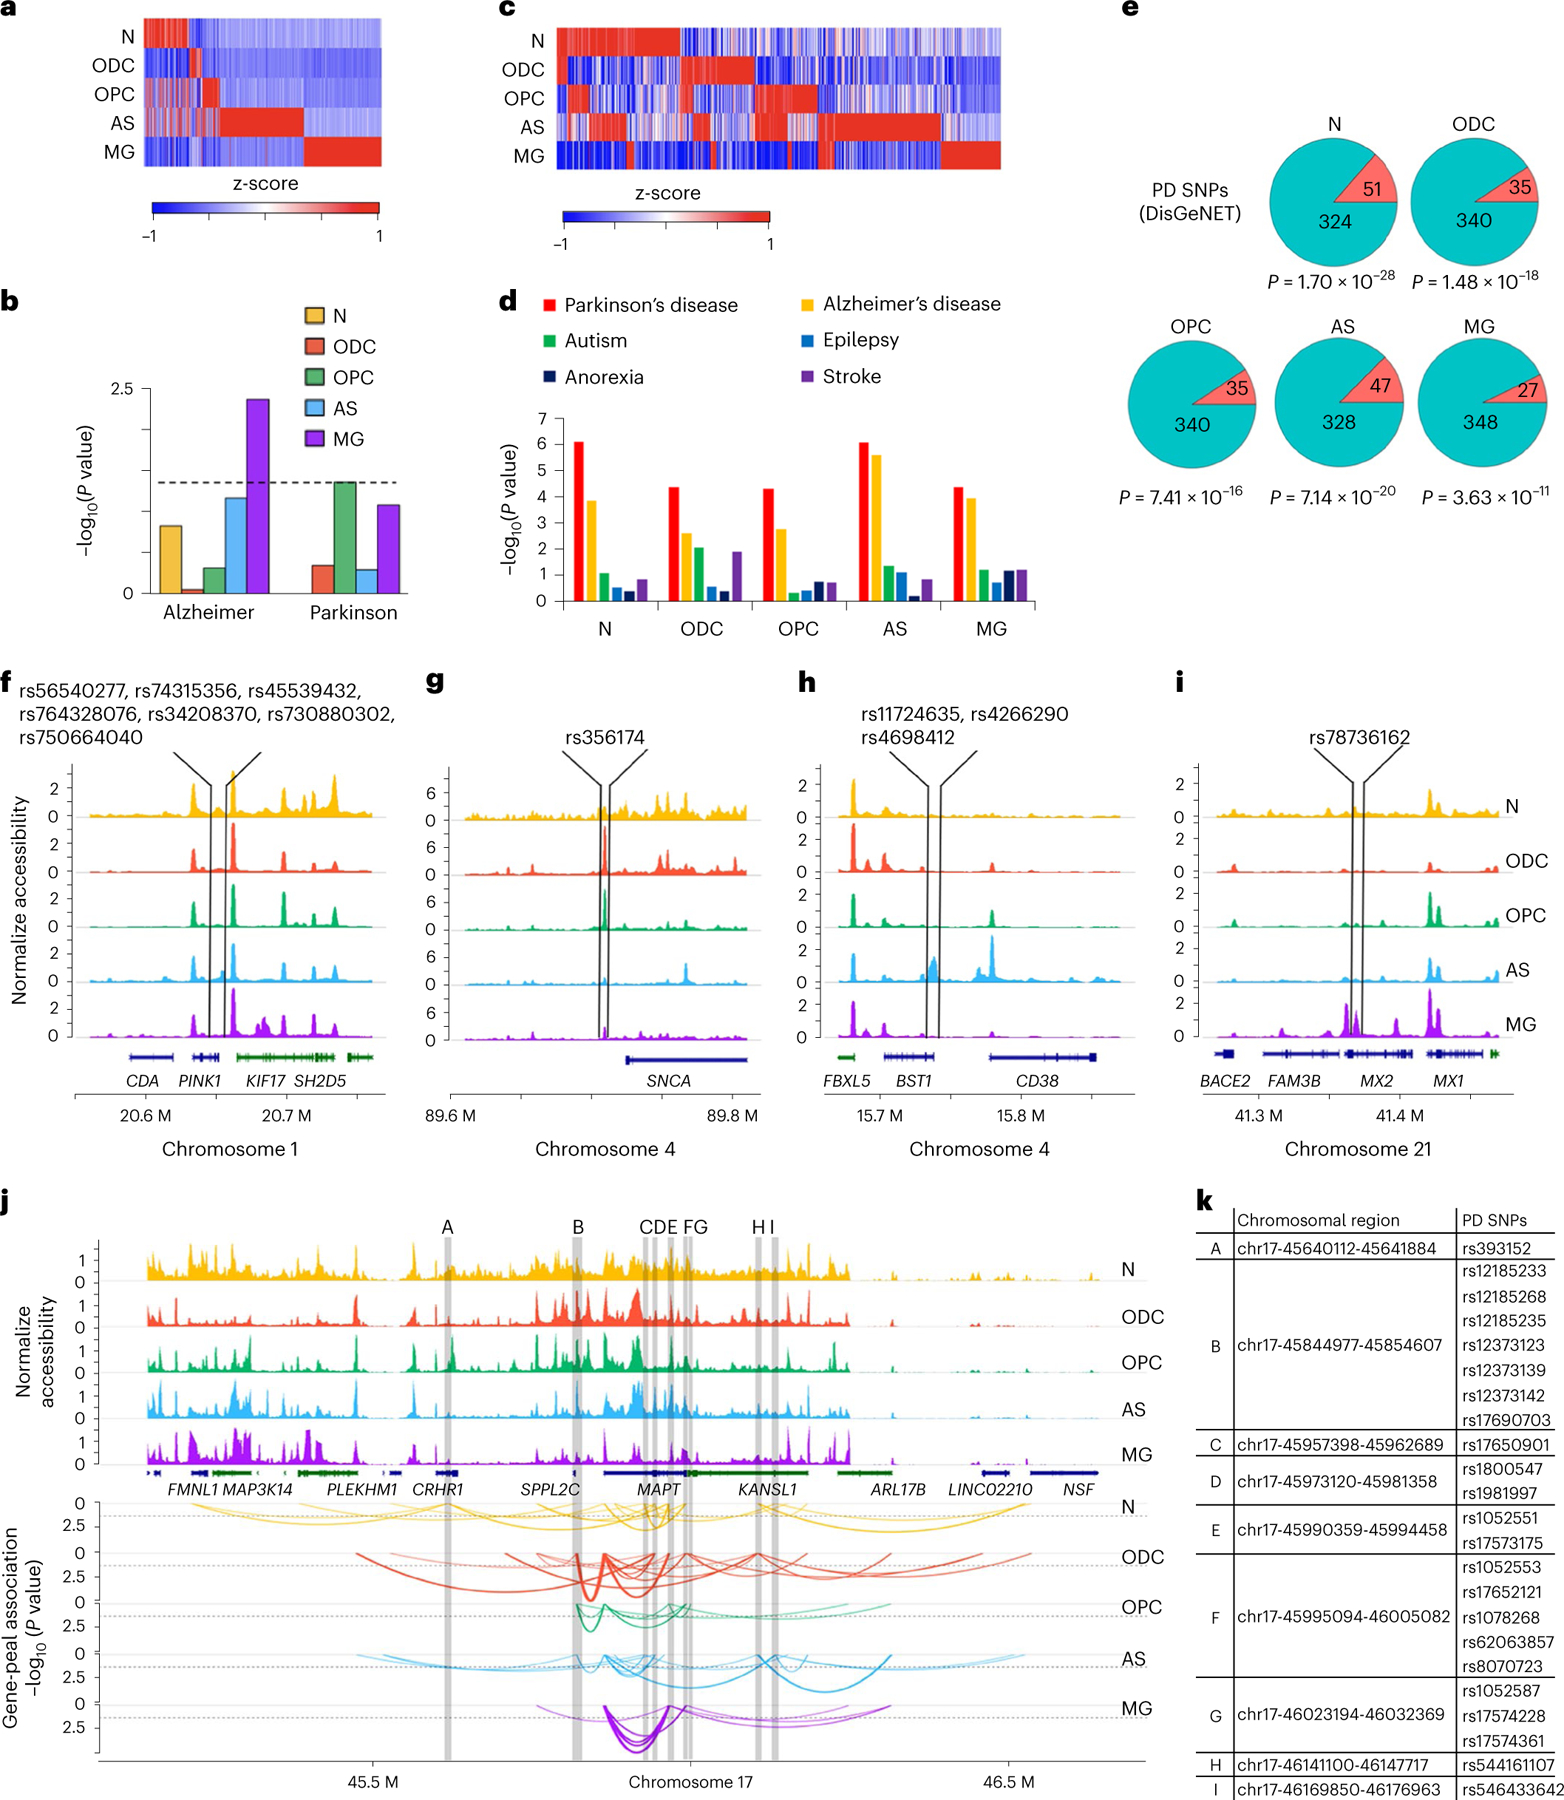
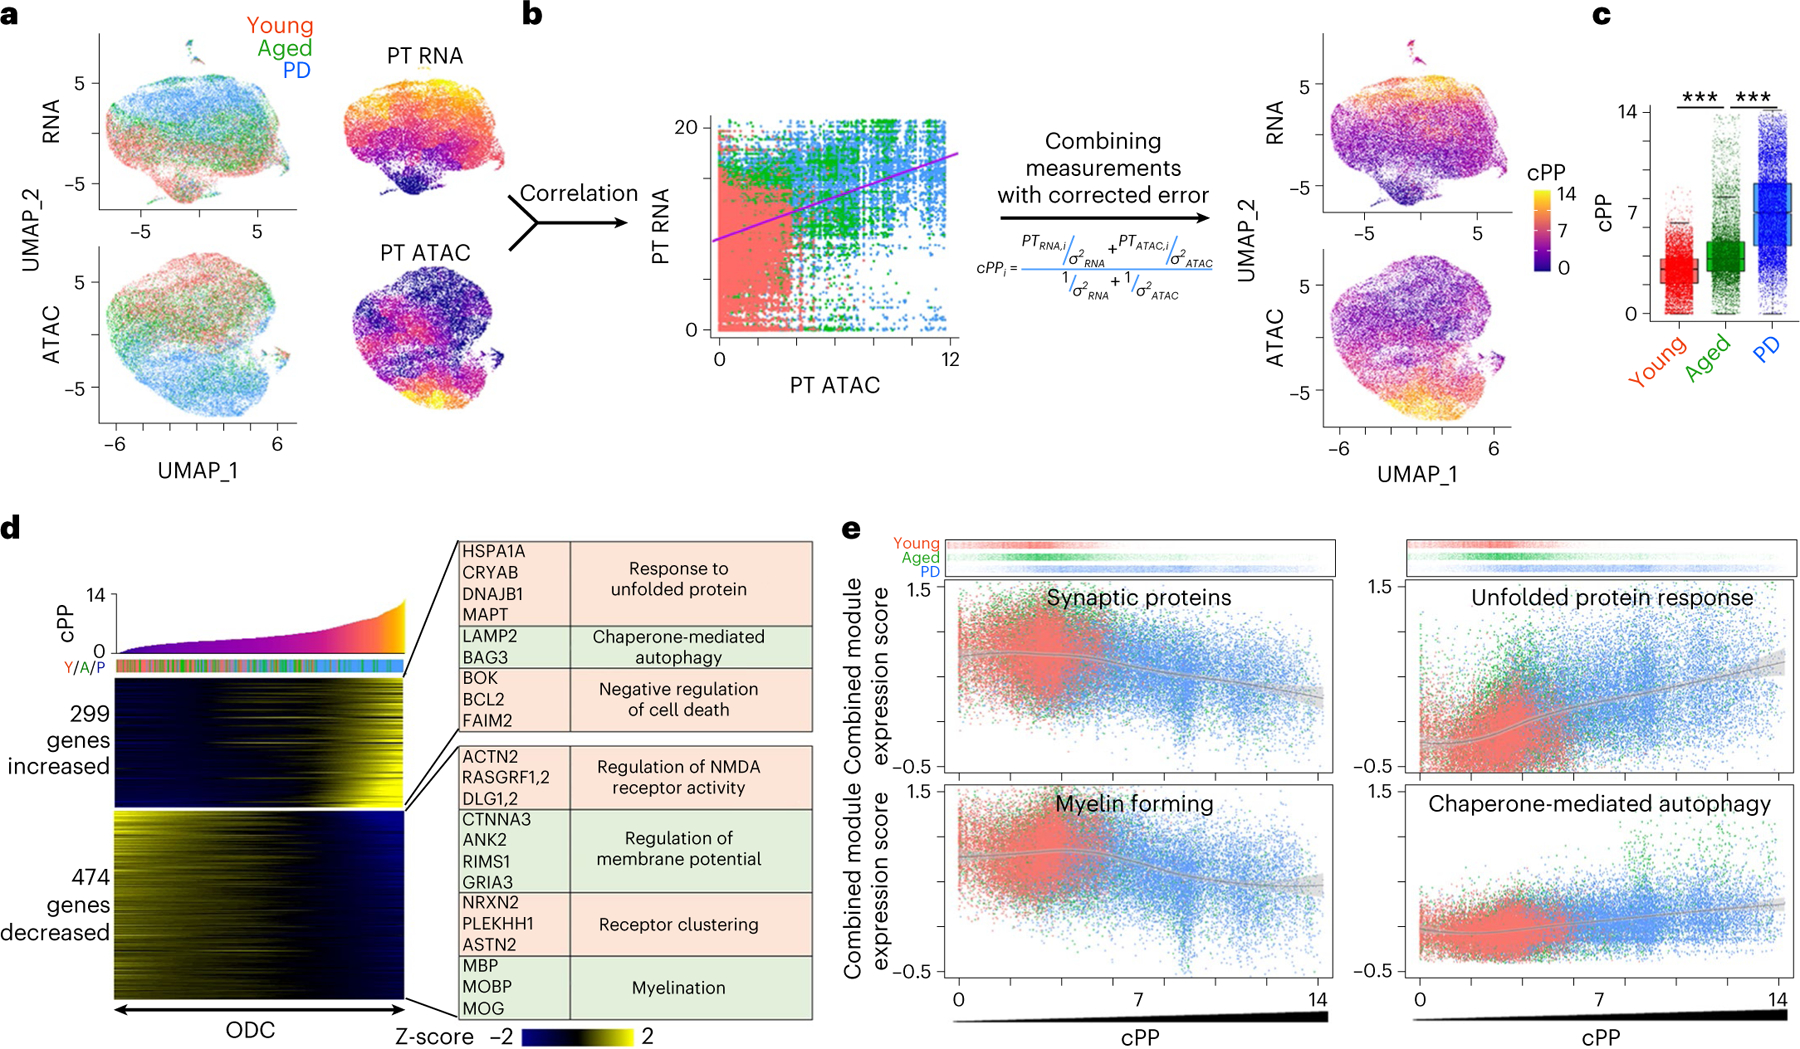
Age is the primary risk factor for Parkinson's disease (PD), but how aging changes the expression and regulatory landscape of the brain remains unclear. Here we present a single-nuclei multiomic study profiling shared gene expression and chromatin accessibility of young, aged and PD postmortem midbrain samples. Combined multiomic analysis along a pseudopathogenesis trajectory reveals that all glial cell types are affected by age, but microglia and oligodendrocytes are further altered in PD. We present evidence for a disease-associated oligodendrocyte subtype and identify genes lost over the aging and disease process, including CARNS1, that may predispose healthy cells to develop a disease-associated phenotype. Surprisingly, we found that chromatin accessibility changed little over aging or PD within the same cell types. Peak-gene association patterns, however, are substantially altered during aging and PD, identifying cell-type-specific chromosomal loci that contain PD-associated single-nucleotide polymorphisms. Our study suggests a previously undescribed role for oligodendrocytes in aging and PD.


Conflict of interest statement

Competing interests

Y.T. works as a consultant in Colossal Biosciences. The other authors declare no competing interests.

Figures

Extended Data Fig. 1 |
Extended Data Fig. 1 |. Multiomic analysis of human midbrain.
a, UMAP visualization of single nuclei by RNA (left) and ATAC (right) profiles. Nuclei are colored by 23 joint clusters. b, Heatmap showing Spearman correlation of average RNA expression (left) and ATAC peaks profiles (right) by cell types for each individual. Top and second color bars represent groups of donors and cell types, respectively. c, Enrichment of motifs in each annotated cell type.
Extended Data Fig. 2 |
Extended Data Fig. 2 |. Changes in peak-gene connections in young, aged, and PD for NEAT1 and RASGRF1.
a,b, Venn diagram of the number of associated peaks with NEAT1 (a) and RASGRF1 (b) for young, aged, and PD midbrain. c,d, Heatmap showing enrichment of TF binding motifs in associated peaks with NEAT1 (c) and RASGRF1 (d). e, Comparison of peak-gene association detected in our samples with H3K27ac HiChIP data from the human midbrain (Morabito et al.) near the FKBP5 locus.
Extended Data Fig. 3 |
Extended Data Fig. 3 |. Different distribution of PD-associated SNPs within ATAC peaks across cell types.
a, Number of PD-related SNPs is shown on the ideogram in each cell type. (blue, 1; purple, 2; green, 3; orange, 5; red, 7 SNPs) b, Differential peak-gene associations in astrocytes across PD patients and healthy young and aged donors. Whereas the ATAC peak on the BST1 locus is commonly detected in PD patients and healthy donors, the peak-gene associations are different between PD patients and healthy donors. This ATAC peak contains three PD-related SNPs.
Extended Data Fig. 4 |
Extended Data Fig. 4 |. cPP analysis of ODC.
a-c, Dot plot displaying enrichment of gene expression modules for functionally distinct subpopulations for ODC (a), MG (b), and AS (c) clusters in the human midbrain. d, Example genes that have a correlated increase (HSP90AA1) and decrease (CTNNA3) of expression with cPP trajectory. e, Plot of expression of NEAT1 and RASGRF1 across cPP trajectory. NEAT1 expression is correlated with increasing cPP score; RASGRF1 expression is inversely correlated with cPP score (NEAT1: Spearman correlation = 0.314, p < 2.2e-16, RASGRF1: Spearman correlation = −0.110, p < 2.2e-16). Black line indicates loess-smoothed curve, and the gray outline represents 95% CI. f, UMAP of RBFOX1 and OPALIN and their coexpressed genes are mutually exclusive in ODC. g, Expression plot of RBFOX1 and OPALIN across cPP trajectory. n = 15,192 (Young), 11,973 (Aged), and 18,415 (PD). h, Dot plot of gene expression for RBFOX1 and OPALIN in each donor cohort.
Extended Data Fig. 5 |
Extended Data Fig. 5 |. Establishment of pseudopathogenesis trajectory in AS.
a, UMAP plot of AS nuclei colored by subclusters b, UMAP plot of AS nuclei colored by young, aged, and PD donor. c, UMAP plot of AS nuclei colored by cPP. d, cPP scores of individual AS nuclei from young, aged, and PD midbrain are significantly changed over aging but not a disease state. (One-way ANOVA with Tukey’s post-hoc analysis, p-value for Y/A = 0.002, p-value for Y/P = 5.28e-4, p-value for A/P = 0.24). p-values are represented as ** p < 0.01 and *** p < 0.001. e, Heatmap showing AS genes correlated with cPP trajectory. X-axis represents individual cells sorted by cPP. Y-axis of heatmap represents positively (upper)- and negatively (bottom)-correlated genes. Representative genes and significant GO terms are shown in the right panel (Spearman correlation > 0.1 or < −0.1).n = 999 (Young), 397 (Aged), and 1,032 (PD). The bottom, center, and top of the box represent 25, 50, and 75 percentile. Whiskers represent 1.5 × IQR. f, Gene expression modules across AS cPP trajectory. Top panel shows individual nuclei AS along with cPP scores and donor group. X-axis shows the cPP score. Y-axis is the combined expression level for all genes in the expression module. Black line indicates loess-smoothed curve, and the gray outline represents 95% CI.
Extended Data Fig. 6 |
Extended Data Fig. 6 |. Aging- and disease-specific analysis.
a, Violin plot of cPP score of every individual ODC nuclei by donor. b, Bar graph showing the percentage of nuclei in donor cohort from healthy, intermediate, and disease groups. c, UMAP showing healthy, intermediate, and disease subsets from publicly available snRNA-seq data (Smajić et al, 2022) from the human PD and aged control midbrain after pseudopathogenesis analysis. d, Dot plots of genes from the same dataset (Smajić et al, 2022) showing similar expression patterns among healthy, intermediate, and disease subsets as our multiomic dataset. Circle size represents relative gene expression to healthy subsets. e,f, Representative peak-gene connection plots for peaks containing PD-associated SNPs that have decreased (e) or increased (f) gene connections in disease-associated ODC compared to healthy ones. Motif information was obtained from the JASPAR Transcription Factors track in the UCSC genome browser. SNPs associated with each peak are shown below.
Fig. 1 |
Fig. 1 |. Multiomic analysis of human midbrain.
a, Schematic of isolation and snATAC plus gene expression analysis for human postmortem midbrain (created with BioRender). b,c, UMAP visualization of single nuclei by RNA (b) and ATAC (c) profiles. Nuclei are colored by identified cell type (left) and donor type (right). d, Expression of cell-type-specific genes in each annotated cell type cluster. Error bars represent mean ± s.e.m. e, Chromatin accessibility at cell-type-specific genes in each annotated cell type cluster. f, Percentage of each cell type passing quality control criteria identified in young, aged and PD. Two-sided Student’s t-test shows that ODCs significantly changed from young to aged (P = 0.002) and aged to PD (P = 0.023). MG significantly changed from young to aged (P = 0.007) and aged to PD (P = 0.042). P values are represented as *P < 0.05, **P < 0.01 and ***P < 0.001. Ns (n = 489), ODCs (n = 45,580), ASs (n = 2,428), MG (n = 4,482), OPCs (n = 4,396), ECs (n = 125) and Ts (n = 110). SN, substantia nigra.
Fig. 2 |
Fig. 2 |. Analysis of peak–gene connections in the human midbrain.
a, Schematic of peak–gene analysis between samples. b, Comparison of the number of connected peaks in each gene between young and aged (left) and young and PD (right) midbrain. Some genes show altered peak connections from young in both aged and PD (red dots). Some genes show altered peak connections only in PD (blue dots). c,d, Peak–gene connection plots for NEAT1 (c) and RASGRF1 (d) among young, aged and PD midbrain. Top, normalized ATAC read count distribution. Bottom, arcs show ATAC peaks significantly correlated with gene expression. Arc height represents statistical significance.
Fig. 3 |
Fig. 3 |. Enrichment of PD-associated SNPs in highly accessible open chromatin regions.
a, Heat map showing the normalized chromatin accessibility of cell-type-specific ATAC peaks by Corces et al. criteria. b, The enrichment of GWAS SNPs from AD and PD in the cell-type-specific ATAC peaks. c, Heat map showing the normalized chromatin accessibility of highly accessible peaks. d, LD score regression analysis of GWAS SNPs associated with neuronal and non-neuronal diseases. −log10(P value) for the heritability enrichment is shown by a bar graph. e, Pie chart representing the number of PD-associated SNPs within cell-type-specific ATAC peaks. Statistical significance was calculated by hypergeometric test. fi, Chromatin accessibility around cell-type-specific ATAC peaks in four different regions. These peaks are unique to Ns (f), ODCs/OPCs (g), ASs (h) and MG (i) and contain the indicated PD-associated SNPs. j, Differential chromatin accessibility and peak–gene associations around MAPT gene across cell types. Peak–gene associations were calculated from single-cell multiome data of patients with PD. Significant peak–gene associations are represented by colored thick curves. k, Chart showing PD-associated SNPs in the highlighted regions of j.
Fig. 4 |
Fig. 4 |. Establishment of pseudopathogenesis trajectory in ODCs.
a, UMAP plot of ODC nuclei colored by young, aged and PD donor (left) and heat map of RNA-based and ATAC-based pseudotime trajectory (right). b, Schematic of calculation of cPP score from transcriptome and ATAC profiles (Spearman correlation = 0.419; P = 2.2 × 10⁻¹⁶). c, Significant difference in cPP scores of individual ODC nuclei from young, aged and PD midbrain (one-way ANOVA with Tukey’s post hoc analysis; P for Y/A = 1 × 10−199, P for Y/P = 1 × 10−199 and P for A/P = 1 × 10−199). P values are represented as *P < 0.05, **P < 0.01 and ***P < 0.001. n = 15,192 (young), n = 11,973 (aged) and n = 18,415 (PD). The bottom, center and top of the box represent 25th, 50th and 75th percentiles, respectively. Whiskers represent 1.5× interquartile range. d, Heat map showing genes correlated with cPP trajectory. x axis represents individual cells sorted by cPPs. y axis of heat map represents positively (upper) and negatively (bottom) correlated genes. Representative genes and significant GO terms are shown in the right panel (Spearman correlation > 0.1 or Spearman correlation < −0.1). e, Change in gene expression modules across cPP trajectory in ODCs. Top panel shows individual ODC nuclei along cPP scores and donor group. x axis shows cPP score. y axis is the combined expression score for all genes in the expression module. Black line indicates LOESS-smoothed curve, and the gray outline represents 95% confidence interval. PT, pseudotime trajectory.
Fig. 5 |
Fig. 5 |. Establishment of cPP trajectory in MG.
a, UMAP plot of MG nuclei colored by subclusters b, UMAP plot of MG nuclei colored by young, aged and PD donors. c, UMAP plot of MG nuclei colored by cPP. d, Significant difference in cPP scores of individual MG nuclei from young, aged and PD midbrain (one-way ANOVA with Tukey’s post hoc analysis; P for Y/A = 1.71 × 10⁻⁸, P for Y/P = 1.71 × 10⁻⁸ and P for A/P = 1.71 × 10⁻⁸). P values are represented as *P < 0.05, **P < 0.01 and ***P < 0.001. n = 1,930 (young), n = 460 (aged) and n = 2,092 (PD). The bottom, center and top of the box represent 25th, 50th and 75th percentiles, respectively. Whiskers represent 1.5× interquartile range. e, Gene expression modules across MG cPP trajectory. Top panel shows individual MG nuclei along with cPP scores and donor group. x axis shows cPP score. y axis is the combined expression score for all genes in the expression module. Black line indicates LOESS-smoothed curve, and the gray outline represents 95% confidence interval.
Fig. 6 |
Fig. 6 |. Analysis of disease-associated ODCs.
a, Histogram and inferred multimodal distribution of ODCs across cPP. Mode valleys were identified using the ‘multimode’ package in R. Peaks were identified as healthy, intermediate and disease-associated ODCs. Bar graph shows the percentage of nuclei in each group from the three donor cohorts. b, Dot plot of selected genes with differential expression among healthy, intermediate and disease-associated cells. Left, genes with disease-specific changes with no differential expression between young and aged/PD. Right, genes differentially expressed over aging/PD. Circle size represents relative gene expression to healthy subsets or young. c, Heat maps represents relative peak intensity and peak–gene association to healthy group (log2(ratio)) for PD-associated SNP-containing peaks among healthy, intermediate and disease-associated ODCs. Statistical difference of the peak intensity and peak–gene association across the three groups were assessed by two-sided Student’s t-test. P for H/D = 8.28 × 10⁻⁴ and P for I/D = 1.49 × 10⁻². P values are represented as *P < 0.05 and ***P < 0.001. d, Peak–gene association plots for peaks with PD-associated SNPs that are significantly correlated with MAPT gene expression in healthy, intermediate and disease-associated ODCs. Black arrow indicates the location of MAPT promoter. SNPs associated with each peak are shown below. NS, not significant.
Fig. 7 |
Fig. 7 |. RNA-FISH of human midbrain samples.
Confocal imaging (×40) of RNA-FISH for FFPE human midbrain sections for indicated targets (scale bar, 15 μm). Inset (×100) (scale bar, 5 μm). a, Representative fluorescence images of CARNS1 and MBP showing reduced expression over aging/PD. b, Quantification of MBP and CARNS1 puncta within a 100 × 100-pixel square around MBP + ODC nuclei (one-way ANOVA with Tukey’s post hoc test; MBP, P for Y/A = 8.58 × 10⁻⁵, P for Y/P = 9.34 × 10⁻⁹ and P for A/P = 0.0387 (n: Y = 21, A = 18 and PD = 18); CARNS1, P for Y/A = 1.23 × 10⁻⁸, P for Y/P = 1.49 × 10⁻¹¹ and P for A/P = 2.78 × 10⁻⁴ (n: Y = 26, A = 18, PD = 18)). c, Representative fluorescence images of RBFOX1 showing a reduction in aged control compared to young samples. d, Quantification of RBFOX1 puncta in MBP+ nuclei (two-sided Student’s t-test, P = 0.0001, n: Y = 25 and A = 18). e, Representative fluorescence images of PDE1A showing a decrease in PD compared to aged control. f, Quantification of PDE1A puncta in MBP+ nuclei (two-sided Student’s t-test, P = 0.0106, n: A = 13 and PD = 13). g,i, Representative fluorescence images of SELENOP (g) and QDPR (i) showing increases in PD compared to aged control. h,j, Quantification of SELENOP (h) and QDPR (j) puncta in MBP+ nuclei (two-sided Student’s t-test. SELENOP, P = 0.0231 n: A = 22 and PD = 27; QDPR, P = 0.0021, n: A = 22 and PD = 27). For each target, we selected 3–5 fields from three unique donors from each cohort. P values are represented as *P < 0.05, **P < 0.01 and ***P < 0.001. Error bars represent s.e.m. A, aged; Y, young.

References

    1. Parkinsonʼs Foundation. Statistics. https://www.parkinson.org/understanding-parkinsons/statistics
    1. Pringsheim T, Jette N, Frolkis A & Steeves TD The prevalence of Parkinson’s disease: a systematic review and meta-analysis. Mov. Disord 29, 1583–1590 (2014). - PubMed
    1. Dauer W & Przedborski S Parkinson’s disease: mechanisms and models. Neuron 39, 889–909 (2003). - PubMed
    1. Hindle JV Ageing, neurodegeneration and Parkinson’s disease. Age Ageing 39, 156–161 (2010). - PubMed
    1. Davie K et al. A single-cell transcriptome atlas of the aging Drosophila brain. Cell 174, 982–998 (2018). - PMC - PubMed