. 2024 Apr;43(8):1653-1685.
doi: 10.1038/s44318-024-00063-y. Epub 2024 Mar 15.

MemPrep, a new technology for isolating organellar membranes provides fingerprints of lipid bilayer stress

Affiliations

MemPrep, a new technology for isolating organellar membranes provides fingerprints of lipid bilayer stress

John Reinhard et al. EMBO J. 2024 Apr.

Abstract

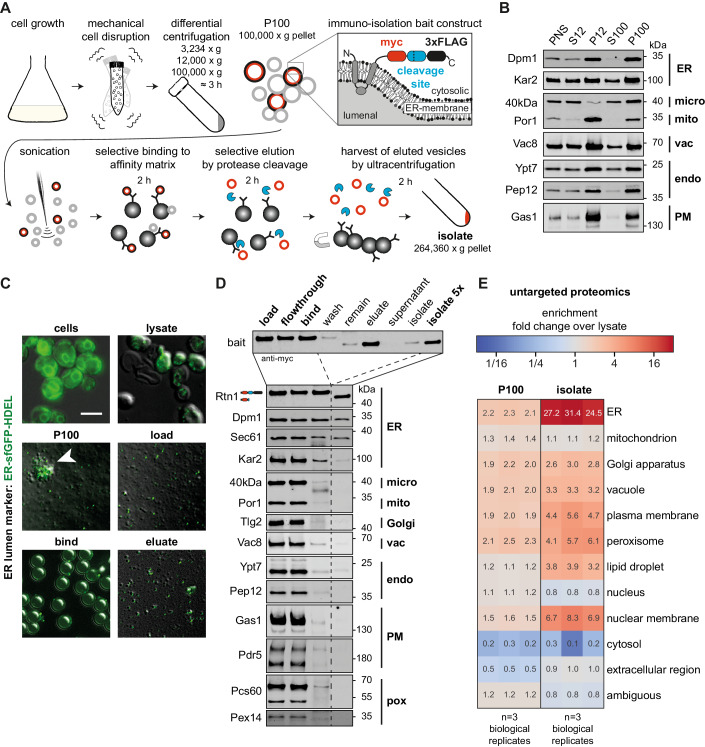
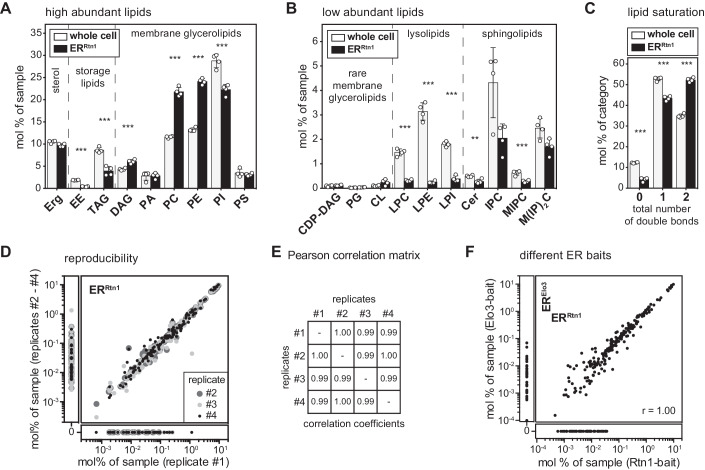
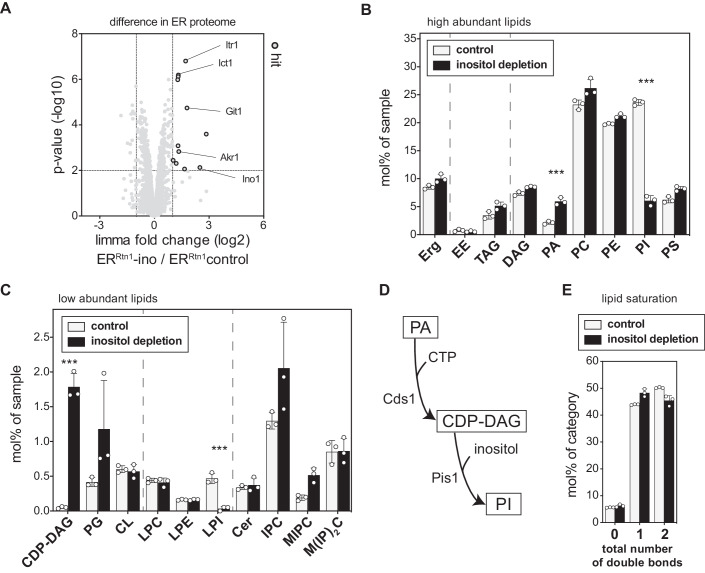
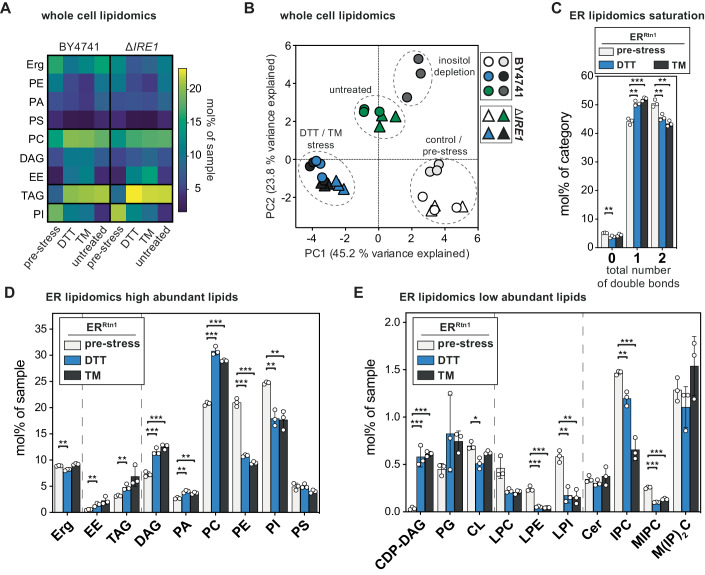
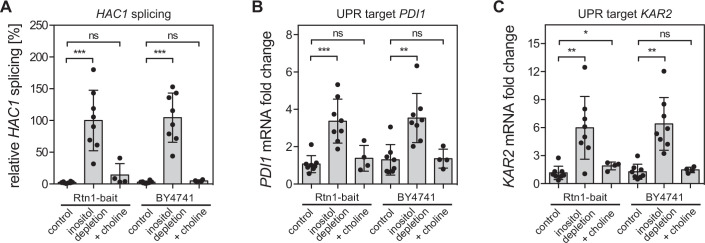
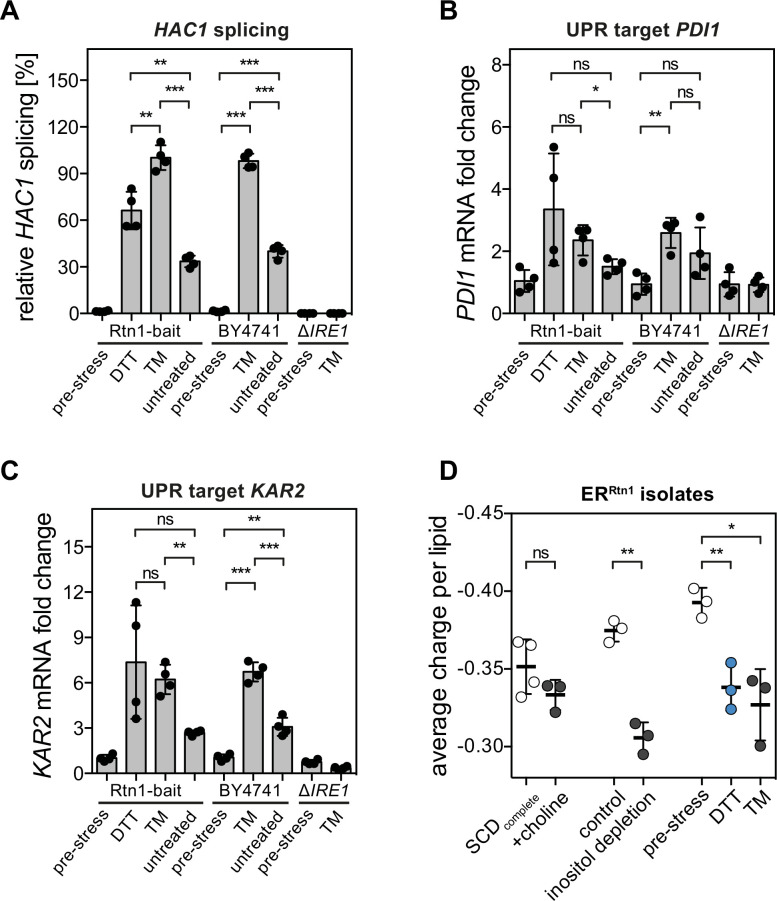
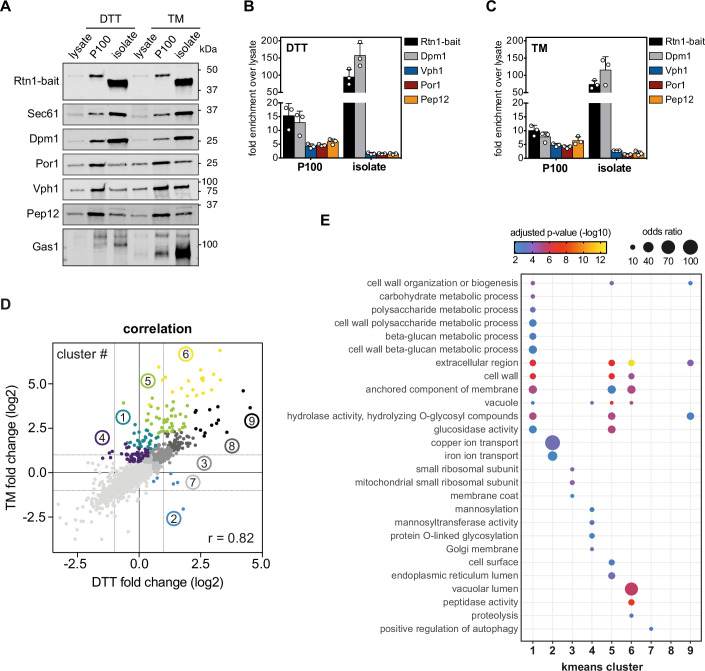
Biological membranes have a stunning ability to adapt their composition in response to physiological stress and metabolic challenges. Little is known how such perturbations affect individual organelles in eukaryotic cells. Pioneering work has provided insights into the subcellular distribution of lipids in the yeast Saccharomyces cerevisiae, but the composition of the endoplasmic reticulum (ER) membrane, which also crucially regulates lipid metabolism and the unfolded protein response, remains insufficiently characterized. Here, we describe a method for purifying organelle membranes from yeast, MemPrep. We demonstrate the purity of our ER membrane preparations by proteomics, and document the general utility of MemPrep by isolating vacuolar membranes. Quantitative lipidomics establishes the lipid composition of the ER and the vacuolar membrane. Our findings provide a baseline for studying membrane protein biogenesis and have important implications for understanding the role of lipids in regulating the unfolded protein response (UPR). The combined preparative and analytical MemPrep approach uncovers dynamic remodeling of ER membranes in stressed cells and establishes distinct molecular fingerprints of lipid bilayer stress.

Keywords: ER Stress; Lipid Bilayer Stress; MemPrep; Organelle Lipidomics; UPR.


Conflict of interest statement

CK declares competing financial interests related to the publication of this study, including being chief technology officer at Lipotype GmbH, Dresden. The remaining authors declare no competing interests.

Figures

Figure 1
Figure 1. Immunoisolation of the ER via MemPrep.
(A) Schematic representation of the immunoisolation protocol. Cells are cultivated in SCDcomplete medium and mechanically disrupted by vigorous shaking with zirconia/glass beads. Differential centrifugation at 3234 × g, 12,000 × g, and 100,000 × g yields crude microsomes in the P100 fraction originating from different organelles. The immunoisolation bait tag installed at the C-terminal end of Rtn1 is depicted in the inlay (myc-tag, human rhinovirus (HRV) 3C protease cleavage site, 3xFLAG tag). Sonication segregates clustered vesicles and decreases the vesicle size. ER-derived vesicles are specifically captured by anti-FLAG antibodies bound to Protein G on magnetic beads. After rigorous washing, the ER-derived vesicles are selectively eluted by cleaving the bait tag with the HRV3C protease (blue sectors). The eluted ER-derived vesicles (red circles) are harvested and concentrated by ultracentrifugation. (B) Distribution of the indicated organellar markers in the fractions of a differential centrifugation procedure: Supernatant after 3234 × g centrifugation (post nuclear supernatant, PNS), supernatant after 12,000 × g centrifugation (S12), pellet after 12,000 × g centrifugation (P12), supernatant after 100,000 × g centrifugation (S100), pellet after 100,000 × g centrifugation (P100). Dpm1 and Kar2 are ER markers, the 40 kDa protein (40 kDa) is a marker for light microsomes (Zinser et al, 1991), Por1 is a marker of the outer mitochondrial membrane, Vac8 is a vacuolar marker, Ypt7 and Pep12 mark endosomes, and Gas1 serves as plasma membrane marker. In total, 7.8 µg total protein loaded per lane. (C) Overlay of fluorescence micrographs and differential interference contrast images of cells expressing an ER-luminal marker (ER-sfGFP-HDEL) and fractions from immunoisolation. Intact cells (cells) show typical ER staining. Mechanical cell disruption leads to fragmentation and release of intracellular membranous organelles (lysate). The crude microsomal fraction (P100) contains aggregates of GFP-positive and GFP-negative vesicles (white arrowhead). Segregation by sonication yields more homogenous size distribution of vesicles (load). Individual ER-luminal marker containing vesicles are bound to the surface of much larger magnetic beads (bind). Selective elution by protease cleavage releases vesicles from the affinity matrix (eluate). Scale bar for all panels: 5 µm. (D) Immunoblot analysis of immunoisolation fractions for common organellar markers (ER endoplasmic reticulum, micro light microsomal fraction, mito mitochondria, Golgi Golgi apparatus, vac vacuole, endo endosomal system, PM plasma membrane, pox peroxisomes). Overall, 0.2% of each fraction loaded. (E) Untargeted protein mass spectrometry analysis showing enrichment of P100 and isolate fractions over whole-cell lysate. The enrichment of proteins over the cell lysate (fold change) is based on uniquely annotated subcellular locations and provided for each biological replicate. The illustrated numbers represent the median enrichment for unique annotated genes from n = 3 biological replicates. Source data are available online for this figure.
Figure 2
Figure 2. Lipid composition of the ER membrane of S. cerevisiae determined by MemPrep via Rtn1-bait.
SCDcomplete medium was inoculated to an OD600 of 0.1 using stationary overnight cultures of cells expressing the bait protein. Cells were cultivated to an OD600 of 1.0, harvested, frozen, stored, thawed, and then subjected to the MemPrep procedure. (A) Quantitative lipidomics reveals the lipid class composition given as mol% of all identified lipids in the sample. Classes are categorized into sterol (Erg ergosterol), storage lipids (EE ergosteryl ester, TAG triacylglycerol), membrane glycerolipids (DAG diacylglycerol, PA phosphatidic acid, PC phosphatidylcholine, PE phosphatidylethanolamine, PI phosphatidylinositol, PS phosphatidylserine) (n = 4 biological replicates). (B) Lipid class composition of rare membrane glycerolipids (CDP-DAG cytidine diphosphate diacylglycerol, PG phosphatidylglycerol, CL cardiolipin), lysolipids (LPC lyso-phosphatidylcholine, LPE lyso-phosphatidylethanolamine, LPI lyso-phosphatidylinositol), and sphingolipids (Cer ceramide, IPC inositolphosphorylceramide, MIPC mannosyl-IPC, M(IP)2C mannosyl-di-IPC) given as mol% of all lipids in the sample (n = 4 biological replicates). (C) The total number of double bonds in membrane glycerolipids except for CL (i.e. CDP-DAG, DAG, PA, PC, PE, PG, PI, PS) as mol% of this category (n = 4 biological replicates). % (D) Reproducibility of immuno-isolated ER lipidome data shown as the correlation of mol% of sample values of all detected lipid species between replicate 1 and replicates 2–4. (E) Pearson correlation coefficients of lipidomics data for all combinations of replicate samples. (F) Correlation of mol% of sample values of all detected lipid species from Rtn1-bait and Elo3-bait derived ER membranes. Data information: Data from n = 4 biological replicates in (AC) are presented as individual data points and as mean ± SD. **P ≤ 0.01, ***P ≤ 0.001 (multiple t tests, corrected for multiple comparisons using the method of Benjamini, Krieger, and Yekutieli, with Q = 1%, without assuming consistent SD). Nonsignificant comparisons are not highlighted. Source data for this figure are available online.
Figure 3
Figure 3. Molecular fingerprints of lipid bilayer stress.
SCDcomplete medium was inoculated with Rtn1-bait cells to an OD600 of 0.003 from an overnight pre-culture and grown to an OD600 of 1.2. Cells were washed with inositol-free medium and then cultivated for an additional 2 h in either inositol-free (inositol depletion) or SCDcomplete medium (control) starting with an OD600 of 0.6. Note that the culturing conditions for the unstressed control was different from that used to determine the steady-state ER lipid composition in Fig. 2. ER-derived membranes were purified by differential centrifugation and immunoisolation and subsequently analyzed by TMT-labeling proteomics or quantitative shotgun lipidomics. (A) To increase the proteomics coverage for membrane proteins, P100 membranes were carbonate-washed before performing immunoisolation. Limma analysis of TMT-labeling proteomics. Highlighted are proteins that are more abundant in ER samples upon lipid bilayer stress by inositol depletion (ERRtn1-ino). (B) Lipid class composition given as mol% of all lipids in the sample. Erg ergosterol, EE ergosteryl ester, TAG triacylglycerol, DAG diacylglycerol, PA phosphatidic acid, PC phosphatidylcholine, PE phosphatidylethanolamine, PI phosphatidylinositol, PS phosphatidylserine (n = 3 biological replicates). (C) Class distribution of low abundant lipids CDP-DAG cytidine diphosphate diacylglycerol, PG phosphatidylglycerol, CL cardiolipin, LPC lyso-phosphatidylcholine, LPE lyso-phosphatidylethanolamine, LPI lyso-phosphatidylinositol, Cer ceramide, IPC inositolphosphorylceramide, MIPC mannosyl-IPC, M(IP)2C mannosyl-di-IPC (n = 3 biological replicates). (D) Lipid metabolic pathway of PI biogenesis. (E) The total number of double bonds in membrane glycerolipids (except CL which has four acyl chains) as mol% of this category (n = 3 biological replicates). Data information: Data from n = 3 biological replicates in (A) are presented as the mean. We used the moderated t-test limma to test for differential enrichment. P values were corrected for multiple testing with the method from Benjamini and Hochberg. The data from three biological replicates are presented as individual points in (B, C, E) and as the mean ± SD. ***P ≤ 0.001 (multiple t tests, corrected for multiple comparisons using the method of Benjamini, Krieger, and Yekutieli, with Q = 1%, without assuming consistent SD). Nonsignificant comparisons are not highlighted. Source data are available online for this figure.
Figure 4
Figure 4. ER stress induced by DTT and TM manifests in a distinct lipid fingerprint on the whole cell and ER level.
(A) SCDcomplete medium was inoculated with BY4741 wild-type or ΔIRE1 cells to an OD600 of 0.1 from an overnight pre-culture. Cells were grown to an OD600 of 0.8 and then stressed by the addition of either 2 mM DTT or 1.5 µg/ml TM or left untreated for 4 h. The lipidome of whole cells was determined by quantitative shotgun mass spectrometry. Mean abundance from three biologically independent replicates is shown as mol% of all lipid classes identified in the sample. Only classes with significant changes are shown and clustered by their abundance pattern. Erg, PE, PA, PS are decreased in DTT- and TM-stressed cells. PC, DAG, EE are increased in stressed cells. TAG increases in all three conditions (DTT/TM stress, untreated). PI is slightly decreased in DTT- and TM-stressed cells and strongly decreased in untreated cells. (B) Principal component analysis (PCA) of whole-cell lipidomics data from wild-type (BY4741, circles) and ΔIRE1 (triangles) cells. Cells were subjected to prolonged proteotoxic stress by DTT or TM or left untreated. PCA includes whole-cell lipidomes of direct lipid bilayer stress by inositol depletion. Lipidomes of DTT and TM stress cluster together, indicating a high degree of similarity. Lipidomes of untreated cells form a distinct cluster different from pre-stressed and DTT- or TM-stressed conditions. Lipidomes of inositol depletion form a distinct cluster, the respective control condition is close to the pre-stress cluster. Cells for inositol depletion were grown as described in Fig. 3. Interestingly, lipidomes of ΔIRE1 cells cluster with their respective wild-type counterparts, indicating little influence of UPR activity on the cellular lipidome under these conditions. (C) Rtn1-bait cells were grown as described for (A). ER-derived membranes were purified by MemPrep and subsequently analyzed by quantitative shotgun lipid mass spectrometry. Total number of double bonds in membrane glycerolipids (without CL) given as mol% of this category (n = 3 biological replicates). (D) Lipid class distribution of sterol, storage lipids and abundant membrane glycerolipids in ER-derived vesicles from cells that were either challenged with 2 mM dithiothreitol (DTT) or 1.5 µg/ml TM for 4 h. The ER lipidome undergoes significant remodeling upon ER stress (n = 3 biological replicates). (E) Lipid class distribution of rare membrane glycerolipids, lysolipids, and sphingolipids (n = 3 biological replicates). Data information: Data from n = 3 biological replicates in (A) are shown as the mean. Data from n = 3 biological replicates in (CE) are presented as individual data points and as the mean ± SD. *P ≤ 0.05, **P ≤ 0.01, ***P ≤ 0.001 (multiple t tests, corrected for multiple comparisons using the method of Benjamini, Krieger, and Yekutieli, with Q = 1%, without assuming consistent SD). Nonsignificant comparisons are not highlighted. Source data are available online for this figure.
Figure 5
Figure 5. The proteome of the ER under conditions of prolonged proteotoxic stress.
ER-derived vesicles were isolated by MemPrep and subsequently analyzed by untargeted proteomics. An additional sodium carbonate wash step was performed on P100 to remove soluble proteins from the membrane preparation. (A) Limma analysis identified proteins that are accumulating in ER preparations after prolonged DTT-induced stress (top right quadrant of volcano plot). Proteins that are discussed in the text are indicated. The enrichment of proteins in preparations of the stressed ER membrane was considered significantly when they were at least twofold enriched compared to their abundance in pre-stress conditions with a P value < 0.01 (n = 3 biological replicates). (B) Limma analysis showing proteins that are accumulating in the ER upon prolonged TM-induced ER stress (top right quadrant of volcano plot). All proteins discussed in the text are labeled. The enrichment of proteins in the preparations of the stressed ER was considered significant when they were enriched at least twofold compared to their abundance in pre-stress conditions with a P value < 0.01 (n = 3 biological replicates). (C) Enriched gene ontology terms (GO terms) in the list of enriched proteins. GO terms are grouped by categories, FDR < 1% (n = 3 biological replicates). Data information: Data in (A, B) are presented as the mean from three biological replicates. We used the moderated t-test limma to test for differential enrichment. P values were corrected for multiple testing with the method from Benjamini and Hochberg. Data in (C) presented as mean from three biological replicates. P values were derived from a Fisher-test and corrected for multiple testing with the method of Benjamini and Hochberg. Source data are available online for this figure.
Figure 6
Figure 6. Lipid composition after MemPrep of the vacuolar membrane.
(A) Immunoblot analysis of fractions after immunoisolation via a vacuolar bait protein (Vph1-bait). Common organellar markers are shown: ER, endoplasmic reticulum (Dpm1 and Kar2); micro, microsomal fraction (40 kDa); mito, mitochondria (Por1); vac, vacuole (Vac8); endo, endosomal system (Ypt7 and Pep12); PM, plasma membrane (Gas1 and Pdr5); pox, peroxisomes (Pcs60 and Pex14). 0.2% of each fraction loaded per lane. (B) Untargeted protein mass spectrometry analysis showing enrichment of P100 and isolate fractions over whole-cell lysate. The enrichment of proteins over the cell lysate (fold change) is based on uniquely annotated subcellular locations and provided for each of n = 3 biological replicates. The illustrated numbers represent the median enrichment for each biological replicate. (C) Lipid class composition given as mol% of all lipids in the sample. Classes are categorized into sterol (Erg ergosterol), storage lipids (EE ergosteryl ester, TAG triacylglycerol), membrane glycerolipids (DAG diacylglycerol, PA phosphatidic acid, PC phosphatidylcholine, PE phosphatidylethanolamine, PI phosphatidylinositol, PS phosphatidylserine). Whole-cell lipid data are identical with the data presented in Fig. 2A,B (n = 4 biological replicates for whole cell; n = 3 biological replicates for vacuoleVph1). (D) Continuation of lipid class composition given as mol% of all lipids in the sample. Classes are categorized into rare membrane glycerolipids (CDP-DAG cytidine diphosphate diacylglycerol, PG phosphatidylglycerol, CL cardiolipin), lysolipids (LPC lyso-phosphatidylcholine, LPE lyso-phosphatidylethanolamine, LPI lyso-phosphatidylinositol) and sphingolipids (Cer ceramide, IPC inositolphosphorylceramide, MIPC mannosyl-IPC, M(IP)2C mannosyl-di-IPC). Whole-cell lipid data are identical with the data presented in Fig. 2B. Data information: Data in (B) are presented as the median enrichment of uniquely annotated genes for n = 3 biological replicates. Data in (C, D) are presented as individual data points and the mean ± SD. **P ≤ 0.01, ***P ≤ 0.001 (multiple t tests, corrected for multiple comparisons using the method of Benjamini, Krieger, and Yekutieli, with Q = 1%, without assuming consistent SD). Nonsignificant comparisons are not highlighted. Source data are available online for this figure.
Figure EV1
Figure EV1. ER MemPrep via two different bait proteins.
(A) Immunofluorescence showing the localization of two different ER membrane bait proteins (Rtn1-bait, Elo3-bait) relative to the ER-luminal marker ER-sfGFP-HDEL. Scale bar indicates 5 µm. Quantification of fluorescence distribution. Cell and nuclear areas were chosen manually. Cortical area was defined as total cellular area minus nuclear area. The ER-luminal marker ER-sfGFP-HDEL shows the same cortical-to-nuclear distribution in both bait strains. Rtn1-bait has a stronger preference for the cortical ER, compared to Elo3-bait. n = 7 cells for Rtn1-bait, n = 14 cells for Elo3-bait Data from individual cells are represented as data points yielding the average ± SD. nsP > 0.05, **P ≤ 0.01 (unpaired parametric t test with Welch’s correction). (B) Limma analysis of TMT-labeling proteomics reveals that the proteome of Rtn1-bait and Elo3-bait whole-cell lysates is identical except for a single outlier (Sbh2) (n = 3 biological replicates). (C) To increase the proteomics coverage for membrane proteins, P100 membranes were carbonate-washed before performing immunoisolation. MemPrep via Rtn1-bait enriches ER membrane proteins in the isolate (ERRtn1) (n = 3 biological replicates). (D) ER membrane proteins are enriched to the same extent by MemPrep via the bait protein Elo3-bait (n = 3 biological replicates). (E) MemPrep via Rtn1-bait and Elo3-bait yields almost identical sample composition with only 12 proteins that are enriched in the Elo3-bait derived ER. Data information: Data in (BE) are presented as the mean from n = 3 biological replicates. A moderated t-test limma to test for differential enrichment was used. P values were corrected for multiple testing with the method from Benjamini and Hochberg. Source data are available online for this figure.
Figure EV2
Figure EV2. The lipidome of Rtn1-bait and Elo3-bait derived ER membranes is identical.
Quantitative lipidomics of ER membranes derived via two different bait proteins. (A) Distribution of lipid classes with high abundance. Erg ergosterol, EE ergosteryl ester, TAG triacylglycerol, DAG diacylglycerol, PA phosphatidic acid, PC phosphatidylcholine, PE phosphatidylethanolamine, PI phosphatidylinositol, PS phosphatidylserine (n = 4 biological replicates). (B) Distribution of lipid classes with low abundance. CDP-DAG cytidine diphosphate diacylglycerol, PG phosphatidylglycerol, CL cardiolipin, LPC lyso-phosphatidylcholine, LPE lyso-phosphatidylethanolamine, LPI lyso-phosphatidylinositol, Cer ceramide, IPC inositolphosphorylceramide, MIPC mannosyl-IPC, M(IP)2C mannosyl-di-IPC (n = 4 biological replicates). (C) Total number of double bonds in membrane glycerolipids, except for CL, (i.e., CDP-DAG, DAG, PA, PC, PE, PG, PI, PS) as mol% of this category. Lipid data of Rtn1-bait derived membranes are identical with the data presented in Fig. 2A–C. Data information: In (AC), data from n = 4 biological replicates are presented as individual data points and as mean ± SD. All differences of ERRtn1 versus ERElo3 were nonsignificant with P > 0.05 (multiple t tests, corrected for multiple comparisons using the method of Benjamini, Krieger and Yekutieli, with Q = 1%, without assuming consistent SD). Nonsignificant comparisons are not highlighted. Source data are available online for this figure.
Figure EV3
Figure EV3. Activation of the UPR by lipid bilayer stress.
SCDcomplete medium was inoculated with Rtn1-bait cells to an OD600 of 0.003 from an overnight pre-culture and grown to an OD600 of 1.2. Cells were washed with inositol-free medium and then cultivated for an additional 2 h in either inositol-free (inositol depletion) or SCDcomplete medium (control) starting with an OD600 of 0.6. Another perturbation of lipid metabolism was achieved by addition of choline. For ‘+choline’ conditions, SCDcomplete medium was inoculated to an OD600 of 0.1 using stationary overnight cultures. Cells were then cultivated to an OD600 of 1.0 in the presence of 2 mM choline. (A) UPR activation was measured by determining the levels of spliced HAC1 mRNA. Data for relative HAC1 splicing was normalized to the inositol depletion Rtn1-bait condition (n = 8 biological replicates based on two technical replicates for Rtn1-bait control, Rtn1-bait inositol depletion, BY4741 control and BY4741 inositol depletion, but n = 4 biological replicates based on two technical replicates for Rtn1-bait + choline and BY4741 + choline). (B) mRNA upregulation of the downstream UPR target gene PDI. PDI mRNA fold change was calculated as 2-ΔΔCt and normalized to Rtn1-bait control condition (n = 8 biological replicates based on two technical replicates for the Rtn1-bait control, Rtn1-bait inositol depletion, BY4741 control, and BY4741 inositol depletion, but n = 4 biological replicates based on two technical replicates for Rtn1-bait + choline and BY4741 + choline). (C) Upregulation of mRNA of the downstream UPR target gene KAR2 calculated as 2-ΔΔCt and normalized to Rtn1-bait control condition (n = 8 biological replicates based each on two technical replicates for Rtn1-bait control, Rtn1-bait inositol depletion, BY4741 control, and BY4741 inositol depletion, but n = 4 biological replicates based on two technical replicates for Rtn1-bait + choline and BY4741 + choline). Data information: All data from biological replicates are presented in (AC) as individual data points with the mean ± SD. nsP > 0.05, *P ≤ 0.05, **P ≤ 0.01, ***P ≤ 0.001 (unpaired parametric t test with Welch’s correction). Nonsignificant comparisons are not highlighted. Source data are available online for this figure.
Figure EV4
Figure EV4. Activation of the UPR upon prolonged proteotoxic stress.
Cells were grown as described above. UPR activation was measured by determining the levels of (A) spliced HAC1 mRNA and the mRNA of the downstream UPR target gene (n = 4 biological replicates based on two technical replicates) (B) PDI (n = 4 biological replicates based on two technical replicates) and (C) KAR2 before and after 4 h of DTT or TM treatment (n = 4 biological replicates based on two technical replicates). Data for relative HAC1 splicing was normalized to the TM-treated Rtn1-bait condition. PDI and KAR2 mRNA fold changes were calculated as 2-ΔΔCt and normalized to Rtn1-bait pre-stress. (D) Calculation of the average charge per lipid from ER lipidomics data shown in Appendix Fig. S3A,B (SCDcomplete, +choline), Fig. 3B,C (control, inositol depletion), and Fig. 4D,E (pre-stress, DTT, TM). Conditions with active UPR show reduced negative lipid charges compared to their respective controls. Net charges of the lipid classes were considered as follows: Erg 0, EE 0, TAG 0, DAG 0, PA -1, PC 0, PE 0, PI -1, PS -1, CDP-DAG -2, PG -1, CL -2, Cer 0, IPC -1, MIPC -1, M(IP)2C-2 (n = 4 biological replicates for SCDcomplete and n = 3 biological replicates for all other conditions). Data information: All data are presented as individual data points and the mean ± SD. nsP > 0.05, *P ≤ 0.05, **P ≤ 0.01, ***P ≤ 0.001 (unpaired parametric t test with Welch’s correction). Source data are available online for this figure.
Figure EV5
Figure EV5. Enrichment of stressed ER membranes by MemPrep.
(A) Immunoblot analysis of the indicated organellar markers in whole-cell lysates (lysate), crude membranes (P100), and MemPrep isolates (isolate). ER membranes were immuno-isolated via the Rtn1-bait protein. Sec61 and Dpm1 are prototypical ER membrane markers. Por1 is a marker for the outer mitochondrial membrane, Vph1 is a vacuolar marker. Pep12 marks endosomes and Gas1 serves as plasma membrane marker. 1 µg total protein loaded per lane. (B) Quantification of the organelle markers Dpm1, Vph1, Por1, Pep12 and the Rtn1-bait protein from three immunoblots of independent replicate ER MemPreps after prolonged proteotoxic stress induced by DTT (n = 3 biological replicates). (C) Quantification of three immunoblots from independent replicate ER MemPreps after prolonged proteotoxic stress induced by TM. Error bars indicate standard deviations (n = 3 biological replicates). (D) Correlation of DTT- and TM-induced fold changes, after Limma analysis, over pre-stress with a Pearson correlation coefficient r = 0.82. K-means clusters are indicated by colored groups and their respective cluster number (n = 3 biological replicates). (E) Gene ontology term enrichments in K-means clusters (n = 3 biological replicates). Data information: Data in (B, C), data from three biological replicates are presented as individual data points and as the mean ± SD. Data in (E) from n = 3 biological replicates are presented as the mean. P values were derived from a Fisher-test and corrected for multiple testing with the method of Benjamini and Hochberg. Source data are available online for this figure.

References

    1. Abu-Remaileh M, Wyant GA, Kim C, Laqtom NN, Abbasi M, Chan SH, Freinkman E, Sabatini DM. Lysosomal metabolomics reveals V-ATPase- and mTOR-dependent regulation of amino acid efflux from lysosomes. Science. 2017;358:807–813. doi: 10.1126/science.aan6298. - DOI - PMC - PubMed
    1. Aguilera-Romero A, Kaminska J, Spang A, Riezman H, Muñiz M. The yeast p24 complex is required for the formation of COPI retrograde transport vesicles from the Golgi apparatus. J Cell Biol. 2008;180:713–720. doi: 10.1083/jcb.200710025. - DOI - PMC - PubMed
    1. Ballweg S, Sezgin E, Doktorova M, Covino R, Reinhard J, Wunnicke D, Hänelt I, Levental I, Hummer G, Ernst R. Regulation of lipid saturation without sensing membrane fluidity. Nat Commun. 2020;11:756. doi: 10.1038/s41467-020-14528-1. - DOI - PMC - PubMed
    1. Berendsen HJC, Postma JPM, Van Gunsteren WF, Dinola A, Haak JR. Molecular dynamics with coupling to an external bath. J Chem Phys. 1984;81:3684–3690. doi: 10.1063/1.448118. - DOI
    1. Best RB, Zhu X, Shim J, Lopes PEM, Mittal J, Feig M, Mackerell AD. Optimization of the additive CHARMM all-atom protein force field targeting improved sampling of the backbone φ, ψ and side-chain χ(1) and χ(2) dihedral angles. J Chem Theory Comput. 2012;8:3257–3273. doi: 10.1021/ct300400x. - DOI - PMC - PubMed

MeSH terms

Substances