. 2024 Apr;25(4):1752-1772.
doi: 10.1038/s44319-024-00097-7. Epub 2024 Mar 15.

Appropriate glycemic management protects the germline but not the uterine environment in hyperglycemia

Affiliations

Appropriate glycemic management protects the germline but not the uterine environment in hyperglycemia

Allan Zhao et al. EMBO Rep. 2024 Apr.

Abstract

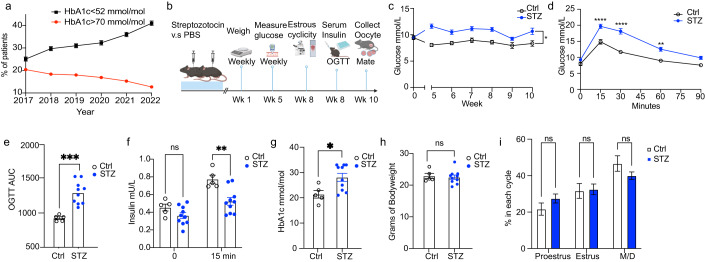
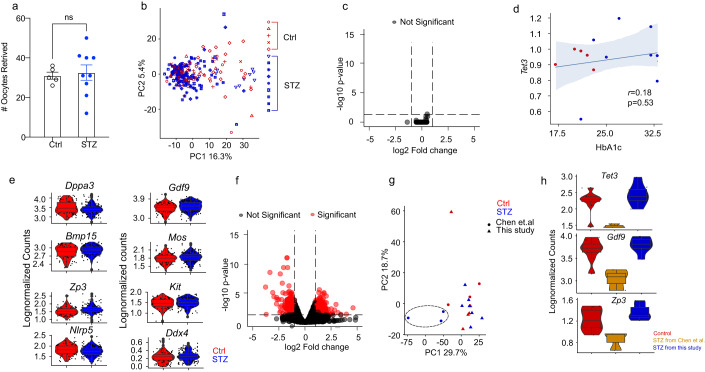
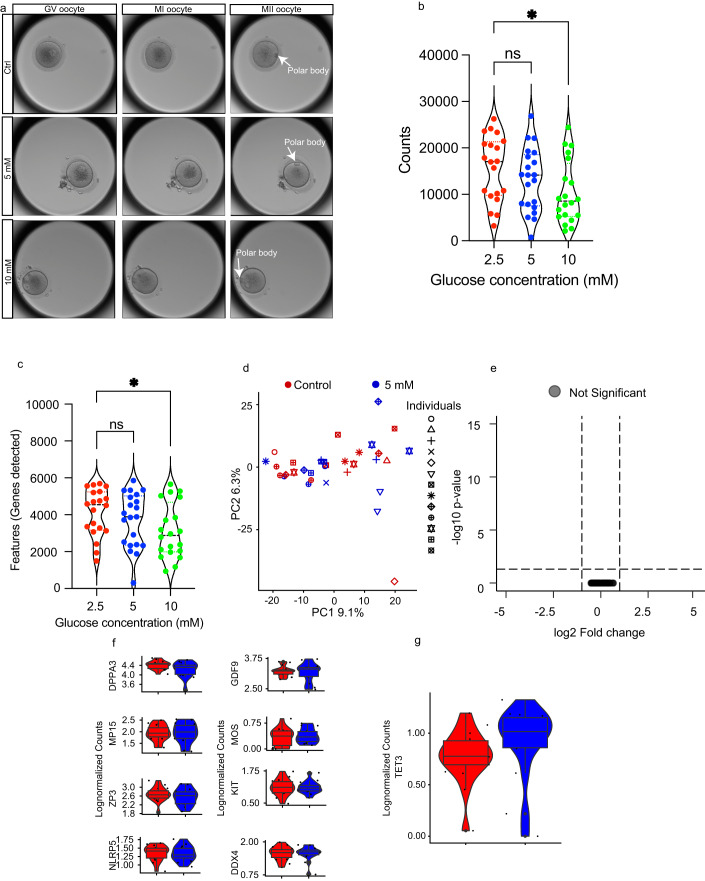
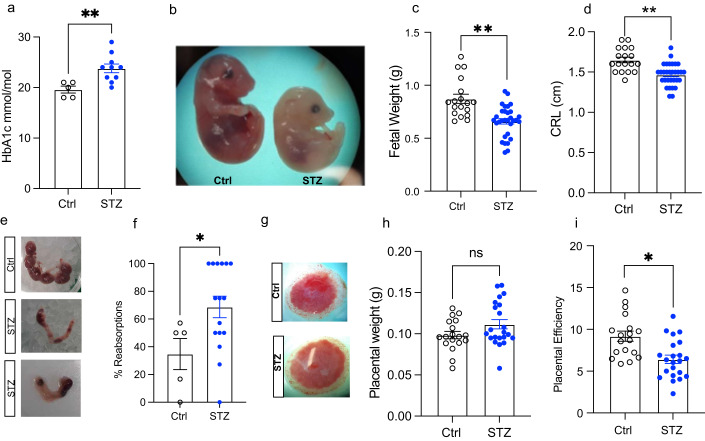
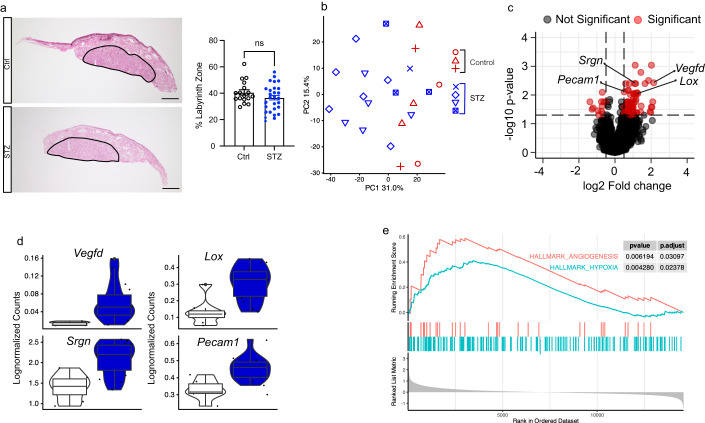
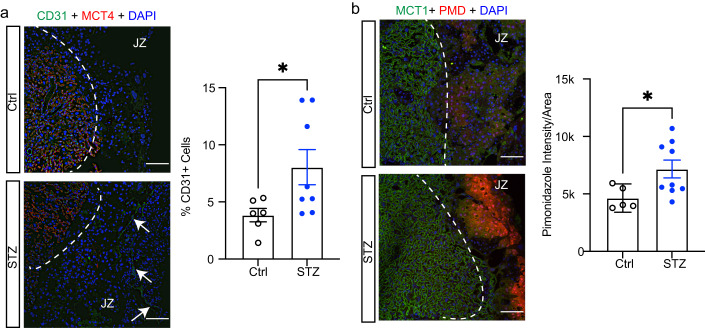
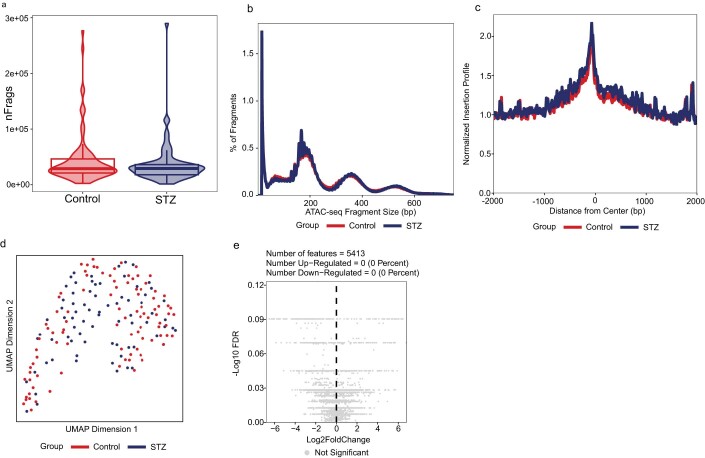
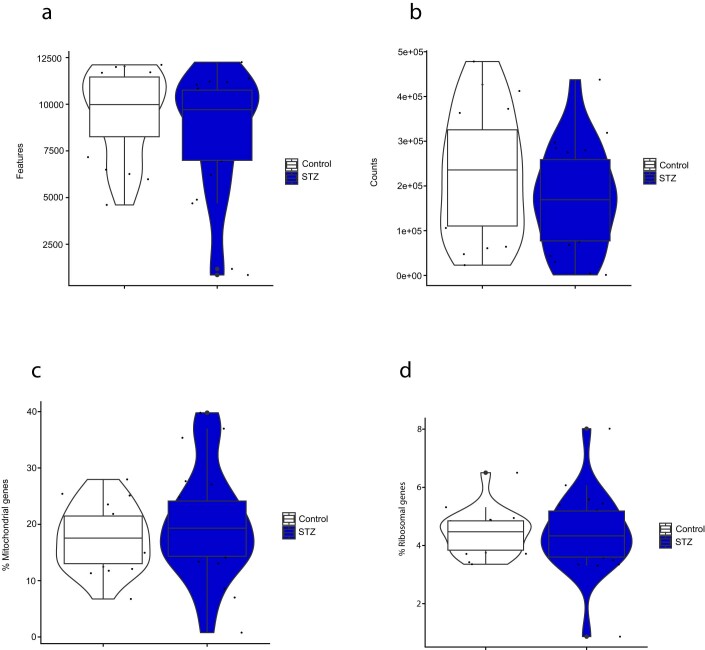
Emerging evidence indicates that parental diseases can impact the health of subsequent generations through epigenetic inheritance. Recently, it was shown that maternal diabetes alters the metaphase II oocyte transcriptome, causing metabolic dysfunction in offspring. However, type 1 diabetes (T1D) mouse models frequently utilized in previous studies may be subject to several confounding factors due to severe hyperglycemia. This limits clinical translatability given improvements in glycemic control for T1D subjects. Here, we optimize a T1D mouse model to investigate the effects of appropriately managed maternal glycemic levels on oocytes and intrauterine development. We show that diabetic mice with appropriate glycemic control exhibit better long-term health, including maintenance of the oocyte transcriptome and chromatin accessibility. We further show that human oocytes undergoing in vitro maturation challenged with mildly increased levels of glucose, reflecting appropriate glycemic management, also retain their transcriptome. However, fetal growth and placental function are affected in mice despite appropriate glycemic control, suggesting the uterine environment rather than the germline as a pathological factor in developmental programming in appropriately managed diabetes.

Keywords: Developmental Programming; Diabetes; Fetal Development; Hypoxia; Placenta.


Conflict of interest statement

The authors declare no competing interests.

Figures

Figure 1
Figure 1. Phenotyping of a model of appropriately managed type 1 diabetes.
(A) Trends in glycemic control for all women of reproductive age (18–45 years of age, n = 9771 2017, n = 9951 2018, n = 9983 2019, n = 9536 2020, n = 9964 2021, n = 10129 2022) with a type 1 diabetes diagnosis in Sweden between 2017 and 2022. Red color indicates percentage (%) of patients with bad glycemic control (HbA1c > 70 mmol/mol). Black color indicates percentage (%) of patients with good glycemic control (HbA1c < 52 mmol/mol). (B) Schematic for mouse experiment of optimized STZ model. (C) Trends of morning blood glucose levels in Control and STZ groups over the time course of the experiment. (D) Blood glucose levels at different timepoints during an oral glucose tolerance test (OGTT). (E) Glucose area under the curve (AUC) from the OGTT experiment in (C). (F) Serum insulin levels at 0 and 15 min timepoints from OGTT experiment in (B). (G) HbA1c levels 10 weeks after induction. (H) Body weight of mice 10 weeks after STZ exposure. (I) Time spent in every phase of estrous cyclicity. STZ, Streptozotocin; HbA1c, glycated hemoglobin; M/D, Metestrus/Diestrus. Data information: Data depicted here is in biological replicates. In panels (CI), data is presented as mean ± SEM. In panel (C), data was analyzed using 2-way ANOVA. In panels (D), (F) and (I), data was analyzed using two-way ANOVA with Bonferroni’s post hoc test. In panels (E), (G) and (H), data was analyzed using Student’s t-test. *P < 0.05, ***P < 0.001; ****P < 0.0001 (n = 5 for control mice, n = 10 for STZ mice for panels (CI)). Source data are available online for this figure.
Figure 2
Figure 2. Mouse oocyte analyses.
(A) Number of oocytes retrieved after superovulation from Control (n = 5) and STZ (n = 9) mice. (B) Principal component analysis (PCA) plot of control and STZ oocytes analyzed, also depicting the mouse that the oocyte was obtained from. (C) Volcano plot displaying no differentially expressed genes between Control and STZ oocytes (5 control animals, n = 81 oocytes; 9 STZ animals, n = 149 oocytes). (D) Correlation between Tet3 levels and HbA1c levels in oocytes obtained from Control and STZ mice. (E) Violin plots depicting lognormalized readcounts of oocyte-specific genes. (5 control animals, n = 81 oocytes; 9 STZ animals, n = 149 oocytes). (F) Re-analysis of public transcriptomic data from Chen et al comparing oocytes from poorly managed diabetes and controls (n = 3 control minibulk samples, n = 3 STZ minibulk samples). (G) PCA plot after integration of data from this study and data from Chen et al, comparing oocytes from poorly managed and appropriately managed diabetes with controls. (H) Violin plots depicting genes downregulated in severe STZ model and retained in mild STZ model (n = 8 control samples, n = 3 severe STZ samples, n = 7 mild STZ samples). Data information: Data depicted here is in biological replicates. In panel (A), data is depicted as mean ± SEM and was analyzed using Student’s t-test. In panel (C), data was analyzed using MAST. In panel (F), data was analyzed using Wald test in DESeq2. In panel (D), data was analyzed using a linear regression model. For boxplots in panels e and h, the lower and upper hinges of the box depict the 1st and 3rd quartiles, and the middle line depicts the median. The upper and lower whiskers extend to the largest or smallest value no further than 1.5 times the interquartile range (1.5*IQR) from the hinge. Data beyond the end of the whiskers are plotted as a larger dot, which are then the minimum and/or maximum values depicted. If no large dots are present, the whiskers extend to the minimum and/or maximum values. Source data are available online for this figure.
Figure 3
Figure 3. Human oocyte analyses.
(A) Representative images for in vitro maturation of oocyte in control (2.5 mM), 5 mM, and 10 mM conditions. Images show the same oocyte in GV (germinal vesicle), MI (Metaphase I), and MII (Metaphase II) stage during maturation. (B) Number of counts (UMIs) for every cell for MII oocytes (n = 20 for 2.5 mM, n = 21 for 5 mM, n = 20 for 10 mM) (C) number of genes/features detected per cell for MII oocytes. (D) PCA plot of oocytes cultured in control (2.5 mM) and mildly diabetic (5 mM) conditions (n = 20 for 2.5 mM, n = 21 for 5 mM, n = 20 for 10 mM). (E) Volcano plot displaying no differentially expressed genes between oocytes undergoing IVM in control and mildly diabetic conditions. (F) Violin plots depicting oocyte-specific genes. (n = 17 control oocytes, n = 16 5 mM oocytes). (G) Violin plot depicting TET3 levels in human oocytes (n = 17 control oocytes, n = 16 5 mM oocytes). UMI, Unique Molecular Identifier. Data information: Data depicted here is in biological replicates. In panels (B) and (C), data was analyzed using one-way ANOVA with Bonferroni’s post hoc test. In panel e, data was analyzed using MAST. For boxplots in panels (F) and (G), the lower and upper hinges of the box depict the 1st and 3rd quartiles, and the middle line depicts the median. The upper and lower whiskers extend to the largest or smallest value no further than 1.5 times the interquartile range (1.5*IQR) from the hinge. Data beyond the end of the whiskers are plotted as a larger dot, which are then the minimum and/or maximum values depicted. If no large dots are present, the whiskers extend to the minimum and/or maximum values. *P < 0.05. Source data are available online for this figure.
Figure 4
Figure 4. Mouse fetal development study.
(A) HbA1c levels at end of experiment (n = 5 control mice, n = 10 STZ mice). (B) Representative image for Control (left) and STZ (right) embryo. (C) Embryo weight of embryos derived from Control (n = 18) and STZ (n = 31) mice. (D) Crown-rump length (CRL) of control (n = 18) and STZ (n = 31) embryos at E18.5. (E) Representative images of uteruses at E18.5. Uterus with no reabsorption (top, Control) and with several both early and late reabsorptions (middle and bottom, STZ). (F) Percentage of embryos reabsorbed at E18.5 (n = 5 control and n = 16 STZ). (G) Representative images for placentas at E18.5. (H) Placental weight from control (n = 18) and STZ (n = 22) fetuses at E18.5. (I) Placental efficiency of control (n = 18) and STZ (n = 22) placentas linked to embryos depicted in (B). STZ, Streptozotocin; HbA1c, glycated hemoglobin; CRL, Crown-rump length. Data information: Data depicted is biological replicates. In panels (A, C, D, F, H, I), data is depicted as mean ± SEM. In panels (A) and (F), data was analyzed using Student’s t-test. In panels (C), (D), (H) and (I) data were analyzed using analysis of covariance (ANCOVA) to correct for litter size. *P < 0.05, **P < 0.01. Source data are available online for this figure.
Figure 5
Figure 5. Histological and transcriptomic analysis of placentas.
(A) Hematoxylin and erythrosine staining with representative images and quantification analyzing labyrinth zone size in control (n = 17) and STZ (n = 30) placenta. Scale bar: 800 μm. (B) Principal component analysis (PCA) plot of control (n = 8) and STZ (n = 14) placenta RNAseq, symbols depicting which placentas belong to the same maternal mouse. (C) Volcano plot depicting results of differential expression analysis between control (n = 8) and STZ (n = 14) placentas. (D) Violin plots depicting individual gene expression of genes highlighted in (C)) in control (n = 8) and STZ (n = 14) placentas. (E) Enrichment plots of the hallmark Angiogenesis and Hypoxia gene sets generated by GSEA comparing control (n = 8) and STZ (n = 14) placentas. STZ, Streptozotocin; PCA, principal component analysis; GSEA, gene set enrichment analysis. Data information: Data depicted is biological replicates. For panel (A), data is depicted as mean ± SEM and was analyzed using Student’s t-test. For panel (C), data was analyzed using Wald test in DESeq2. For boxplots in panel (D), the lower and upper hinges of the box depict the 1st and 3rd quartiles, and the middle line depicts the median. The upper and lower whiskers extend to the largest or smallest value no further than 1.5 times the interquartile range (1.5*IQR) from the hinge. Data beyond the end of the whiskers are plotted as a larger dot, which are then the minimum and/or maximum values depicted. If no large dots are present, the whiskers extend to the minimum and/or maximum values. *P < 0.05. Source data are available online for this figure.
Figure 6
Figure 6. Confirmation of hypoxia and angiogenesis using immunohistochemistry in placentas.
(A) Fluorescent immunohistochemistry with representative images and quantification analyzing control (n = 6) and STZ (n = 8) placenta stained with CD31 (green, endothelial cell marker), MCT4 (red, placenta labyrinth zone marker) and DAPI (blue, nuclear staining). White arrows point towards CD31-positive staining in placenta. Scale bar: 100 μm. (B) Fluorescent immunohistochemistry with representative images and quantification analyzing control (n = 5) and STZ (n = 9) placenta stained with Pimonidazole (red, hypoxia marker), MCT1 (green, placenta labyrinth zone marker) and DAPI (blue, nuclear staining). Scale bar: 100 μm. STZ, Streptozotocin; MCT4, Monocarboxylate transporter 4; MCT1, Monocarboxylate transporter 1. Data information: Data depicted is biological replicates. For panels (A) and (B), data is depicted as mean ± SEM and was analyzed using Student’s t-test. *P < 0.05. Source data are available online for this figure.
Figure EV1
Figure EV1. Maternal mouse blood analysis.
(AE) Hemoglobin (n = 5 control mice, n = 8 STZ mice) (A), Potassium (n = 4 control mice, n = 8 STZ mice) (B), Sodium (n = 4 control mice, n = 8 STZ mice) (C), Calcium (n = 4 control mice, n = 8 STZ mice) (D) and Chloride (n = 4 control mice, n = 8 STZ mice) (E) levels in maternal control and STZ mice. STZ, Streptozotocin; ns, non-significant. Data information: Data depicted is biological replicates. In panels (AE), data is presented as mean ± SEM, and was analyzed using Student’s t-test.
Figure EV2
Figure EV2. QC of mouse oocyte single-cell RNAseq data.
(A) Amount of features (genes) per cell (5 control animals, n = 100 oocytes; 9 STZ animals, n = 172 oocytes). (B) Amount of counts per cell (5 control animals, n = 100 oocytes; 9 STZ animals, n = 172 oocytes). (C) Percentage of mitochondrial reads per cell (5 control animals, n = 100 oocytes; 9 STZ animals, n = 172 oocytes). (D) Amount of ribosomal reads per cell (5 control animals, n = 100 oocytes; 9 STZ animals, n = 172 oocytes). Data information: Data depicted is biological replicates and readcounts. For boxplots in panels (AD), the lower and upper hinges of the box depict the 1st and 3rd quartiles, and the middle line depicts the median. The upper and lower whiskers extend to the largest or smallest value no further than 1.5 times the interquartile range (1.5*IQR) from the hinge. Data beyond the end of the whiskers are plotted as a larger dot, which are then the minimum and/or maximum values depicted. If no large dots are present, the whiskers extend to the minimum and/or maximum values.
Figure EV3
Figure EV3. Mouse oocyte single-cell ATAC seq analysis.
(A) Amount of unique fragments detected per cell from control (n = 95) and STZ oocytes (n = 85. (B) Fragment size distribution from control (n = 95) and STZ oocytes (n = 85 (C) TSS enrichment profile from control (n = 95) and STZ oocytes (n = 85). (D) UMAP depicting scATAC profiles from control (n = 95) and STZ oocytes (n = 85). (E) Volcano plot displaying no differentially accessible regions between control (n = 85) and STZ (n = 95) oocytes. TSS, Transcription starting site; UMAP, Uniform Manifold Approximation and Projection; STZ, Streptozotocin. Data information: Data depicted is biological replicates. For boxplots in panel (A), the lower and upper hinges of the box depict the 1st and 3rd quartiles, and the middle line depicts the median. The upper and lower whiskers extend to the largest or smallest value no further than 1.5 times the interquartile range (1.5*IQR) from the hinge. Data beyond the end of the whiskers are plotted as a violin plot, which are then the minimum and/or maximum values depicted.
Figure EV4
Figure EV4. QC of human oocyte single-cell RNAseq data.
(A) Amount of features (genes) per cell (n = 20 for 2.5 mM, n = 21 for 5 mM, n = 20 for 10 mM). (B) Amount of counts per cell (n = 20 for 2.5 mM, n = 21 for 5 mM, n = 20 for 10 mM). (C) Percentage of mitochondrial reads per cell (n = 20 for 2.5 mM, n = 21 for 5 mM, n = 20 for 10 mM). (D) Amount of ribosomal reads per cell (n = 20 for 2.5 mM, n = 21 for 5 mM, n = 20 for 10 mM). Data information: Data depicted is biological replicates and readcounts. For boxplots in panels (AD), the lower and upper hinges of the box depict the 1st and 3rd quartiles, and the middle line depicts the median. The upper and lower whiskers extend to the largest or smallest value no further than 1.5 times the interquartile range (1.5*IQR) from the hinge. Data beyond the end of the whiskers are plotted as a larger dot, which are then the minimum and/or maximum values depicted. If no large dots are present, the whiskers extend to the minimum and/or maximum values.

References

    1. Amemiya HM, Kundaje A, Boyle AP. The ENCODE blacklist: identification of problematic regions of the genome. Sci Rep. 2019;9:9354. doi: 10.1038/s41598-019-45839-z. - DOI - PMC - PubMed
    1. Arokoyo DS, Oyeyipo IP, Du Plessis SS, Chegou NN, Aboua YG. Modulation of inflammatory cytokines and islet morphology as therapeutic mechanisms of Basella alba in streptozotocin-induced diabetic rats. Toxicol Res. 2018;34:325–332. doi: 10.5487/TR.2018.34.4.325. - DOI - PMC - PubMed
    1. Bathina S, Srinivas N, Das UN. Streptozotocin produces oxidative stress, inflammation and decreases BDNF concentrations to induce apoptosis of RIN5F cells and type 2 diabetes mellitus in Wistar rats. Biochem Biophys Res Commun. 2017;486:406–413. doi: 10.1016/j.bbrc.2017.03.054. - DOI - PubMed
    1. Beck RW, Riddlesworth T, Ruedy K, Ahmann A, Bergenstal R, Haller S, Kollman C, Kruger D, McGill JB, Polonsky W, et al. Effect of continuous glucose monitoring on glycemic control in adults with type 1 diabetes using insulin injections: the DIAMOND randomized clinical trial. JAMA. 2017;317:371–378. doi: 10.1001/jama.2016.19975. - DOI - PubMed
    1. Bergenstal RM, Nimri R, Beck RW, Criego A, Laffel L, Schatz D, Battelino T, Danne T, Weinzimer SA, Sibayan J, et al. A comparison of two hybrid closed-loop systems in adolescents and young adults with type 1 diabetes (FLAIR): a multicentre, randomised, crossover trial. Lancet Lond Engl. 2021;397:208–219. doi: 10.1016/S0140-6736(20)32514-9. - DOI - PMC - PubMed