. 2024 Mar 16;23(1):56.
doi: 10.1186/s12943-024-01952-w.

Affinity fine-tuning anti-CAIX CAR-T cells mitigate on-target off-tumor side effects

Affiliations

Affinity fine-tuning anti-CAIX CAR-T cells mitigate on-target off-tumor side effects

Yufei Wang et al. Mol Cancer. .

Abstract

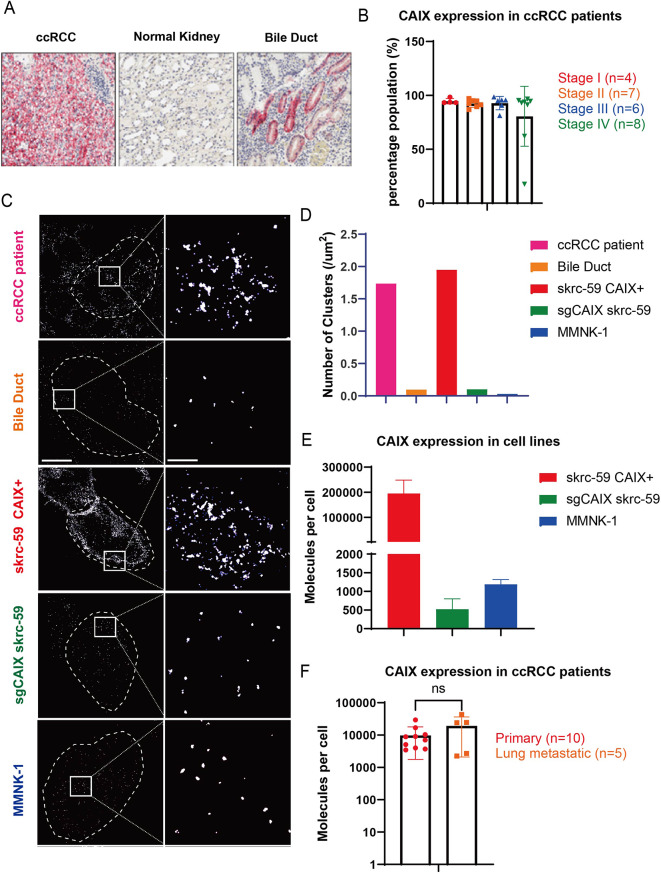
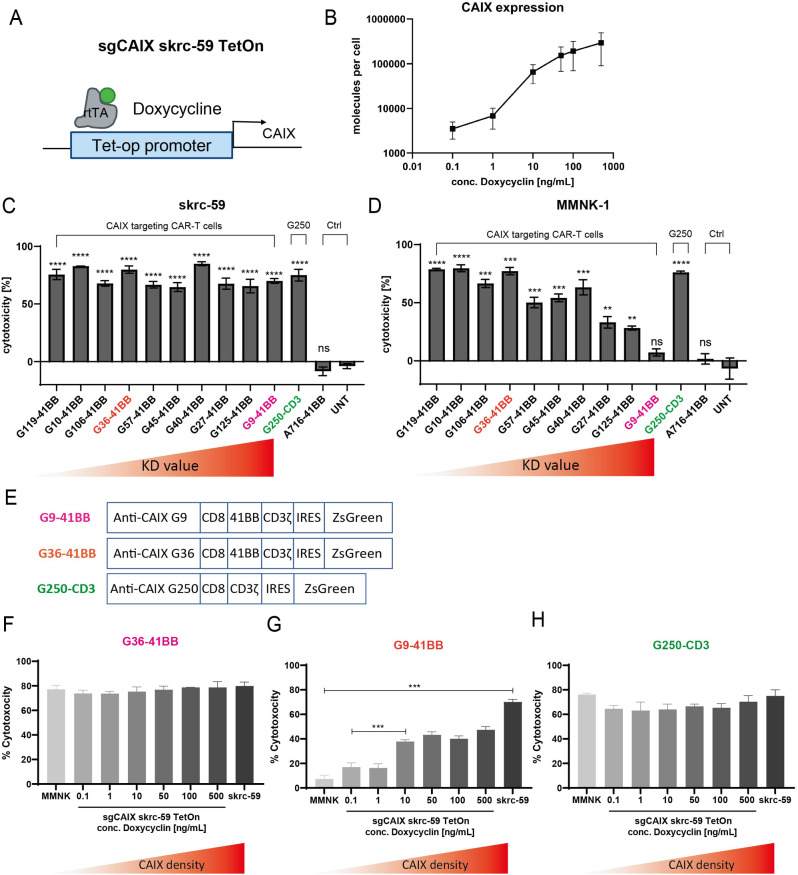
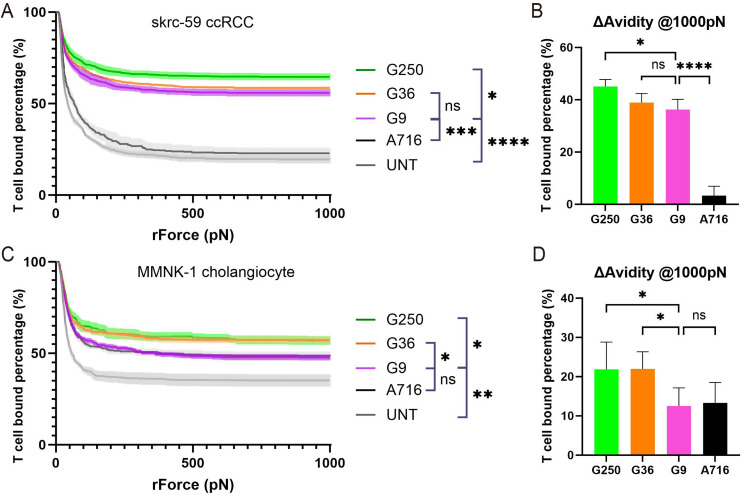
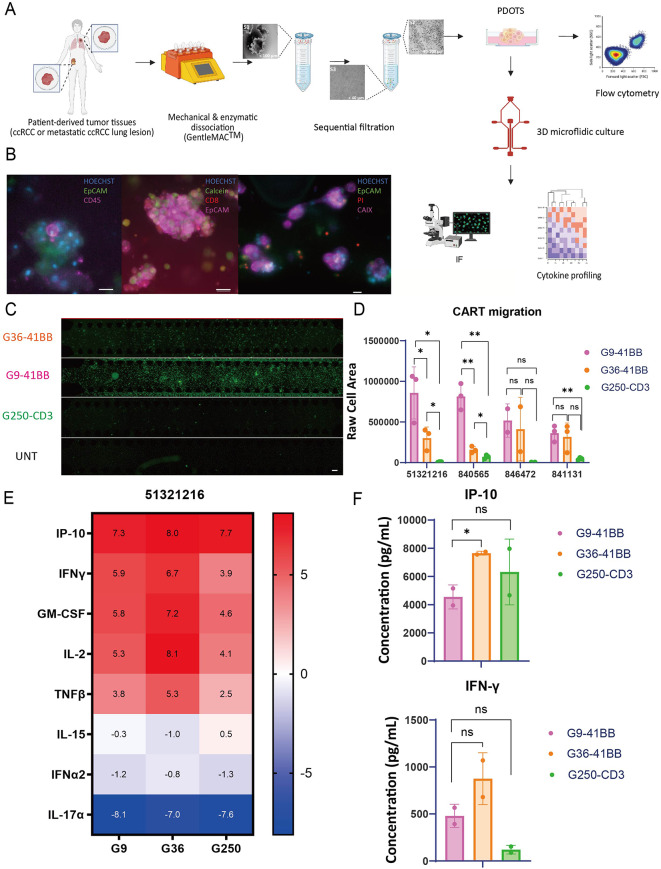
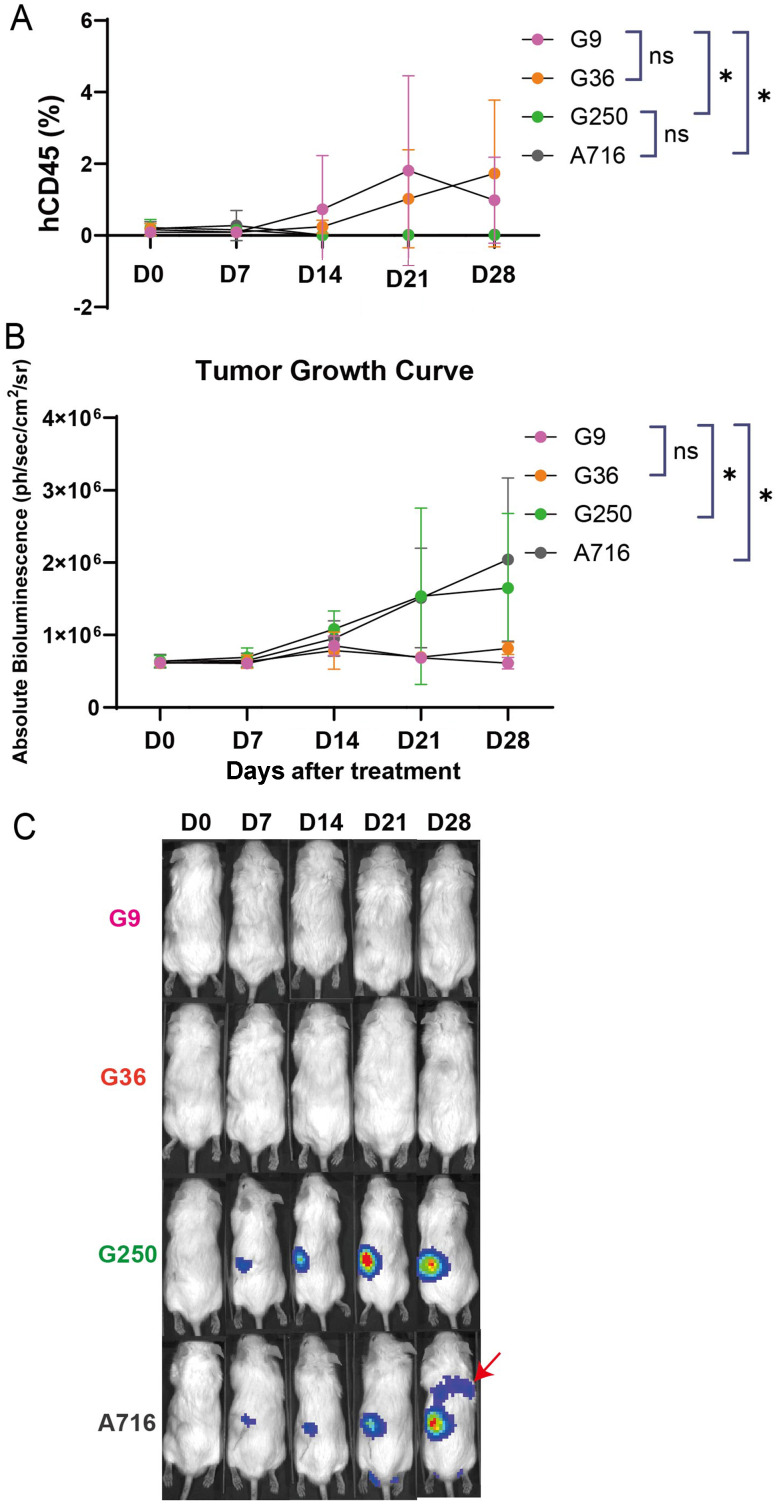
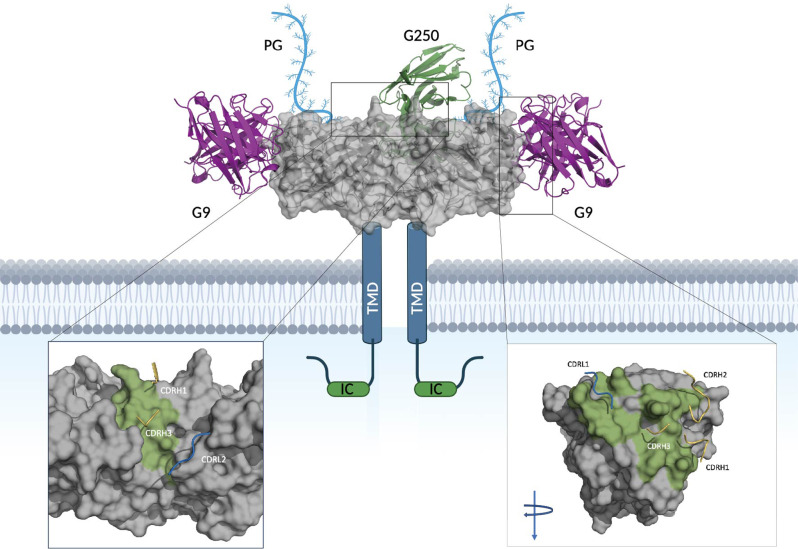
One of the major hurdles that has hindered the success of chimeric antigen receptor (CAR) T cell therapies against solid tumors is on-target off-tumor (OTOT) toxicity due to sharing of the same epitopes on normal tissues. To elevate the safety profile of CAR-T cells, an affinity/avidity fine-tuned CAR was designed enabling CAR-T cell activation only in the presence of a highly expressed tumor associated antigen (TAA) but not when recognizing the same antigen at a physiological level on healthy cells. Using direct stochastic optical reconstruction microscopy (dSTORM) which provides single-molecule resolution, and flow cytometry, we identified high carbonic anhydrase IX (CAIX) density on clear cell renal cell carcinoma (ccRCC) patient samples and low-density expression on healthy bile duct tissues. A Tet-On doxycycline-inducible CAIX expressing cell line was established to mimic various CAIX densities, providing coverage from CAIX-high skrc-59 tumor cells to CAIX-low MMNK-1 cholangiocytes. Assessing the killing of CAR-T cells, we demonstrated that low-affinity/high-avidity fine-tuned G9 CAR-T has a wider therapeutic window compared to high-affinity/high-avidity G250 that was used in the first anti-CAIX CAR-T clinical trial but displayed serious OTOT effects. To assess the therapeutic effect of G9 on patient samples, we generated ccRCC patient derived organotypic tumor spheroid (PDOTS) ex vivo cultures and demonstrated that G9 CAR-T cells exhibited superior efficacy, migration and cytokine release in these miniature tumors. Moreover, in an RCC orthotopic mouse model, G9 CAR-T cells showed enhanced tumor control compared to G250. In summary, G9 has successfully mitigated OTOT side effects and in doing so has made CAIX a druggable immunotherapeutic target.

Keywords: Affinity/avidity fine-tuned; Carbonic anhydrase IX (CAIX); Chimeric antigen receptor (CAR) T; Clear cell renal cell carcinoma (ccRCC); Direct stochastic optical reconstruction microscopy (dSTORM); On-target off-tumor (OTOT) toxicity.


Conflict of interest statement

W.A.M has patents in the PD-1/ PDL1 field. G.J.F has patents/pending royalties on the PD-1/PD-L1 pathway from Roche, Merck MSD, Bristol-Myers-Squibb, Merck KGA, Boehringer-Ingelheim, AstraZeneca, Dako, Leica, Mayo Clinic, Eli Lilly, and Novartis. G.J.F has served on advisory boards for Roche, Bristol-Myers-Squibb, Xios, Origimed, Triursus, iTeos, NextPoint, IgM, Jubilant, Trillium, IOME, GV20, Invaria, and Geode. G.J.F has equity in Nextpoint, Triursus, Xios, iTeos, IgM, GV20, Invaria, and Geode. S. S. reports receiving commercial research grants from Bristol-Myers Squibb, AstraZeneca, Exelixis and Novartis; is a consultant/advisory board member for Merck, AstraZeneca, Bristol-Myers Squibb, CRISPR Therapeutics AG, AACR, and NCI; receives royalties from Biogenex; and mentored several non-US citizens on research projects with potential funding (in part) from non-US sources/Foreign Components. T.K.C. institutional and personal, paid and unpaid support for research, advisory boards, consultancy, and honoraria from AstraZeneca, Aravive, Aveo, Bayer, Bristol Myers-Squibb, Calithera, Circle Pharma, Eisai, EMD Serono, Exelixis, GlaxoSmithKline, IQVA, Infinity, Ipsen, Jansen, Kanaph, Lilly, Merck, Nikang, Nuscan, Novartis, Pfizer, Roche, Sanofi/Aventis, Surface Oncology, Takeda, Tempest, Up-To-Date, CME events (Peerview, OncLive, MJH and others), outside the submitted work. T.K.C. has institutional patents filed on molecular alterations and immunotherapy response/toxicity, and ctDNA. T.K.C. has equity in Tempest, Pionyr, Osel, Precede Bio. T.K.C. has served on committees for NCCN, GU Steering Committee, ASCO/ESMO, ACCRU, KidneyCan. T.K.C. has medical writing and editorial assistance support may have been funded by Communications companies in part. T.K.C. has mentored several non-US citizens on research projects with potential funding (in part) from non-US sources/Foreign Components. The institution (Dana-Farber Cancer Institute) may have received additional independent funding of drug companies or/and royalties potentially involved in research around the subject matter. C.P.P. is a consultant for XSphera Biosciences and has stock and other ownership interests in XSphera Biosciences. Received honoraria from Thermo Fisher and Agilent and has sponsored research agreements with Daiichi Sankyo, Bicycle Therapeutics, Transcenta, Bicara Therapeutics, AstraZeneca, Janssen Pharmaceuticals, Array Biopharma, Takeda Onkology, Bristol Meyers Squibb, TargImmune, and Mirati Therapeutics. D.A.B. is a consultant for N of One/Qiagen and Nerviano Medical Sciences, is a founder and shareholder in XSphera Biosciences, has received honoraria from Merck, H3 Biomedicine/Esai, EMD Serono, Gilead Sciences, Abbvie, and Madalon Consulting, and research grants from BMS, Takeda, Novartis, Gilead, and Lilly.

Figures

Fig. 1
Fig. 1
Quantification of CAIX on patient ccRCC samples, healthy bile duct, and cell lines. (A) IHC staining of CAIX on ccRCC and bile duct samples. (B) CAIX positivity quantified by IHC on ccRCC patient samples from different stages, Stage I (red), Stage II (orange), Stage III (blue) and Stage IV (green). (C) High resolution representative images of CAIX on ccRCC (pink), bile duct (orange), skrc-59 CAIX+ cell line (red), sgCAIX skrc-59 cell line (green) and MMNK-1 cell line (blue). (D) Bar plot of CAIX expression quantified by dSTORM presented by number of clusters on ccRCC (pink), bile duct (orange), skrc-59 CAIX+ cell line (red), sgCAIX skrc-59 cell line (green) and MMNK-1 cell line (blue). (E) Bar plot of CAIX expression quantified by flow cytometry on skrc-59 CAIX+ cell line (red), sgCAIX skrc-59 cell line (green) and MMNK-1 cell line (blue) with mean values of 195,176, 523, 1189 accordingly. (F) Bar plot of CAIX expression quantified by flow cytometry on ccRCC patient samples from primary and lung metastatic lesions, primary (red, n = 10), lung metastatic (orange, n = 5), with mean values of 10,396, 19,292 accordingly. All data with error bars are presented as mean ± SD. P values are defined by unpaired two-tailed t-tests (*p < 0.05; **p < 0.01; ***p < 0.001; and ****p < 0.0001)
Fig. 2
Fig. 2
Cytotoxicity of anti-CAIX CAR-T cells in vitro. (A) Tet-On CAIX inducible skrc-59 cell line is engineered to utilize the Tet-op promoter to sense different concentrations of Dox to control CAIX expression. (B) CAIX expression on the Tet-On cells in the presence of different Dox concentrations. (C) Cytotoxicity of anti-CAIX CAR-T cells on CAIX high skrc-59 tumor cells. CD8 CAR-T cells with E:T ratio of 2:1. The variants of CAR-T cells are arranged in descending order of affinity from left to right indicated by increasing KD values. P values are defined by unpaired two-tailed t-tests between each CAR-T to untransduced T cell (UNT) (∗p < 0.05; ∗∗p < 0.01; ∗∗∗p < 0.001; and ∗∗∗∗p < 0.0001). (D) Cytotoxicity of anti-CAIX CAR-T cells on CAIX low MMNK-1 cholangiocytes. CD8 CAR-T cells with E:T ratio of 2:1. From left to right, within the group of CAIX targeted CAR-T cells, the KD value of each scFv is increasing, meaning the affinity is decreasing. P values are defined by unpaired two-tailed t-tests between each CAR-T to untransduced T cell (UNT) (∗p < 0.05; ∗∗p < 0.01; ∗∗∗p < 0.001; and ∗∗∗∗p < 0.0001). Specificity index is defined by using the cytotoxicity on skrc-59 tumor cells divided by the cytotoxicity on MMNK-1 cells. (E) CAR constructs of G9-41BB, G36-41BB and G250-CD3 are shown. Cytotoxicity of (F) G36, (G) G9 and (H) G250 on Tet-On inducible skrc-59 cells. The variants of CAR-T cells are arranged in escalating order of CAIX density on the cell surface. All data with error bars are presented as mean ± SD. P values are defined by unpaired two-tailed t-tests (∗p < 0.05; ∗∗p < 0.01; ∗∗∗p < 0.001; and ∗∗∗∗p < 0.0001). Only significant differences are shown in the plot
Fig. 3
Fig. 3
Avidity of CAR-T cells on tumor and normal cells. (A) Avidity of CAR-T cells on skrc-59 ccRCC tumor cells. The percentage of G250 (green), G36 (orange), G9 (pink), A716 (black), UNT (grey) binding to skrc-59 ccRCC tumor cells are shown in the plot (n = 4 per group). (B) Avidity of CAR-T cells on skrc-59 tumor cells at 1000 pN endpoint. The normalized percentage of G250 (green), G36 (orange), G9 (pink), A716 (black) binding to skrc-59 ccRCC tumor cells at 1000 pN are shown in the bar plot (the normalized percentage of binding is defined by minus the binding of UNT) (n = 4 per group). (C) Avidity of CAR-T cells on MMNK-1 cholangiocytes. The percentage of G250 (green), G36 (orange), G9 (pink), A716 (black), UNT (grey) binding to MMNK-1 cholangiocytes are shown in the plot (n = 4 per group). (D) Avidity of CAR-T cells on MMNK-1 cholangiocytes at 1000 pN endpoint. The normalized percentage of G250 (green), G36 (orange), G9 (pink), A716 (black) binding to MMNK-1 cholangiocytes at 1000 pN are shown in the bar plot (the normalized percentage of binding is defined by minus the binding of UNT) (n = 4 per group). All data with error bars are presented as mean ± SD. P values are defined by unpaired two-tailed t-tests (∗p < 0.05; ∗∗p < 0.01; ∗∗∗p < 0.001; and ∗∗∗∗p < 0.0001)
Fig. 4
Fig. 4
Efficacy of anti-CAIX CAR-T cells on RCC patient derived organotypic tumor spheroids (PDOTS). (A) Schematic of workflow. ccRCC patient tumor specimens were collected, digested and filtered into S1, S2, S3 fractions, in which S2 fraction was used to generate ccRCC PDOTS. On Day −1, PDOTS mixed with collagen were injected into the central channel of the microfluidic device. Quality control (QC) was performed on Day 0 to profile ccRCC TME and determine the viability of PDOTS. The CAR-T cells were added to the side channels and co-incubated with PDOTS for 6 days. And the downstream analysis was performed. (B) Representative images of PDOTS on Day 0. IF was performed to show biomarkers on PDOTS. In the left panel, PDOTS were stained with Hoechst, EpCAM and CD45. In the middle panel, PDOTS were stained with Hoechst, Calcein, CD8, and EpCAM. In the right panel, PDOTS were stained with Hoechst, EpCAM, PI, and CAIX. Scale bars shown in the images represent 20 μm. (C) CAR-T migration was evaluated on Day 6 on PDOTS of a primary ccRCC sample (51321216). By using the ZsGreen fluorescence of CAR-T cells, the signal of middle channel was quantified. Scale bars shown in the images represent 200 μm. (D) CAR-T migration was quantified on PDOTS of a primary ccRCC sample (51321216). G9 (pink), G36 (orange), G250 (green) are shown in the plot. (E) Heatmap of log2 fold change of selected cytokine and chemokine in the supernatant. Cytokine profiling was performed via Luminex using supernatant collected on Day 6 from PDOTS (51321216 RCC sample) and CAR-T co-cultures. Selected cytokines and chemokines are shown here, including IP-10, IFN-γ, GM-CSF, IL-2, TNFβ, IL-15, IFN-α2, and IL-17α. (F) Bar plots of IP-10, and IFN-γ secretion of PDOTS (51,321,216) co-culturing with G9 (pink), G36 (orange), and G250 (green) were shown in the plot. All data with error bars are presented as mean ± SD. P values are defined by unpaired two-tailed t-tests (∗p < 0.05; ∗∗p < 0.01; ∗∗∗p < 0.001; and ∗∗∗∗p < 0.0001)
Fig. 5
Fig. 5
Fine-tuned CAIX targeted G9-41BB CAR-T cells exhibited superior efficacy in a ccRCC orthotopic NSG-SGM3 mouse model. (A) CAR-T expansion (the percentage of human CD45 + immune cells out of total live leukocytes in the peripheral blood) of G9 (pink), G36 (orange), G250 (green) and A716 (grey) is shown in the plot (n = 5 per group). Peripheral blood was analyzed via flow cytometry. ccRCC skrc-59 tumor cells were inoculated under the kidney capsule. One week after tumor implantation, one million CAR-T cells were injected intravenously. Tumor growth was monitored by BLI weekly for four weeks and circulating CAR-T cells were phenotyped weekly by flow cytometric analysis of peripheral blood. (B) Tumor growth curve of the mice treated with one million CD4:CD8 = 2:1 G9 (pink), G36 (orange), G250 (green) or A716 (grey) CAR-T cells (n = 5 per group). BLI was performed on Day 0, Day 7, Day 14, Day 21 and Day 28 after CAR-T infusion. (C) BLI images of mice treated with one million CD4:CD8 = 2:1 G9 (pink), G36 (orange), G250 (green) or A716 (grey) CAR-T cells on Day 0, Day 7, Day 14, Day 21 and Day 28 after CAR-T infusion. The red arrow indicates the lung metastasis of RCC tumor. All data with error bars are presented as mean ± SD. P values are defined by unpaired two-tailed t-tests (∗p < 0.05; ∗∗p < 0.01; ∗∗∗p < 0.001; and ∗∗∗∗p < 0.0001)
Fig. 6
Fig. 6
Binding mode of G9 and G250 with CAIX. Depicts TAA, CAIX, gray, along with its transmembrane domain, intracellular tail and proteoglycan (PG) domain at the N-terminus. The variable regions of mAb, G9, are shown in pink bound to the predicted epitope and the variable regions of mAb G250, are shown in green. The zoomed view depicts the binding interface of G250 to CAIX (left) and G9 to CAIX (right, turned 90 degree) with epitopes colored in green and contact regions of the complementarity determining regions (CDRs) shown in yellow (heavy chain), and blue (light chains). G9 shows 2:1 binding mode to a CAIX dimer and G250 binds to a CAIX dimer in 1:1 ratio

References

    1. First-Ever CAR T-cell Therapy Approved in U.S. Cancer Discov. 2017;7(10):OF1. https://pubmed.ncbi.nlm.nih.gov/28887358/#:~:text=The%20first%20chimeric.... - PubMed
    1. Kakarla S, Gottschalk S. CAR T cells for solid tumors: armed and ready to go? Cancer J. 2014 Mar-Apr;20:151–5. 10.1097/ppo.0000000000000032. - PMC - PubMed
    1. Feng K, Guo Y, Dai H, Wang Y, Li X, Jia H, et al. Chimeric antigen receptor-modified T cells for the immunotherapy of patients with EGFR-expressing advanced relapsed/refractory non-small cell lung cancer. Science China Life Sciences. 2016 2016/05/01;59:468–79. 10.1007/s11427-016-5023-8. - PubMed
    1. Ahmed N, Brawley V, Hegde M, Bielamowicz K, Kalra M, Landi D, et al. HER2-Specific Chimeric Antigen Receptor-Modified Virus-Specific T Cells for Progressive Glioblastoma: a phase 1 dose-escalation Trial. JAMA Oncol. 2017;3(1094–1101). 10.1001/jamaoncol.2017.0184. - PMC - PubMed
    1. Mei Z, Zhang K, K.-Y Lam A, Huang J, Qiu F, Qiao B, et al. MUC1 as a target for CAR-T therapy in head and neck squamous cell carinoma. Cancer Med. 2020;9:640–52. doi: 10.1002/cam4.2733. - DOI - PMC - PubMed

Publication types