

Characteristics of the oral and gastric microbiome in patients with early-stage intramucosal esophageal squamous cell carcinoma
- PMID: 38491387
- PMCID: PMC10941485
- DOI: 10.1186/s12866-024-03233-4
Characteristics of the oral and gastric microbiome in patients with early-stage intramucosal esophageal squamous cell carcinoma
Abstract
Background: Oral microbiome dysbacteriosis has been reported to be associated with the pathogenesis of advanced esophageal cancer. However, few studies investigated the potential role of oral and gastric microbiota in early-stage intramucosal esophageal squamous carcinoma (EIESC).
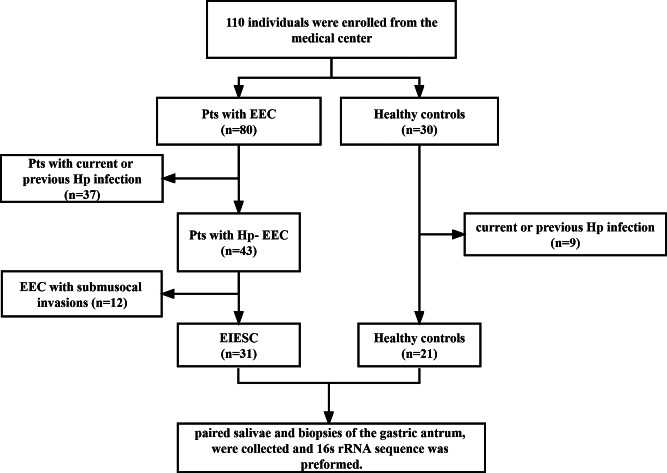
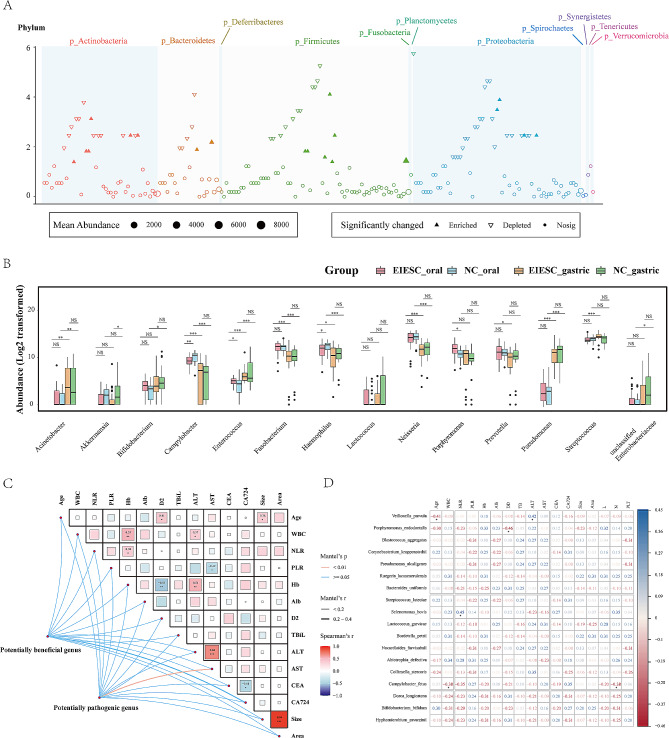
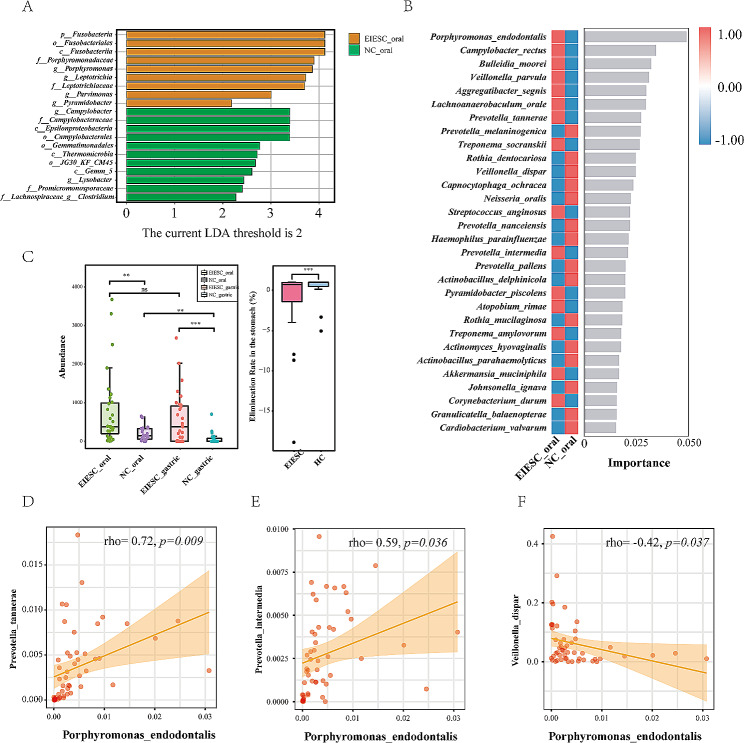
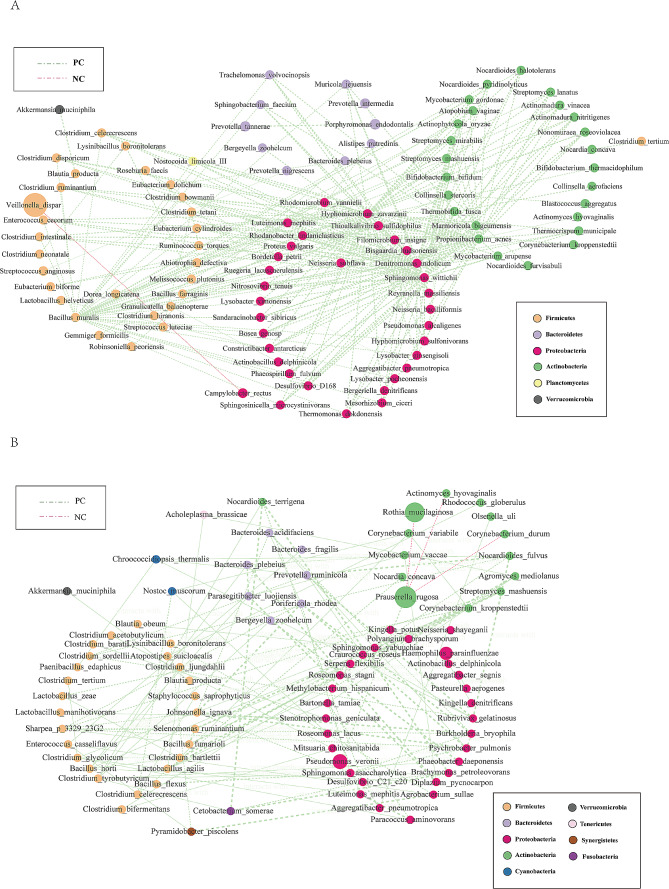
Method: A total of 104 samples were collected from 31 patients with EIESC and 21 healthy controls. The compositions of oral and gastric microbiota were analyzed using 16 S rRNA V3-V4 amplicon sequencing. Linear discriminant analysis effect size (LEfSe) analysis was performed to assess taxonomic differences between groups. The correlation between oral microbiota and clinicopathological factors was evaluated using Spearman correlation analysis. Additionally, co-occurrence networks were established and random forest models were utilized to identify significant microbial biomarkers for distinguishing between the EIESC and control groups.
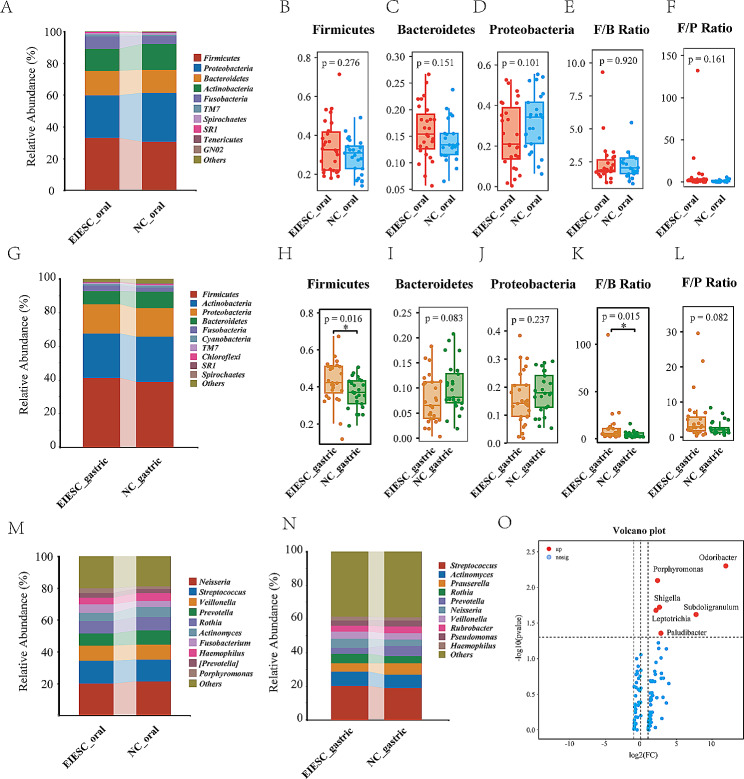
Results: A total of 292 oral genera and 223 species were identified in both EIESC and healthy controls. Six oral genera were remarkably enriched in EIESC groups, including the genera Porphyromonas, Shigella, Subdoligranulum, Leptotrichia, Paludibacter, and Odoribacter. LEfSe analysis identified genera Porphyromonas and Leptotrichia with LDA scores > 3. In the random forest model, Porphyromonas endodontalis ranked the top microbial biomarker to differentiate EIESC from controls. The elimination rate of Porphyromonas endodontalis from the oral cavity to the stomach was also dramatically decreased in the EIESC group than controls. In the microbial co-occurrence network, Porphyromonas endodontalis was positively correlated with Prevotella tannerae and Prevotella intermedia and was negatively correlated with Veillonella dispar.
Conclusion: Our study potentially indicates that the dysbacteriosis of both the oral and gastric microbiome was associated with EIESC. Larger scale studies and experimental animal models are urgently needed to confirm the possible role of microbial dysbacteriosis in the pathogenesis of EIESC. (Chinese Clinical Trial Registry Center, ChiCTR2200063464, Registered 07 September 2022, https://www.chictr.org.cn/showproj.html?proj=178563).
Keywords: Amplicon sequencing analysis; Early esophageal cancer; Gastric microbiome; Intramucosal esophageal squamous carcinoma; Oral microbiome.
© 2024. The Author(s).
Conflict of interest statement
The authors declare no competing interests.
Figures
Similar articles
-
Convergent dysbiosis of upper aerodigestive microbiota between patients with esophageal and oral cavity squamous cell carcinoma.Int J Cancer. 2023 May 1;152(9):1903-1915. doi: 10.1002/ijc.34460. Epub 2023 Feb 16. Int J Cancer. 2023. PMID: 36752573
-
Characteristics of Oral Microbiota in Patients with Esophageal Cancer in China.Biomed Res Int. 2021 Dec 16;2021:2259093. doi: 10.1155/2021/2259093. eCollection 2021. Biomed Res Int. 2021. PMID: 34957299 Free PMC article.
-
Dysbiosis of salivary microbiome and cytokines influence oral squamous cell carcinoma through inflammation.Arch Microbiol. 2021 Jan;203(1):137-152. doi: 10.1007/s00203-020-02011-w. Epub 2020 Aug 11. Arch Microbiol. 2021. PMID: 32783067
-
Esophageal cancer and bacterial part of gut microbiota - A multidisciplinary point of view.Front Cell Infect Microbiol. 2022 Nov 16;12:1057668. doi: 10.3389/fcimb.2022.1057668. eCollection 2022. Front Cell Infect Microbiol. 2022. PMID: 36467733 Free PMC article. Review.
-
The role of microbiota in esophageal squamous cell carcinoma: A review of the literature.Thorac Cancer. 2023 Oct;14(28):2821-2829. doi: 10.1111/1759-7714.15096. Epub 2023 Sep 7. Thorac Cancer. 2023. PMID: 37675608 Free PMC article. Review.
Cited by
-
Association between Oral Microbiome and Gastroesophageal Reflux Severity.J Clin Med. 2024 Jul 31;13(15):4479. doi: 10.3390/jcm13154479. J Clin Med. 2024. PMID: 39124746 Free PMC article.
-
Intestinal and esophageal microbiota in esophageal cancer development and treatment.Gut Microbes. 2025 Dec;17(1):2505118. doi: 10.1080/19490976.2025.2505118. Epub 2025 May 16. Gut Microbes. 2025. PMID: 40376843 Free PMC article. Review.
-
Association Between Oral Microbiota and Gastrointestinal/Extra-Gastrointestinal Diseases.Korean J Helicobacter Up Gastrointest Res. 2024 Dec;24(4):319-326. doi: 10.7704/kjhugr.2024.0051. Epub 2024 Dec 4. Korean J Helicobacter Up Gastrointest Res. 2024. PMID: 40502317 Free PMC article. Review.
-
Succession of the multi-site microbiome along pancreatic ductal adenocarcinoma tumorigenesis.Front Immunol. 2024 Nov 7;15:1487242. doi: 10.3389/fimmu.2024.1487242. eCollection 2024. Front Immunol. 2024. PMID: 39575247 Free PMC article.
References
-
- Morgan E, Soerjomataram I, Rumgay H, Coleman HG, Thrift AP, Vignat J, et al. The Global Landscape of esophageal squamous cell carcinoma and esophageal adenocarcinoma incidence and mortality in 2020 and projections to 2040: new estimates from GLOBOCAN 2020. Gastroenterology. 2022;163(3):649–58e2. doi: 10.1053/j.gastro.2022.05.054. - DOI - PubMed
MeSH terms
Substances
Grants and funding
LinkOut - more resources
Full Text Sources
Medical
