. 2024 Mar;13(5):e7015.
doi: 10.1002/cam4.7015.

Novel metabolic biomarker for early detection and diagnosis to the patients with gastric cardia adenocarcinoma

Affiliations

Novel metabolic biomarker for early detection and diagnosis to the patients with gastric cardia adenocarcinoma

Meng Xia Wei et al. Cancer Med. 2024 Mar.

Abstract

Background: Gastric cardia adenocarcinoma (GCA) is classified as Siewert type II adenocarcinoma at the esophagogastric junction in Western countries. The majority of GCA patients do not exhibit early warning symptoms, leading to over 90% of diagnoses at an advanced stage, resulting in a grim prognosis, with less than a 20% 5-year survival rate.

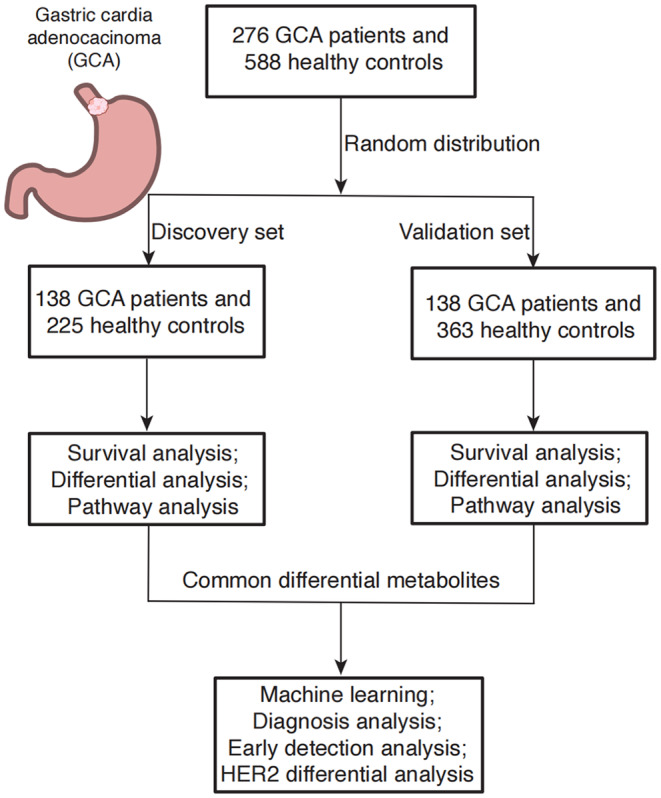
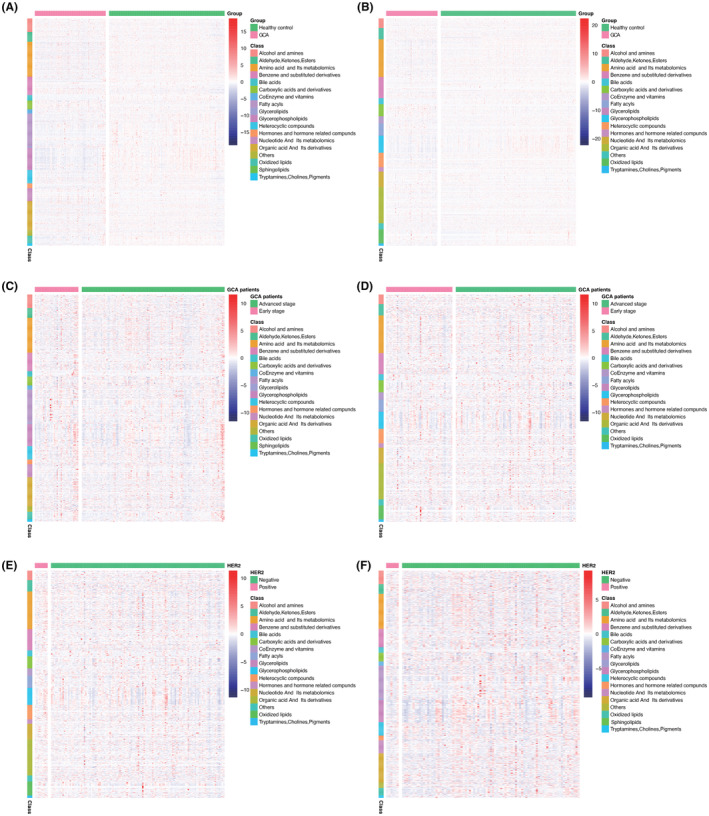
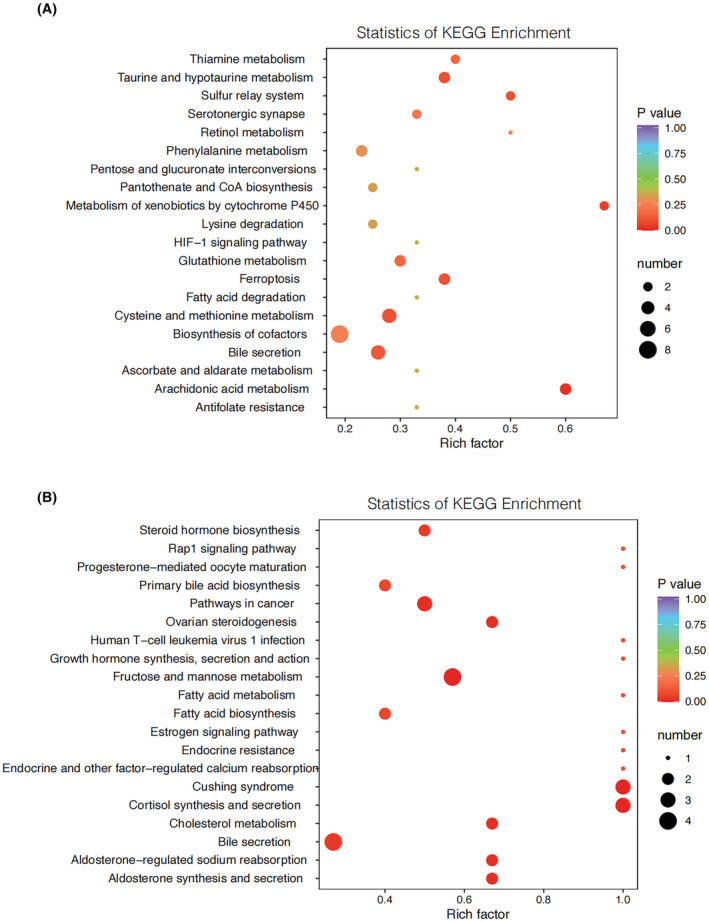
Method: Metabolic features of 276 GCA and 588 healthy controls were characterized through a widely-targeted metabolomics by UPLC-MS/MS analysis. This study encompasses a joint pathway analysis utilizing identified metabolites, survival analysis in both early and advanced stages, as well as high and negative and low expression of HER2 immunohistochemistry staining. Machine learning techniques and Cox regression models were employed to construct a diagnostic panel.

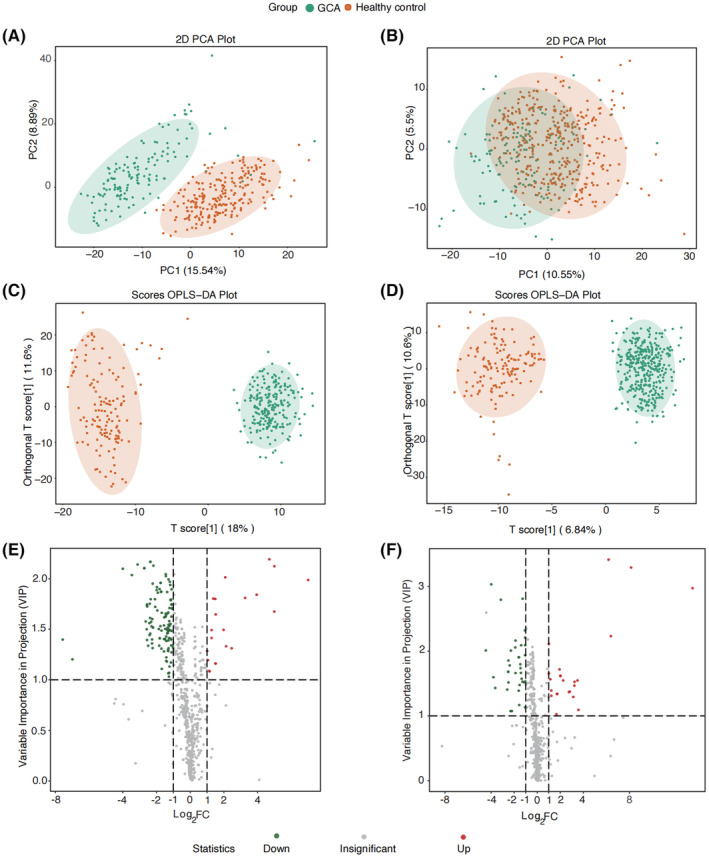
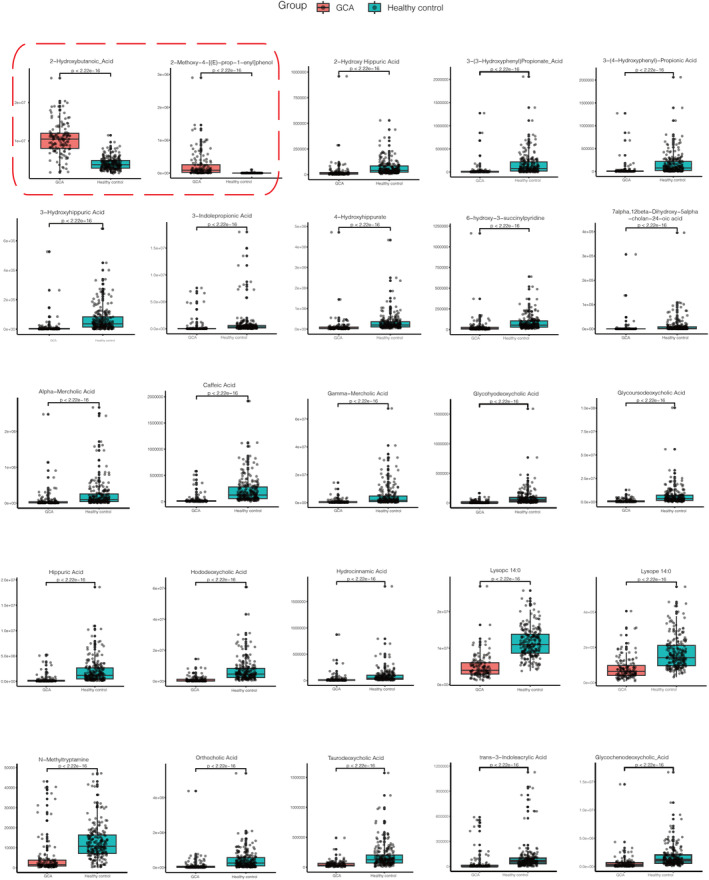
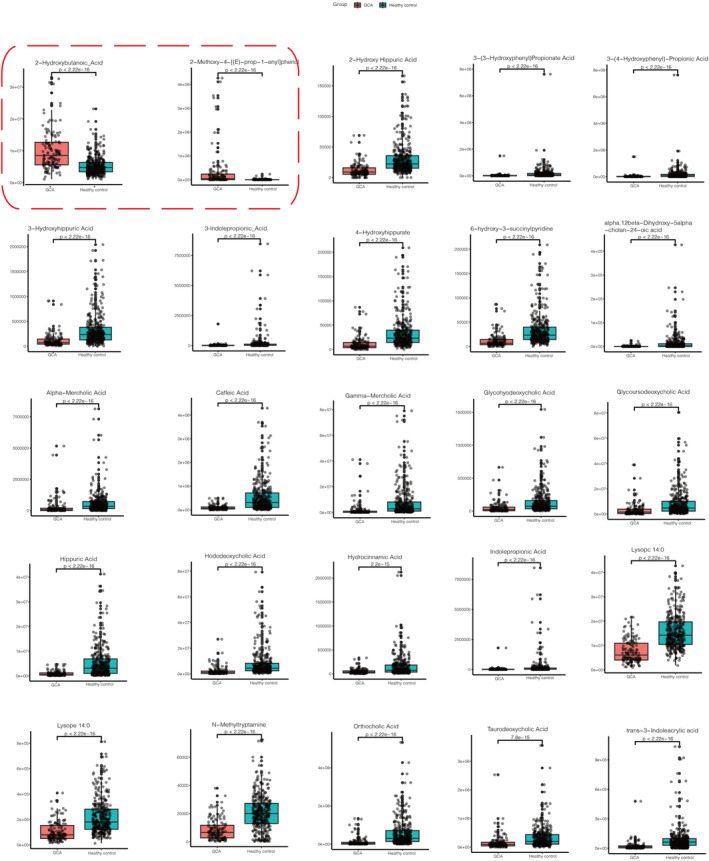
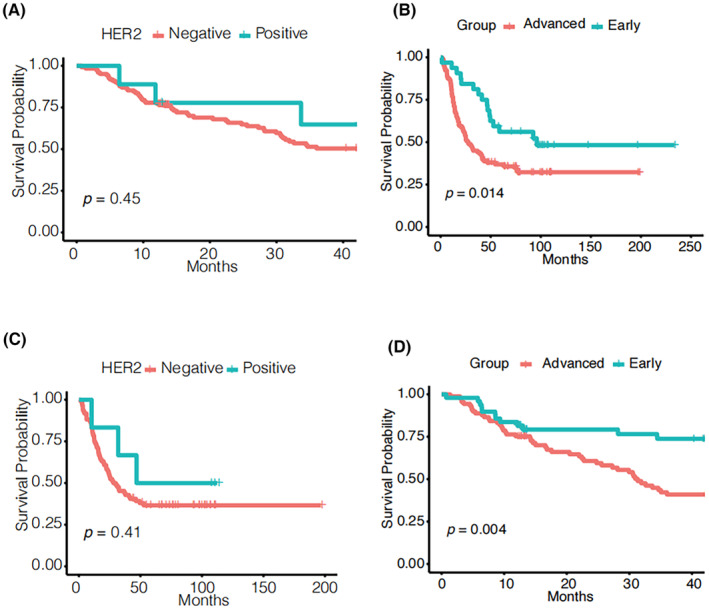
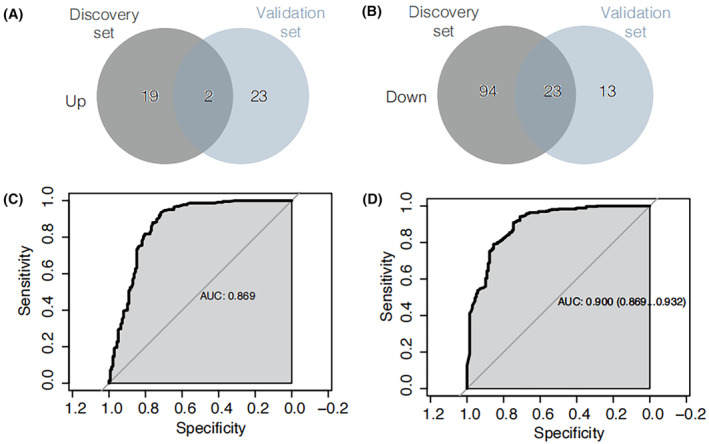
Results: A total of 25 differential metabolites were consistently identified in both discovery and validation sets based on criteria of p < 0.05, (VIP) ≥ 1, and FC ≥ 2 or FC ≤ 0.5. Early-stage GCA patients exhibited a more favorable prognosis compared to those in advanced stages. HER2 overexpression was associated with a more positive outcome compared to the negative and low expression groups. Metabolite panel demonstrated a robust diagnostic performance with AUC of 0.869 in discovery set and 0.900 in validation set.

Conclusions: A total of 25 common and stable differential metabolites may hold promise as liquid non-invasive indicators for GCA diagnosis. HER2 may function as a tumor suppressor gene in GCA, as its overexpression is associated with improved survival. The downregulation of bile acid metabolism in GCA may offer valuable theoretical insights and innovative approaches for precision-targeted treatments in GCA patients.

Keywords: HER2; bile acid; gastric cardia adenocarcinoma; metabolomics; stage.


Conflict of interest statement

The authors disclose no conflicts.

Figures

FIGURE 1
FIGURE 1
Study design. There are a total of 864 participants, including 588 healthy volunteers, 276 GCA patients in the discovery (138 GCA patients and 363 healthy control) and validation sets (138 GCA patients and 225 healthy control).
FIGURE 2
FIGURE 2
Principal component analysis (PCA) of discovery set (A) and validation set (B); orthogonal partial least squares discriminant analysis (OPLS‐DA) analysis of discovery set (C) and validation set (D); and volcano plot of differential metabolites for discovery set (E) and validation set (F).
FIGURE 3
FIGURE 3
Boxplots for 25 differential metabolites for discovery set with the criterion of p < 0.05, VIP ≥ 1, and FC ≥ 2 or FC ≤ 0.5. The two boxplots with red frame were upregulated metabolites 2‐hydroxybutanoic acid and 2‐methoxy‐4‐[(E)‐prop‐1‐enyl]phenol. And the rest were downregulated metabolites hododeoxycholic acid, glycoursodeoxycholic acid, glycochenodeoxycholic acid, caffeic acid, hippuric acid, hydrocinnamic acid, lysope 14:0, 3‐(3‐hydroxyphenyl)propionate acid, 3‐hydroxyhippuric acid, 2‐hydroxy hippuric acid, 3‐(4‐hydroxyphenyl)‐propionic acid, taurodeoxycholic acid, alpha‐mercholic acid, gamma‐mercholic acid, orthocholic acid, 6‐hydroxy‐3‐succinylpyridine, 7alpha,12beta‐dihydroxy‐5alpha‐cholan‐24‐oic acid, glycohyodeoxycholic acid, N‐methyltryptamine, 3‐indolepropionic acid, lysopc 14:0, trans‐3‐indoleacrylic acid, and 4‐hydroxyhippurate.
FIGURE 4
FIGURE 4
Boxplots for 25 differential metabolites for validation set with the criterion of p < 0.05, VIP ≥ 1, and FC ≥ 2 or FC ≤ 0.5. The two boxplots with red frame were upregulated metabolites 2‐hydroxybutanoic acid and 2‐methoxy‐4‐[(E)‐prop‐1‐enyl]phenol. And the rest were downregulated metabolites hododeoxycholic acid, glycoursodeoxycholic acid, glycochenodeoxycholic acid, caffeic acid, hippuric acid, hydrocinnamic acid, lysope 14:0, 3‐(3‐hydroxyphenyl)propionate acid, 3‐hydroxyhippuric acid, 2‐hydroxy hippuric acid, 3‐(4‐hydroxyphenyl)‐propionic acid, taurodeoxycholic acid, alpha‐mercholic acid, gamma‐mercholic acid, orthocholic acid, 6‐hydroxy‐3‐succinylpyridine, 7alpha,12beta‐dihydroxy‐5alpha‐cholan‐24‐oic acid, glycohyodeoxycholic acid, N‐methyltryptamine, 3‐indolepropionic acid, lysopc 14:0, trans‐3‐Indoleacrylic acid, and 4‐hydroxyhippurate.
FIGURE 5
FIGURE 5
Survival analysis of HER2 expression (A, discovery set; C, validation set) and clinical stage (B, discovery set; D, validation set).
FIGURE 6
FIGURE 6
Heatmap summarizing differential metabolites in GCA patients versus healthy controls based on metabolite classes were showed in (A) and (B). Color bars at the right from top to down indicate samples from patients (purple) and controls (green), metabolites classes, and relative abundance of upregulated (red) and downregulated (blue) metabolites, respectively. Each column represents an individual subject, and each row a metabolite; heatmap of GCA patients in early stage and advanced stage in discovery set (C) and validation set (D); HER2 negative and low and high expression groups for GCA patients in discovery set (E) and validation set (F).
FIGURE 7
FIGURE 7
Venn diagram of differential upregulated metabolites overlaps from discovery set and validation set (A). Venn diagram of differential downregulated metabolites overlaps from discovery set and validation set (B). Machine learning and Cox regression model for discovery set (C) and validation set (D).
FIGURE 8
FIGURE 8
Pathway analysis for discovery set (A) and validation set (B). Based on the differential metabolite results, KEGG pathway enrichment is performed, where Rich factor is the ratio of the number of differentially expressed metabolites in the corresponding pathway to the total number of metabolites detected and annotated by the pathway. The larger the value, the greater the degree of enrichment. The closer the p‐value is to 0, the more significant the enrichment is. The size of the points in the figure represents the number of significantly different metabolites enriched in the corresponding pathway.

Similar articles

Cited by

References

    1. Bano K, Al‐Shoha M, Raghavapuram S, et al. Gastric cardia cancer masquerading as a fundic subepithelial tumor. Am J Gastroenterol. 2018;113:1428. - PubMed
    1. Wang LD, Zheng S, Zheng ZY, Casson AG. Primary adenocarcinomas of lower esophagus, esophagogastric junction and gastric cardia: in special reference to China. World J Gastroenterol. 2003;9:1156‐1164. - PMC - PubMed
    1. Rawla P, Barsouk A. Epidemiology of gastric cancer: global trends, risk factors and prevention. Prz Gastroenterol. 2019;14:26‐38. - PMC - PubMed
    1. Christofk HR, Vander Heiden MG, Harris MH, et al. The M2 splice isoform of pyruvate kinase is important for cancer metabolism and tumour growth. Nature. 2008;452:230‐233. - PubMed
    1. Kim YJ, Chung WC, Cho IH, Kim J, Kim S. Prognostic effect of different etiologies in patients with gastric cardia cancer. Medicine (Baltimore). 2019;98:e18397. - PMC - PubMed

Publication types