

Parametric Solid Models of the At-Term Uterus From Magnetic Resonance Images
- PMID: 38491978
- PMCID: PMC11080951
- DOI: 10.1115/1.4065109
Parametric Solid Models of the At-Term Uterus From Magnetic Resonance Images
Abstract
Birthing mechanics are poorly understood, though many injuries during childbirth are mechanical, like fetal and maternal tissue damage. Several biomechanical simulation models of parturition have been proposed to investigate birth, but many do not include the uterus. Additionally, most solid models rely on segmenting anatomical structures from clinical images to generate patient geometry, which can be time-consuming. This work presents two new parametric solid modeling methods for generating patient-specific, at-term uterine three-dimensional geometry. Building from an established method of modeling the sagittal uterine shape, this work improves the uterine coronal shape, especially where the fetal head joins the lower uterine wall. Solid models of the uterus and cervix were built from five at-term patients' magnetic resonance imaging (MRI) sets. Using anatomy measurements from MRI-segmented models, two parametric models were created-one that employs an averaged coronal uterine shape and one with multiple axial measurements of the coronal uterus. Through finite element analysis, the two new parametric methods were compared to the MRI-segmented high-fidelity method and a previously published elliptical low-fidelity method. A clear improvement in the at-term uterine shape was found using the two new parametric methods, and agreement in principal Lagrange strain directions was observed across all modeling methods. These methods provide an effective and efficient way to generate three-dimensional solid models of patient-specific maternal uterine anatomy, advancing possibilities for future research in computational birthing biomechanics.
Copyright © 2024 by ASME.
Figures
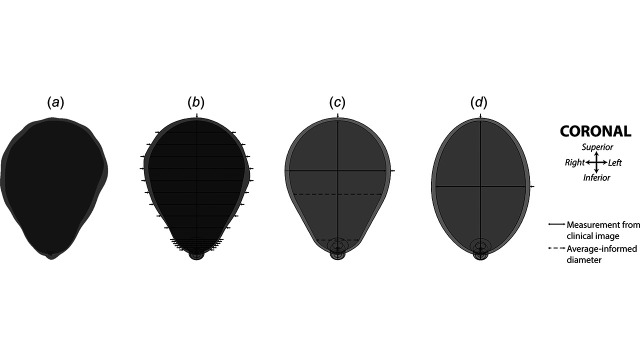
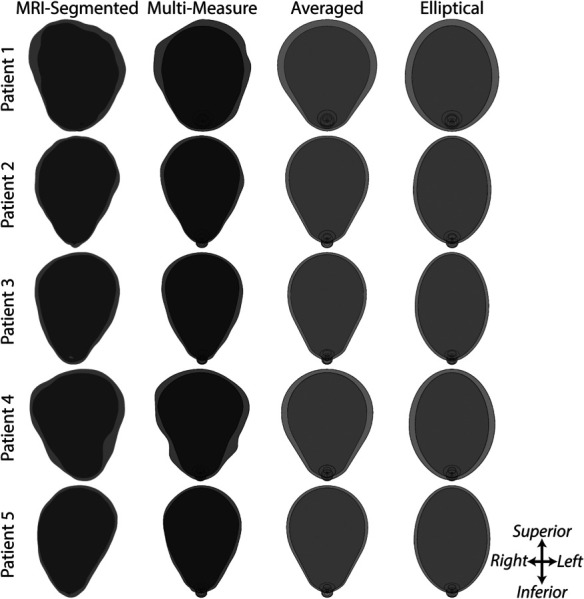
![Patient-specific models generated for one patient. (a) The MRI segmented model was created by hand-segmenting MRI image stacks, whereas the multimeasured, averaged, and elliptical models are based on parametric dimension measurements. All parametric models are based on previous methods for the uterine sagittal shape, with different approaches to creating the coronal shape [21]. (b) The multimeasured model uses 45 measurements to define the coronal shape (15 intra-uterine diameters, 15 right uterine wall thicknesses, and 15 left uterine wall thicknesses). (c) The averaged model uses the same measurements outlined in previous work (one intra-uterine diameter and one uterine wall thickness) but utilizes an averaged at-term uterine shape, [21]. (d) The elliptical model uses an elliptical coronal shape, as is assumed in previous work [21]. Dimension measurements taken from clinical images are denoted by solid black lines, and locations in the averaged parametric based on measurement trends are denoted by a dashed black line.](https://cdn.ncbi.nlm.nih.gov/pmc/blobs/a7fa/11080951/af15fb42f9e0/bio-23-1347_071008_g001.jpg)
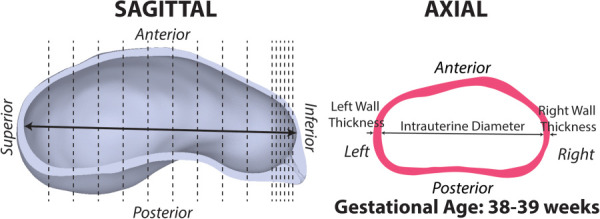
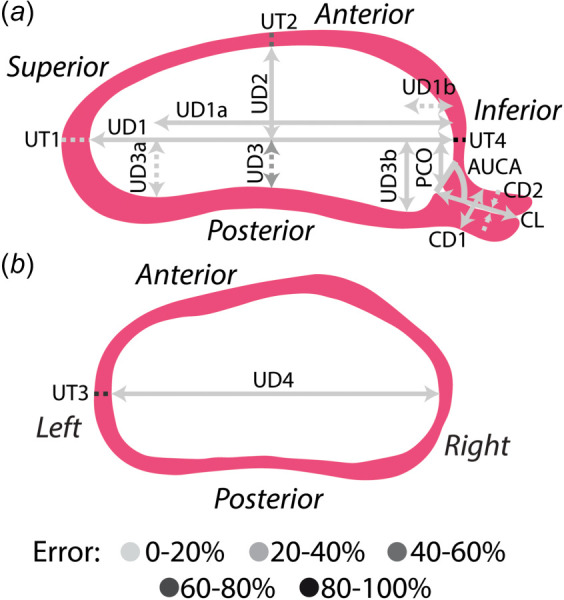
![Measurements of sagittal uterine shape were measured as described previously [21]. To capture the shape of the posterior uterine wall, the intra-uterine diameters that measure between the inferior-superior axis (UD1, horizontal dashed line) and the posterior wall on the superior half (UD3a) and inferior half (UD3b) of the uterus were defined as the extrema of the posterior uterine wall. Locator dimensions along the inferior-superior axis were also taken, UD1a and UD1b, respectively. The vertical dashed red lines show where equidistant measurements would be placed.](https://cdn.ncbi.nlm.nih.gov/pmc/blobs/a7fa/11080951/820172db9b54/bio-23-1347_071008_g002.jpg)
References
-
- Hamilton, E. B. , Martin, A. J. , and Osterman, J. K. M. , 2022, “ Births: Provisional Data for 2021,” National Center for Health Statistics (U.S.), Hyattsville, MD.
Publication types
MeSH terms
Grants and funding
LinkOut - more resources
Full Text Sources
