

Are all sugars equal? Role of the food source in physiological responses to sugars with an emphasis on fruit and fruit juice
- PMID: 38492022
- PMCID: PMC11329689
- DOI: 10.1007/s00394-024-03365-3
Are all sugars equal? Role of the food source in physiological responses to sugars with an emphasis on fruit and fruit juice
Abstract
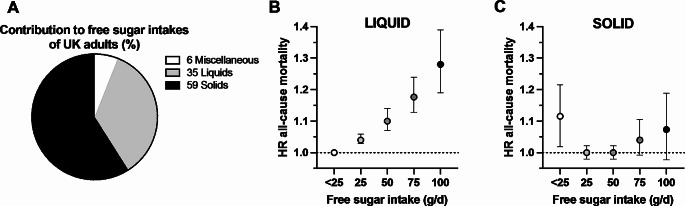
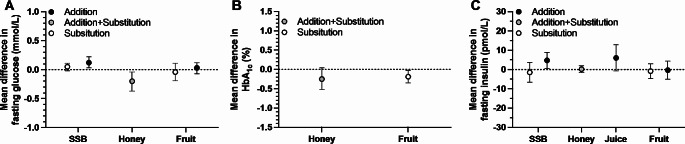
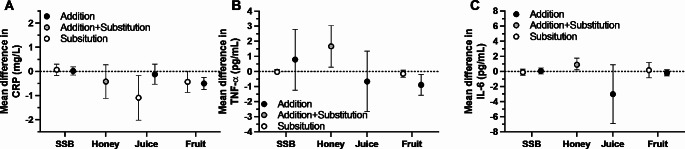
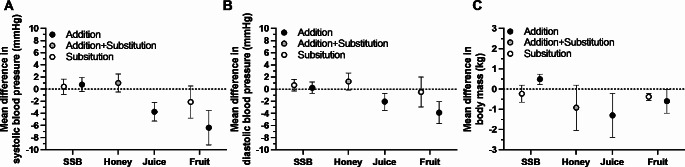
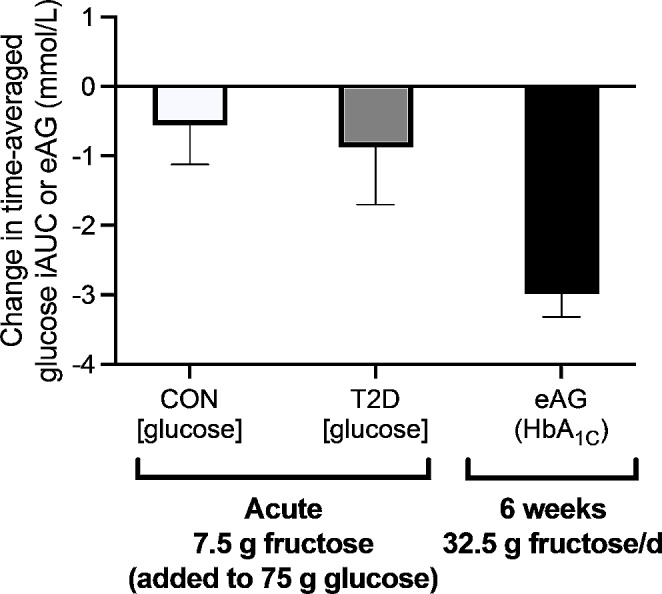
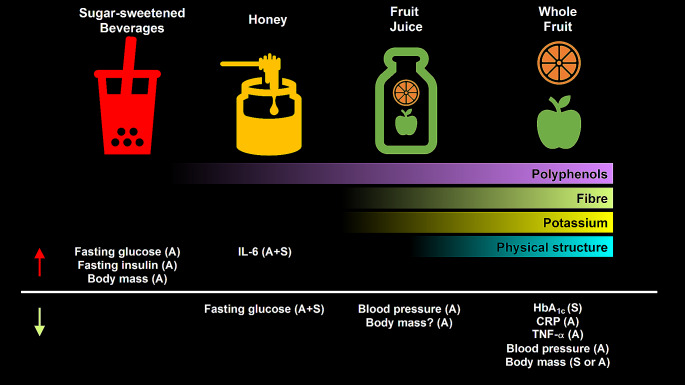
High (free) sugar intakes can increase self-reported energy intake and are associated with unfavourable cardiometabolic health. However, sugar source may modulate the effects of sugars due to several mechanisms including the food matrix. The aim of this review was to assess the current state of evidence in relation to food source effects on the physiological responses to dietary sugars in humans relevant to cardiometabolic health. An additional aim was to review potential mechanisms by which food sources may influence such responses. Evidence from meta-analyses of controlled intervention trials was used to establish the balance of evidence relating to the addition of sugars to the diet from sugar-sweetened beverages, fruit juice, honey and whole fruit on cardiometabolic outcomes. Subsequently, studies which have directly compared whole fruit with fruit juices, or variants of fruit juices, were discussed. In summary, the sources of sugars can impact physiological responses, with differences in glycaemic control, blood pressure, inflammation, and acute appetite. Longer-term effects and mechanisms require further work, but initial evidence implicates physical structure, energy density, fibre, potassium and polyphenol content, as explanations for some of the observed responses.
Keywords: Food matrix; Glycaemia; Health; Metabolism; Sugars.
© 2024. The Author(s).
Figures
Similar articles
-
Food sources of fructose-containing sugars and glycaemic control: systematic review and meta-analysis of controlled intervention studies.BMJ. 2018 Nov 21;363:k4644. doi: 10.1136/bmj.k4644. BMJ. 2018. PMID: 30463844 Free PMC article.
-
Important Food Sources of Fructose-Containing Sugars and Non-Alcoholic Fatty Liver Disease: A Systematic Review and Meta-Analysis of Controlled Trials.Nutrients. 2022 Jul 12;14(14):2846. doi: 10.3390/nu14142846. Nutrients. 2022. PMID: 35889803 Free PMC article.
-
Cross-sectional association between sugar-sweetened beverage intake and cardiometabolic biomarkers in US women.Br J Nutr. 2018 Mar;119(5):570-580. doi: 10.1017/S0007114517003841. Br J Nutr. 2018. PMID: 29508692 Free PMC article.
-
Association of Major Food Sources of Fructose-Containing Sugars With Incident Metabolic Syndrome: A Systematic Review and Meta-analysis.JAMA Netw Open. 2020 Jul 1;3(7):e209993. doi: 10.1001/jamanetworkopen.2020.9993. JAMA Netw Open. 2020. PMID: 32644139 Free PMC article.
-
Distinct Impact of Natural Sugars from Fruit Juices and Added Sugars on Caloric Intake, Body Weight, Glycaemia, Oxidative Stress and Glycation in Diabetic Rats.Nutrients. 2021 Aug 25;13(9):2956. doi: 10.3390/nu13092956. Nutrients. 2021. PMID: 34578832 Free PMC article.
Cited by
-
Sugar-Sweetened Beverages, Artificially Sweetened Beverages and Sugar Forms With Long-Term Risk of Irritable Bowel Syndrome: A Large-Scale Prospective Cohort Study.Food Sci Nutr. 2025 Mar 19;13(3):e70094. doi: 10.1002/fsn3.70094. eCollection 2025 Mar. Food Sci Nutr. 2025. PMID: 40115249 Free PMC article.
-
Exploring the Influence of Acid-Base Status on Athletic Performance during Simulated Three-Day 400 m Race.Nutrients. 2024 Jun 21;16(13):1987. doi: 10.3390/nu16131987. Nutrients. 2024. PMID: 38999735 Free PMC article. Clinical Trial.
-
Fructose intake enhances lipoteichoic acid-mediated immune response in monocytes of healthy humans.Redox Biol. 2025 Jun 12;85:103729. doi: 10.1016/j.redox.2025.103729. Online ahead of print. Redox Biol. 2025. PMID: 40517600 Free PMC article.
-
Dietary Strategies in the Prevention and Treatment of Hypertension in Children and Adolescents: A Narrative Review.Nutrients. 2024 Aug 21;16(16):2786. doi: 10.3390/nu16162786. Nutrients. 2024. PMID: 39203922 Free PMC article. Review.
References
-
- Bates B, Collins D, Jones K, Page P, Roberts C, Steer T, Swan G (2020) NDNS: results from years 9 to 11 (2016 to 2017 and 2018 to 2019). https://www.gov.uk/government/statistics/ndns-results-from-years-9-to-11...
-
- Koutsos A, Riccadonna S, Ulaszewska MM, Franceschi P, Trošt K, Galvin A, Braune T, Fava F, Perenzoni D, Mattivi F (2020) Two apples a day lower serum cholesterol and improve cardiometabolic biomarkers in mildly hypercholesterolemic adults: a randomized, controlled, crossover trial. Am J Clin Nutr 111(2):307–318 - PMC - PubMed
-
- Ravn-Haren G, Dragsted LO, Buch-Andersen T, Jensen EN, Jensen RI, Németh-Balogh M, Paulovicsová B, Bergström A, Wilcks A, Licht TR (2013) Intake of whole apples or clear apple juice has contrasting effects on plasma lipids in healthy volunteers. Eur J Nutr 52:1875–1889 - PubMed
Publication types
MeSH terms
Substances
Grants and funding
LinkOut - more resources
Full Text Sources
Medical
