. 2024 Apr 22;4(4):100728.
doi: 10.1016/j.crmeth.2024.100728. Epub 2024 Mar 15.

An engineering strategy to target activated EGFR with CAR T cells

Affiliations

An engineering strategy to target activated EGFR with CAR T cells

Markus Dobersberger et al. Cell Rep Methods. .

Abstract

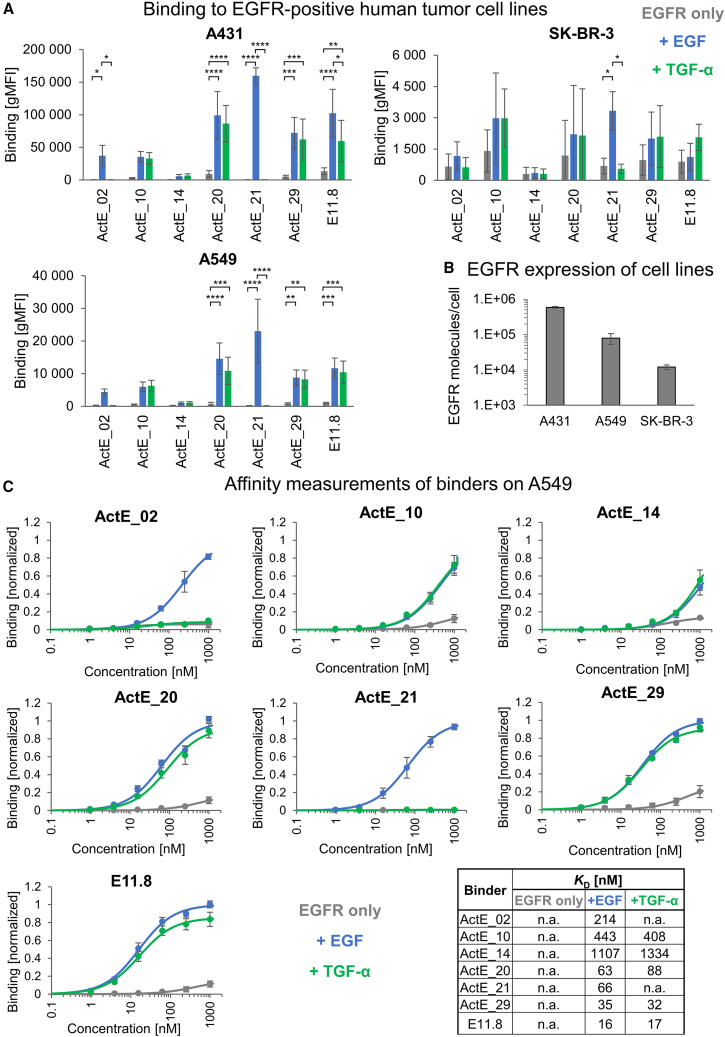
Chimeric antigen receptor (CAR) T cells have shown remarkable response rates in hematological malignancies. In contrast, CAR T cell treatment of solid tumors is associated with several challenges, in particular the expression of most tumor-associated antigens at lower levels in vital organs, resulting in on-target/off-tumor toxicities. Thus, innovative approaches to improve the tumor specificity of CAR T cells are urgently needed. Based on the observation that many human solid tumors activate epidermal growth factor receptor (EGFR) on their surface through secretion of EGFR ligands, we developed an engineering strategy for CAR-binding domains specifically directed against the ligand-activated conformation of EGFR. We show, in several experimental systems, that the generated binding domains indeed enable CAR T cells to distinguish between active and inactive EGFR. We anticipate that this engineering concept will be an important step forward to improve the tumor specificity of CAR T cells directed against EGFR-positive solid cancers.

Keywords: CAR T cells; CP: cancer biology; EGF; Nur77 reporter cell line; TGF-α; activated EGFR; antigen-binding domain; conformational specificity; protein engineering strategy; protein-protein interaction; yeast surface display technology.


Conflict of interest statement

Declaration of interests M.L. and M.W.T. receive funding from Miltenyi Biotec.

Figures

None
Graphical abstract
Figure 1
Figure 1
Schematic representation of an engineered binder interacting with activated EGFR Schematic overview of the interaction between the engineered binding scaffold rcSso7d (engineered binding surface in orange; PDB: 1SSO29) with inactive monomeric vs. ligand-activated dimeric EGFR. Different gray colors in the schematic EGFR structures represent the four domains of the extracellular part of EGFR. Dimeric EGFR is bound to EGF, shown in blue. Created with BioRender.com.
Figure 2
Figure 2
Engineering strategy and biophysical analysis of generated binders (A) Schematic of soluble EGFR-Fc (loaded with EGF, shown in blue) bound to engineered rcSso7d displayed on yeast with monoclonal antibodies for the detection of binding and display level. (B) Representative dot plots with the gating strategy in a positive selection (in the presence of both EGFR-Fc and an EGFR ligand) and a negative selection (presence of EGFR-Fc but absence of EGFR-ligands). (C) SEC profiles of selected ActE-binders and E11.8. One representative of three independent experiments is shown. (D) Tm values of ActE-binders and E11.8 determined by DSC (mean ± SD of three independent experiments). Created with BioRender.com.
Figure 3
Figure 3
Engineered binders interact with EGFR-Fc in a ligand-dependent manner (A) Binders were displayed on the surface of yeast and tested for binding to 15 nM soluble EGFR-Fc in the absence of EGFR ligands or presence of 100 nM EGF or TGF-α. Binding to EGFR-Fc was measured by flow cytometry, followed by calculation of the geometric mean fluorescence intensity (gMFI). EGFR without EGFR ligands is shown in gray, EGF-loaded EGFR in blue, and TGF-α-loaded EGFR in green (mean ± SD of three independent experiments). (B) Binding of ActE_21 to labeled EGFR as a function of EGF concentration. Binding of ActE_21 to 10 nM soluble labeled EGFR-Fc in the presence of increasing concentrations (0–10,000 nM) of unlabeled EGF. The binding signal is normalized to the highest EGF concentration (mean ± SD of three independent experiments). All gMFI values were background subtracted. Created with BioRender.com.
Figure 4
Figure 4
Recognition of EGFR-positive human tumor cells in a ligand-dependent manner (A) EGFR-positive human tumor cell lines were incubated with engineered binders (100 nM, expressed as SUMO fusion proteins) in the absence (gray) or presence of 100 nM EGF (blue) or TGF-α (green), followed by flow cytometry analysis of bound binders (mean ± SD of three independent experiments). Statistical significance was calculated via two-way ANOVA and Sidak’s multiple-comparisons test (∗∗∗∗p < 0.0001, ∗∗∗p < 0.001, ∗∗p < 0.01, ∗p < 0.05). (B) EGFR levels on the surface of A431, A549, and SK-BR-3, measured by flow cytometry and quantification beads (mean ± SD of three independent experiments). (C) Binders were titrated on A549 cells in the absence (gray) or presence of 100 nM EGF (blue) or TGF-α (green). Subsequently, binding intensity was analyzed by flow cytometry. Data were normalized to the maximum signal in the presence of EGF and fitted to a 1:1 binding model to calculate the KD values as shown in the table (mean ± SD of three independent experiments). In (A) and (C), all gMFI values were background subtracted. n.a., not analyzable.
Figure 5
Figure 5
Generation of a Jurkat Nur77 reporter cell line (A) Schematic of the mechanism of the Nur77 reporter cell line. (B) The constitutive expression of mAmetrine by Nur77 reporter cells enables differentiation between target and reporter cells. (C) Flow cytometric analysis of CD19-BBζ CAR expression in Nur77 reporter cells. (D) Representative dot plots depicting the activation (mKO2 expression) of Nur77 reporter cells expressing the CD19-BBζ CAR compared with Mock cells (Nur77 reporter cells not expressing any CAR) in co-culture with CD19 or CD19+ target cells. (E) Percentage of activated Nur77 reporter cells expressing the CD19-BBζ CAR compared with Mock cells (no CAR) either alone (without target cells) or after co-culture with CD19 and CD19+ target cells (mean ± SD of three independent experiments). Created with BioRender.com. See also Figure S6A.
Figure 6
Figure 6
Testing of CARs based on ActE-binders in Jurkat Nur77 reporter cells (A) Schematic of the different components of the CARs and experimental readout. (B) Jurkat Nur77 reporter cells expressing the indicated CARs based on different binders and backbones (BBζ and 28ζ, respectively) alone (CAR only) or in co-culture with target cells in the absence (gray) or presence of 100 nM EGF (blue) or TGF-α (green). The activation level was determined by measuring the mKO2 expression by flow cytometry. Data are presented as mean ± SD of three independent experiments, and statistical significance was calculated via two-way ANOVA with a Tukey post hoc test (∗∗∗p < 0.001, ∗∗p < 0.01, ∗p < 0.05). Created with BioRender.com. See also Figure S6B.
Figure 7
Figure 7
ActE-based CAR T cells specifically respond to ligand-activated EGFR (A) Flow cytometry analysis of CAR expression in T cells from two donors for the indicated CAR constructs. (B) The indicated CAR T cells were co-cultured with target cells at a 1:1 ratio in the absence (gray) or presence of 100 nM EGF (blue) or TGF-α (green) for 4 h, and secreted IFN-γ was measured in the supernatant by ELISA. Mock T cells only (no CAR, black) were not co-cultured with target cells. (C) CAR T cells were co-cultured with target cells at a 2.5:1 effector-to-target (E:T) ratio in the absence (gray) or presence of 100 nM EGF (blue) for 4 h, and lysis was determined by using a luciferase-based assay. Circles and triangles indicate the different donors, B1 and B3, respectively. Statistical significance was calculated via two-way repeated-measures ANOVA with a Tukey post hoc test in (B) (n = 6) and Sidak’s multiple-comparisons test in (C) (n = 4) (∗∗∗∗p < 0.0001, ∗∗∗p < 0.001, ∗∗p < 0.01, ∗p < 0.05). See also Figure S6C.

References

    1. Chen J., Zeng F., Forrester S.J., Eguchi S., Zhang M.Z., Harris R.C. Expression and Function of the Epidermal Growth Factor Receptor in Physiology and Disease. Physiol. Rev. 2016;96:1025–1069. doi: 10.1152/physrev.00030.2015. - DOI - PubMed
    1. Sigismund S., Avanzato D., Lanzetti L. Emerging functions of the EGFR in cancer. Mol. Oncol. 2018;12:3–20. doi: 10.1002/1878-0261.12155. - DOI - PMC - PubMed
    1. Yarden Y., Pines G. The ERBB network: at last, cancer therapy meets systems biology. Nat. Rev. Cancer. 2012;12:553–563. doi: 10.1038/nrc3309. - DOI - PubMed
    1. Arena S., Bellosillo B., Siravegna G., Martínez A., Cañadas I., Lazzari L., Ferruz N., Russo M., Misale S., González I., et al. Emergence of Multiple EGFR Extracellular Mutations during Cetuximab Treatment in Colorectal Cancer. Clin. Cancer Res. 2015;21:2157–2166. doi: 10.1158/1078-0432.CCR-14-2821. - DOI - PubMed
    1. Bagchi A., Haidar J.N., Eastman S.W., Vieth M., Topper M., Iacolina M.D., Walker J.M., Forest A., Shen Y., Novosiadly R.D., Ferguson K.M. Molecular Basis for Necitumumab Inhibition of EGFR Variants Associated with Acquired Cetuximab Resistance. Mol. Cancer Ther. 2018;17:521–531. doi: 10.1158/1535-7163.MCT-17-0575. - DOI - PMC - PubMed

Publication types