. 2024 Mar-Apr;17(2):365-381.
doi: 10.1016/j.brs.2024.03.012. Epub 2024 Mar 16.

Neural mechanisms of the temporal response of cortical neurons to intracortical microstimulation

Affiliations

Neural mechanisms of the temporal response of cortical neurons to intracortical microstimulation

Karthik Kumaravelu et al. Brain Stimul. 2024 Mar-Apr.

Abstract

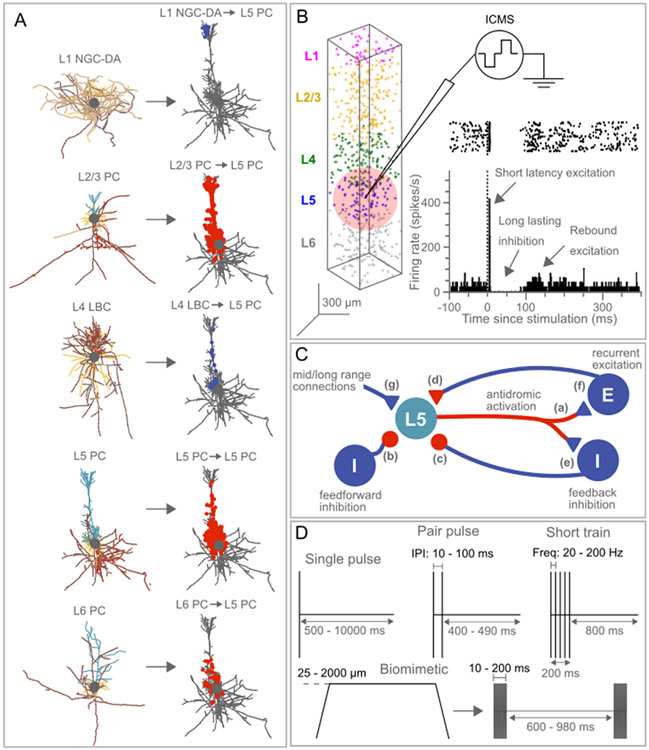
Background: Intracortical microstimulation (ICMS) is used to map neuronal circuitry in the brain and restore lost sensory function, including vision, hearing, and somatosensation. The temporal response of cortical neurons to single pulse ICMS is remarkably stereotyped and comprises short latency excitation followed by prolonged inhibition and, in some cases, rebound excitation. However, the neural origin of the different response components to ICMS are poorly understood, and the interactions between the three response components during trains of ICMS pulses remains unclear.

Objective: We used computational modeling to determine the mechanisms contributing to the temporal response to ICMS in model cortical neurons.

Methods: We implemented a biophysically based computational model of a cortical column comprising neurons with realistic morphology and synapses and quantified the temporal response of cortical neurons to different ICMS protocols. We characterized the temporal responses to single pulse ICMS across stimulation intensities and inhibitory (GABA-B/GABA-A) synaptic strengths. To probe interactions between response components, we quantified the response to paired pulse ICMS at different inter-pulse intervals and the response to short trains at different stimulation frequencies. Finally, we evaluated the performance of biomimetic ICMS trains in evoking sustained neural responses.

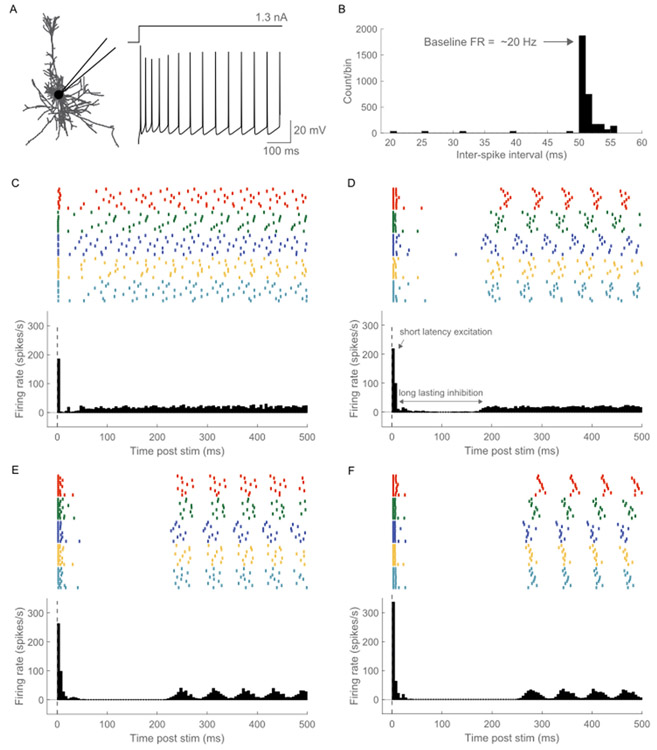
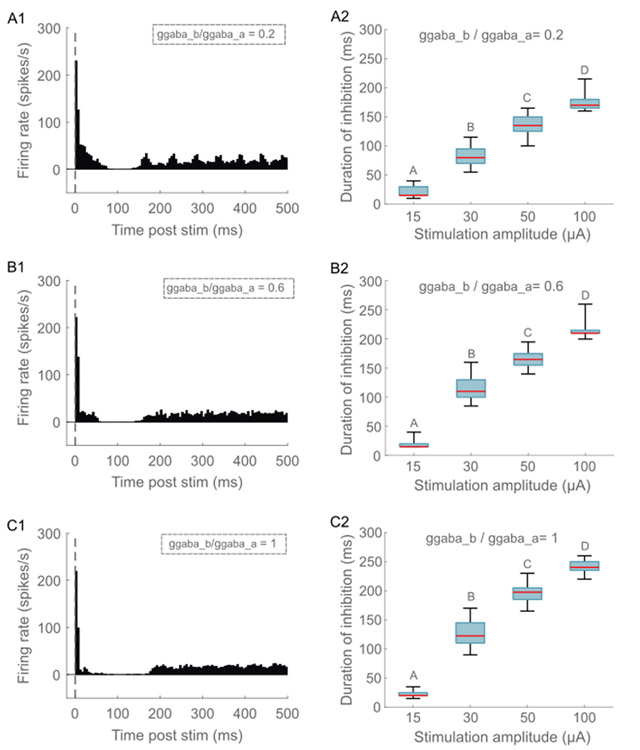
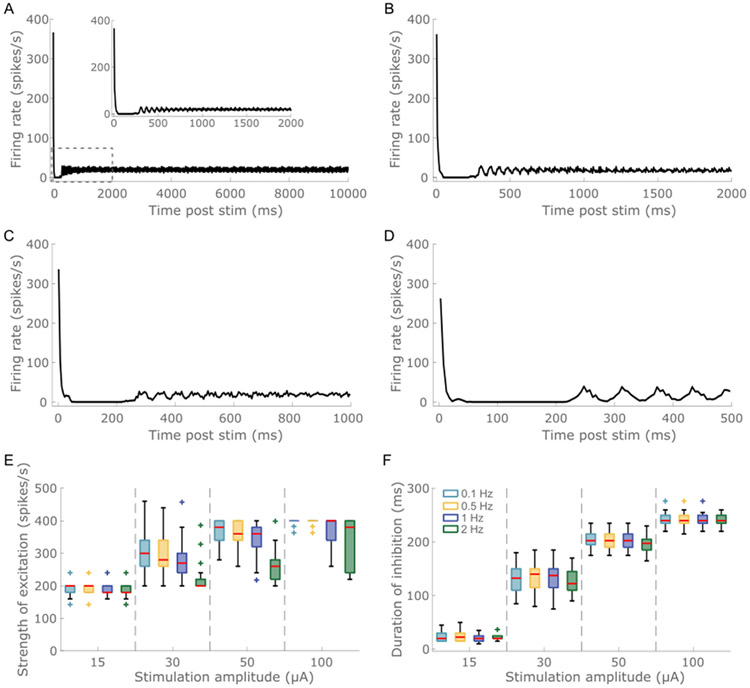
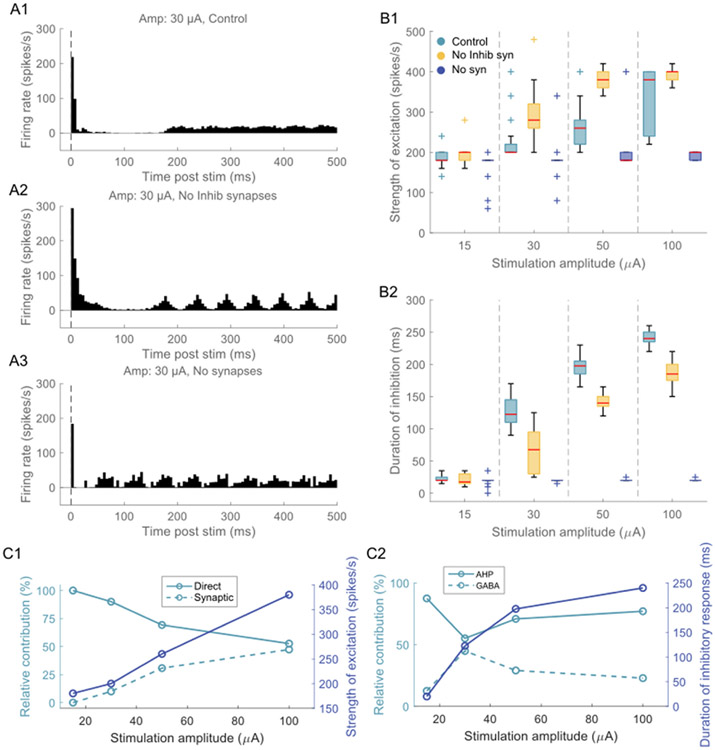
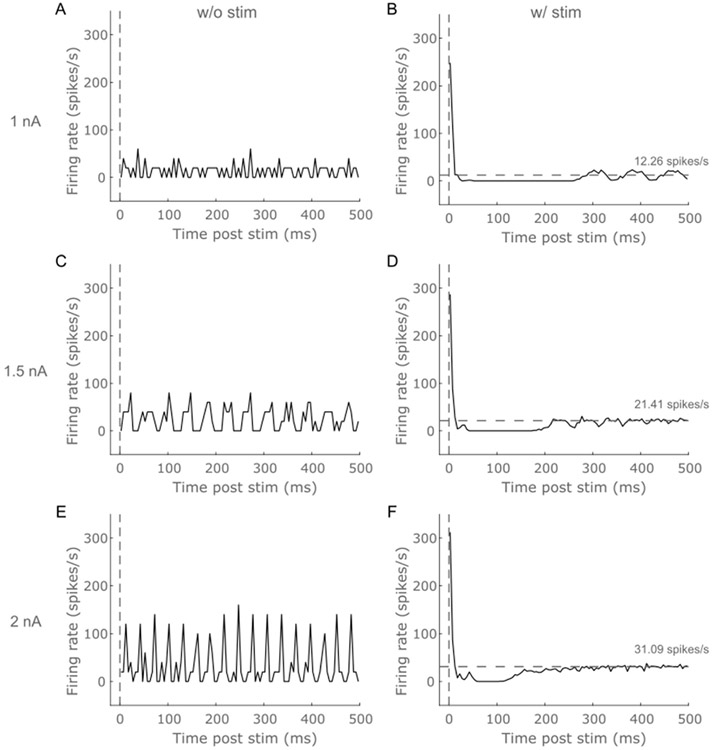
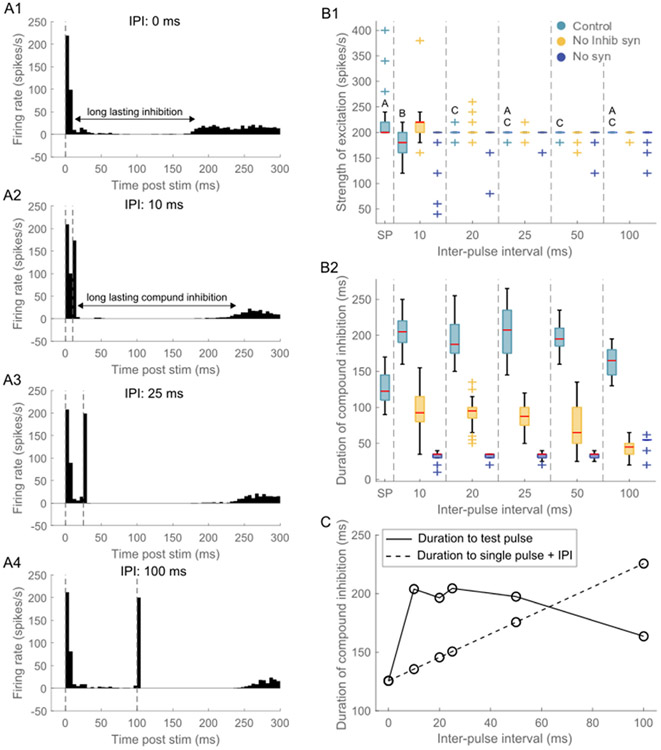
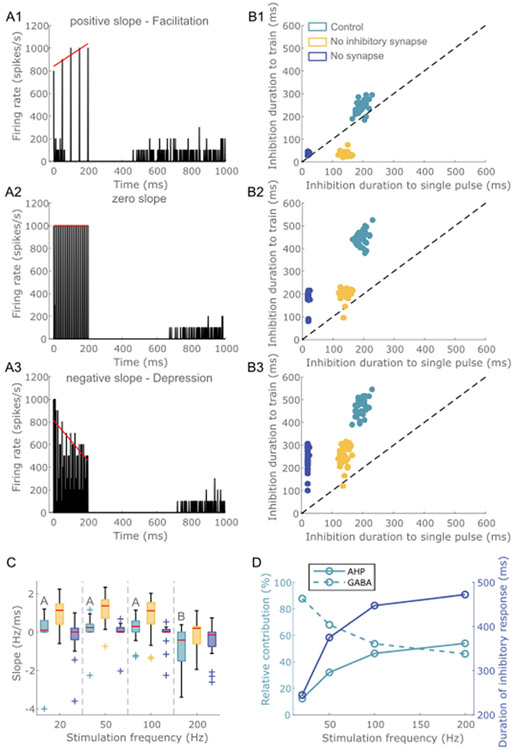
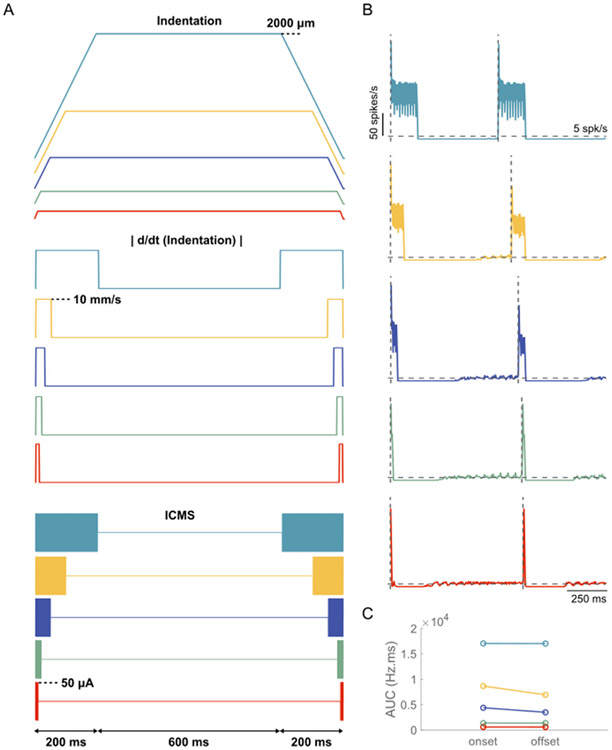
Results: Single pulse ICMS evoked short latency excitation followed by a period of inhibition, but model neurons did not exhibit post-inhibitory excitation. The strength of short latency excitation increased and the duration of inhibition increased with increased stimulation amplitude. Prolonged inhibition resulted from both after-hyperpolarization currents and GABA-B synaptic transmission. During the paired pulse protocol, the strength of short latency excitation evoked by a test pulse decreased marginally compared to those evoked by a single pulse for interpulse intervals (IPI) < 100 m s. Further, the duration of inhibition evoked by the test pulse was prolonged compared to single pulse for IPIs <50 m s and was not predicted by linear superposition of individual inhibitory responses. For IPIs>50 m s, the duration of inhibition evoked by the test pulse was comparable to those evoked by a single pulse. Short ICMS trains evoked repetitive excitatory responses against a background of inhibition. However, the strength of the repetitive excitatory response declined during ICMS at higher frequencies. Further, the duration of inhibition at the cessation of ICMS at higher frequencies was prolonged compared to the duration following a single pulse. Biomimetic pulse trains evoked comparable neural response between the onset and offset phases despite the presence of stimulation induced inhibition.

Conclusions: The cortical column model replicated the short latency excitation and long-lasting inhibitory components of the stereotyped neural response documented in experimental studies of ICMS. Both cellular and synaptic mechanisms influenced the response components generated by ICMS. The non-linear interactions between response components resulted in dynamic ICMS-evoked neural activity and may play an important role in mediating the ICMS-induced precepts.

Keywords: Cortical column; Intracortical microstimulation; Long-lasting inhibition; Neural model; Rebound excitation; Short latency excitation.


Conflict of interest statement

Declaration of competing interest The authors declare that they have no known competing financial interests or personal relationships that could have appeared to influence the work reported in this paper.

Figures

Fig. 1.
Fig. 1.
Biophysically-based computational model of intracortical microstimulation (ICMS) somatosensory cortex. (A) 3D morphology of Layer (L)-1 neuroglial cell, L2/3 pyramidal cell (PC), L4 basket cell, L5 thick tufted (TT) PC, L6 thick (T) PC. Model neurons were adapted from the Blue Brain library and had realistic axon morphologies [27,28]. Blue - apical dendrites, yellow-basal dendrites, brown - unmyelinated axon, gray - myelin, red - nodes of Ranvier, filled gray circle - soma. Model axons were myelinated, and the diameter range was consistent with those found in rhesus macaques [28,30]. Synaptic inputs to L5 PC from L1 NGC-DA, L2/3 PC, L4 LBC, L5 PC and L6 PC are shown in (A). Each cortical neuron (L1 NGC-DA, L2/3 PC, L4 LBC, L5 PC and L6 PC) received synaptic inputs from 55 presynaptic sources. All sources were cortical and did not include connections from other structures such as the thalamus, subcortex, etc. Excitatory and inhibitory postsynaptic compartments are shown in red and blue-filled circles, respectively. Inhibitory synapses included GABA-A + GABA-B receptors and excitatory synapses included AMPA + NMDA receptors. The probability of synaptic activation to extracellular stimulation was an exponential function of the distance of the synapse from the electrode tip. (B) Cortical neurons were arranged in a column comprising five layers with dimensions of 400 μm × 400 μm × 2000 μm. Cortical thickness was determined from histological sections of the somatosensory cortex in the rhesus macaque [31], and the relative thickness of each layer was based on estimates from the visual cortex of rhesus macaque [32]. A uniform density of 20000 neurons/ mm3 was used across all layers, resulting in a total cell count of 6410 neurons for the cortical column. The stimulation electrode was in L5, and the neural response was recorded from L5 PCs with somas located within 150 μm from the stimulation electrode. The light pink circle indicates the recording volume around the stimulation electrode. The inset shows the stereotyped temporal response (raster and PSTH) to suprathreshold ICMS recorded experimentally in cortical neurons of rats including short latency excitation followed by a long-lasting inhibition and rebound excitation [1]. (C) Factors modulating the temporal response of L5 PC close to the stimulating microelectrode. The temporal response would be influenced by (a) direct activation of L5 PC, i.e., antidromic activation of soma due to direct activation of axon terminals, (b) synaptic activation of feedforward inhibitory terminals, (c) synaptic activation of feedback inhibitory terminals, (d) synaptic activation of recurrent excitatory terminals, (e) feedback inhibition due to activation of L5 PC → Interneurons → L5 PC, (f) recurrent excitation due to activation of L5 PC → other PC → L5 PC, and (g) synaptic activation of medium/long-range excitatory inputs (i.e., inputs from other cortical/subcortical regions). Neural elements marked in red show the effects captured in the model. E and I represent excitatory and inhibitory neurons, respectively. Triangular and circular terminals indicate excitatory and inhibitory synapses, respectively. (D) Four different ICMS protocols used in the model simulations: single pulse at different stimulation intensities/intervals, paired pulses at different inter-pulse intervals, short trains at different stimulation frequencies, and biomimetic stimulus at various indentation depths.
Fig. 2.
Fig. 2.
Properties of the (Tsodyks-Markram) GABA-B synapse. Inhibitory postsynaptic current (IPSC) showing dynamics of facilitating, depressing and pseudo-linear synapse in response to low (2, 20 Hz) and high (100, 200 Hz) frequency stimulation. The horizontal dashed line indicates 0 pA. See Supplementary Figs. S2-S4 for dynamics of other synapse types.
Fig. 3.
Fig. 3.
Temporal response of model neurons to ICMS at different stimulation intensities. (A) The intrinsic activity was generated by injecting a 1.3 nA dc current intracellularly into the soma of each neuron. (B) Inter-spike interval (ISI) histogram of baseline activity generated via injecting 1.3 nA dc into the soma of L5 PC. The model neurons exhibited a 20 Hz firing activity. Raster (top) and poststimulus time histogram (PSTH, below) to ICMS at (C) 15 μA, (D) 30 μA, (E) 50 μA and (F) 100 μA. Stimulation delivered at 2 Hz comprised a single biphasic pulse (cathodic first) with a fixed width of 200 μs/phase and an interphase interval of 50 μs. The stimulation electrode was in L5. Each color in the raster denotes a different L5 PC; within each neuron, a row represents one stimulus trial. The PSTH response was averaged across 34 L5 PCs with somas located within 150 μm from the stimulation electrode. The gGABAAgGABAB ratio was set at 1. A bin width of 5 m s was used to bin spike times. The temporal response to ICMS comprised short latency excitation followed by long-lasting inhibition. The strength of the excitatory response increased with stimulation intensity. Further, the duration of the inhibitory became longer with increased stimulation magnitude.
Fig. 4.
Fig. 4.
Model neuron responses to ICMS for different levels of GABA-B synaptic strength. PSTH response to ICMS at 30 μA and gGABAAgGABAB ratio of (A1) 0.2, (B1) 0.6, and (C1) 1. The response was averaged across 34 L5 PCs with somas located within 150 μm from the stimulation electrode. The intrinsic activity was generated by injecting 1.3 nA into the soma of neurons. A bin width of 5 m s was used to bin spike times. Duration of long-lasting inhibitory response as a function of ICMS amplitude for gGABAAgGABAB ratio of (A2) 0.2, (B2) 0.6, (C2) 1. Stimulation intensities that do not share the same letter are significantly different (p < 0.05, Dunn/Sidak method). For each box, the central mark indicates the median duration across neurons, the bottom and top edges of the box indicate the 25th and 75th percentiles, and whiskers extend to 1.5 times the interquartile range. The duration of inhibition was shorter for weaker GABA-B synapses compared to stronger synapses. Further, the duration of inhibition increased with stimulation intensity.
Fig. 5.
Fig. 5.
Model neuron response to single pulse ICMS delivered at different repetition rates. Stimulus triggered response to 50 μA ICMS pulse delivered at (A) 0.1 Hz, (B) 0.5 Hz, (C) 1 Hz and (D) 2 Hz. The inset in panel A shows the response to 0.1 Hz stimulation at a shorter time scale. For each condition, the stimulus triggered response was averaged across 10 pulses. The gGABAAgGABAB ratio was set at 1. Refer to Supplementary Fig. S19 for response to 100 μA ICMS pulse at different repetition rates. (E) The peak of the excitatory response as a function of stimulation amplitude across the four repetition rates. (F) Duration of inhibition as a function of stimulation amplitude for the four repetition rates. Each color box represents a different repetition rate: 0.1 Hz (light blue), 0.5 Hz (yellow), 1 Hz (dark blue), 2 Hz (green). For each box, the central mark indicates the median slope across neurons, the bottom and top edges of the box indicate the 25th and 75th percentiles, whiskers extend to 1.5 times the interquartile range, and the plus signs indicate outliers.
Fig. 6.
Fig. 6.
Temporal response of model neurons to ICMS at 30 μA and gGABAAgGABAB ratio of 1 for (A1) control condition (intact synapses), (A2) without inhibitory synapses, (A3) without inhibitory and excitatory synapses. The vertical dashed line indicates onset of stimulation. The response was averaged across 34 L5 PCs with somas located within 150 μm from the stimulation electrode. A bin width of 5 m s was used to bin spike times. (B1) The peak of the excitatory response as a function of stimulation amplitude for the three conditions. (B2) Duration of inhibition as a function of stimulation amplitude for the three conditions. Each color box represents a different simulation condition: control condition (light blue), without inhibitory synapses (yellow), without inhibitory and excitatory synapses (dark blue). For each box, the central mark indicates the median slope across neurons, the bottom and top edges of the box indicate the 25th and 75th percentiles, whiskers extend to 1.5 times the interquartile range, and the plus signs indicate outliers. Refer to Supplementary Figs. S20-S21 for other gGABAAgGABAB ratios. (C1) Relative contribution of direct vs. synaptic activation to ICMS-evoked short latency excitatory response. (C2) Relative contribution of afterhyperpolarization (AHP) currents and GABA synapses to ICMS-evoked inhibitory response.
Fig. 7.
Fig. 7.
Effect of different mean intrinsic firing rates on the temporal response to ICMS at 50 μA and gGABAAgGABAB ratio of 1. Stimulus triggered response without ICMS for intracellular current injection of (A) 1 nA, (C) 1.5 nA, (E) 2 nA. Stimulus triggered response with ICMS for current injection levels of (B) 1 nA, (D) 1.5 nA, (F) 2 nA. Increasing current injection levels yielded higher mean intrinsic firing rate indicated by the horizontal dashed line. The duration of the inhibitory response is reduced with an increased mean firing rate. Further, the magnitude of the short latency excitatory response increased with the firing rate.
Fig. 8.
Fig. 8.
Response of model neurons to paired pulse ICMS. (A1) PSTH response to a single (conditioning) pulse applied at t=0 ms. Response to paired pulses with conditioning pulse applied at t=0 ms and test pulse applied at an inter-pulse interval (IPI) of (A2) 10 m s, (A3) 25 m s, (A4) 100 m s. The vertical dashed lines indicate the timing of the control and test pulses. The paired pulse stimulation was applied at 2 Hz and 30 μA. The conditioning pulse was applied at the same amplitude as the test pulse. Further, the interval of the test pulse was chosen to fall within the duration of the inhibitory response generated by the control pulse. The gGABAAgGABAB ratio was set at 1. A bin width of 5 m s was used to bin spike times. (B1) Strength of short latency excitatory response to test pulse at different IPIs for the three conditions. Each color box represents a different simulation condition: control condition (light blue), without inhibitory synapses (yellow), without inhibitory and excitatory synapses (dark blue). SP refers to the single pulse response. For the control condition, IPIs and SP that do not share the same letter are significantly different (p < 0.05, Dunn-Sidak method). For each box, the central mark indicates the median slope across neurons, the bottom and top edges of the box indicate the 25th and 75th percentiles, whiskers extend to 1.5 times the interquartile range, and the plus signs indicate outliers. The strength of excitatory response to test pulse decreased marginally compared to a single pulse and this effect was consistent across all stimulation intensities. This decrease can be attributed to the inhibitory effect triggered by the conditioning pulse. (B2) Duration of compound inhibitory response as a function of IPIs across the three simulation conditions. (C) The duration of inhibitory response to test pulse at 30 μA. Solid trace shows the inhibition duration to test pulses, whereas the dashed line indicates the duration predicted by linear superposition of individual inhibitory responses, i.e., duration of inhibition following single pulse + IPI. There was supra-linear addition of individual inhibitory responses for IPIs ≤50 m s and a sub-linear addition for IPIs >50 m s.
Fig. 9.
Fig. 9.
Model response to short trains of ICMS at different frequencies. A line was fit to the peak short latency excitatory responses evoked by each pulse within the stimulus train. Model neurons exhibited three types of response dynamics: (A1) Positive slope - facilitation of the short latency excitatory response with the progression of the ICMS train, (A2) Zero slope – no change in the excitatory response during the train, (A3) Negative slope – decline of the short latency excitatory response with the progression of the ICMS train. A bin width of 1 m s was used to bin spike times for panels in A. The gGABAAgGABAB ratio was set at 1. Correlation of inhibition duration at the end of the train with inhibition duration following single pulse stimulation for short trains at frequencies (B1) 20 Hz, (B2) 100 Hz, (B3) 200 Hz. Each dot represents the duration of inhibition of each 34 L5 PCs across three conditions: control condition (light blue), without inhibitory synapses (yellow), without inhibitory and excitatory synapses (dark gray). The inhibition duration at the end of the ICMS train was longer than the duration following a single pulse for trains at higher stimulus frequencies compared to lower ones. (C) The slope of the line fit to the excitatory response as a function of stimulation frequency. For the control condition, stimulation frequencies that do not share the same letter are significantly different (p < 0.05, Dunn-Sidak method). For each box, the central mark indicates the median slope across neurons, the bottom and top edges of the box indicate the 25th and 75th percentiles, whiskers extend to 1.5 times the interquartile range, and the plus signs indicate outliers. Each color box represents a different simulation condition: control condition (light blue), without inhibitory synapses (yellow), and without inhibitory and excitatory synapses (dark blue). Most neurons exhibited a negative slope at higher stimulation frequencies. Refer to Supplementary Fig. S26 for other gGABAAgGABAB ratios. (D) Relative contribution of AHP currents and GABA synaptic transmission to ICMS-induced inhibitory response.
Fig. 10.
Fig. 10.
Temporal response of model neurons to biomimetic ICMS trains. (A) 1-s long trapezoidal indentations delivered at a rate of 10 mm/s and depths ranging from 25 to 2000 μm. Absolute value of the first derivative of trapezoidal indentations ddt(indentation). ICMS trains linearly mapped from ddt(indentation). The onset/offset phases comprised cathodic first biphasic pulses with a fixed width of 200 μs/phase, interphase interval of 50 μs, frequency of 300 Hz and an amplitude of 50 μA. The temporal response of model neurons to biomimetic ICMS trains with onset/offset phase duration of (B1) 200 m s, (B2) 100 m s, (B3) 50 m s, (B4) 20 m s, (B5) 10 m s. The gGABAAgGABAB ratio was set at 1. The horizontal dashed line indicates the mean firing rate (~5 Hz) and vertical dashed line indicates onset of stimulation phases. A bin width of 5 m s was used to bin spike times. (C) Comparison of area under the curve of the responses during the onset and offset phases of the biomimetic ICMS trains.

Similar articles

Cited by

References

    1. Butovas S, Schwarz C. Spatiotemporal effects of microstimulation in rat neocortex: a parametric study using multielectrode recordings. J Neurophysiol 2003;90(5): 3024–39. - PubMed
    1. Logothetis NK, et al. The effects of electrical microstimulation on cortical signal propagation. Nat Neurosci 2010;13(10):1283. - PubMed
    1. Shelchkova ND, et al. Microstimulation of human somatosensory cortex evokes task-dependent, spatially patterned responses in motor cortex. Nat Commun 2023; 14(1):7270. - PMC - PubMed
    1. Flesher SN, et al. Intracortical microstimulation of human somatosensory cortex. Sci Transl Med 2016;8(361):361ra141. 361ra141. - PubMed
    1. Brindley GS, Lewin WS. The sensations produced by electrical stimulation of the visual cortex. J Physiol 1968;196(2):479–93. - PMC - PubMed

Publication types