. 2024 Aug;167(3):469-484.
doi: 10.1053/j.gastro.2024.03.009. Epub 2024 Mar 15.

Amphiregulin Switches Progenitor Cell Fate for Lineage Commitment During Gastric Mucosal Regeneration

Affiliations

Amphiregulin Switches Progenitor Cell Fate for Lineage Commitment During Gastric Mucosal Regeneration

Su-Hyung Lee et al. Gastroenterology. 2024 Aug.

Abstract

Background & aims: Isthmic progenitors, tissue-specific stem cells in the stomach corpus, maintain mucosal homeostasis by balancing between proliferation and differentiation to gastric epithelial lineages. The progenitor cells rapidly adopt an active state in response to mucosal injury. However, it remains unclear how the isthmic progenitor cell niche is controlled during the regeneration of damaged epithelium.

Methods: We recapitulated tissue recovery process after acute mucosal injury in the mouse stomach. Bromodeoxyuridine incorporation was used to trace newly generated cells during the injury and recovery phases. To define the epithelial lineage commitment process during recovery, we performed single-cell RNA-sequencing on epithelial cells from the mouse stomachs. We validated the effects of amphiregulin (AREG) on mucosal recovery, using recombinant AREG treatment or AREG-deficient mice.

Results: We determined that an epidermal growth factor receptor ligand, AREG, can control progenitor cell lineage commitment. Based on the identification of lineage-committed subpopulations in the corpus epithelium through single-cell RNA-sequencing and bromodeoxyuridine incorporation, we showed that isthmic progenitors mainly transition into short-lived surface cell lineages but are less frequently committed to long-lived parietal cell lineages in homeostasis. However, mucosal regeneration after damage directs the lineage commitment of isthmic progenitors towards parietal cell lineages. During recovery, AREG treatment promoted repopulation with parietal cells, while suppressing surface cell commitment of progenitors. In contrast, transforming growth factor-α did not alter parietal cell regeneration, but did induce expansion of surface cell populations. AREG deficiency impairs parietal cell regeneration but increases surface cell commitment.

Conclusions: These data demonstrate that different epidermal growth factor receptor ligands can distinctly regulate isthmic progenitor-driven mucosal regeneration and lineage commitment.

Keywords: Amphiregulin; Epidermal Growth Factor Receptor; Isthmic Progenitor Cell; Lineage Commitment; Parietal Cell Regeneration.


Conflict of interest statement

Disclosures: The authors have no conflicts of interest.

Figures

Figure 1.
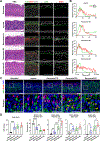
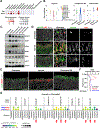
Figure 1.. Mucosal recovery arises sequentially after acute injury.
(A) H&E and immunofluorescence staining for IL33 (surface-committed cells), BrdU (newly generated cells) and nuclear DAPI over time after acute damage. White or green dashed lines demarcate mucosal area or surface layer, respectively. Scale bar=100μm. (B) Profiling of the expression level of IL33 and BrdU across the corpus mucosa (geometric mean, n=3). (C) Immunostaining for H+-K+-ATPase (HKA; parietal cells), BrdU and DAPI. Scale bar=100μm or 50μm for enlarged. (D) Quantitation of total BrdU+ cells or proportion of lineage-specific marker-expressing cells incorporated with BrdU per total BrdU+ cells (mean±SD, n=6–8 images from 3 mice per condition). *P<0.05, **P<0.01, ***P<0.001.
Figure 2.
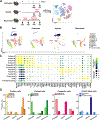
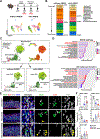
Figure 2.. Single cell RNA-sequencing defines subpopulation of epithelial lineages in the corpus and their dynamic changes during regeneration.
(A) Schematic illustration of the mouse experiment for scRNA-seq. (B) UMAP of 15,790 epithelial cells in 12 color-coded clusters (left), which was divided into three UMAPs according to pathophysiological condition. Each dot in the UMAP indicates an individual cell. (C) Bubble plot of normalized expression of selected lineage-specific marker genes in each lineage subpopulation. (D) Bar graphs representing the proportion of subpopulations described in B.
Figure 3.
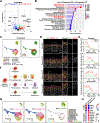
Figure 3.. HMGB2+ progenitor cells generate most of the oxyntic gland cells through lineage-restricted states.
(A) A volcano plot of differentially expressed genes in two progenitor subpopulations. (B) Pathway analysis showing enriched pathways in Progenitor #2 versus Progenitor#1. (C) Trajectory projection of all epithelial cells in the normal condition (left) and the normalized expression of Hmgb2 overlayed onto the trajectory projection (right). (D) IF staining for Ki67, HMGB2 (isthmic progenitor cell) and DAPI. Boxes are enlarged on the right side. Scale bar=100μm or 50μm for enlarged. (E) Profiling of the expression of Ki67 and HMGB2 across the corpus mucosal height (geometric mean value, n=3). (F) Schematic illustration representing lineage transitions from HMGB2+ (red nuclei) isthmic progenitors to HMGB2- (grey nuclei) terminally differentiated lineages. (G) Monocle 3 pseudotime trajectory analyses of all epithelial cells in the normal condition with the different roots; Progenitor #1 (left), Progenitor #2 (middle) or Parietal #2 (right). (H) Bubble plot representing normalized expression levels of lineage-specific genes for surface cells, isthmic progenitor cells or oxyntic gland cells within two progenitor cell subpopulations from untreated corpus.
Figure 4.
Figure 4.. Single cell RNA-sequencing identifies “Pre-parietal cells” and parietal cell hierarchy.
(A) Volcano plot representing DEGs in the two subpopulations of parietal cells and bar graphs of the expression levels of selected genes mainly expressed in progenitor cells (Stmn1 and Hmgb2) or parietal cells (Vegfb, Ghr, Esrrg, Esrra, Cd36 and Apoa4). (B) Lollipop plots showing enriched pathways in Parietal #1 compared with Parietal #2. Red-colored pathways indicate maturation of parietal cells. (C) Pseudotime trajectory analysis of Progenitor #2 and Parietal #1 and #2 clusters (left) from Figure 2B and the normalized expression of Tff2, Atp4a, Hmgb2 and Cd36 overlayed onto the pseudotime trajectory projection. (D) Immunostaining for HMGB2, CD36 and HKA at each time point and quantitation of CD36+ parietal cells with or without HMGB2 expression. Boxes are enlarged on the right side. Arrows indicate CD36+/HKA+ parietal cells with (filled) or without (empty) HMGB2 expression. Data represent mean ± SD (n=55 or 81 cells from total 6 images of 3 mice after 2 days of recovery). Scale bar=100μm or 20μm for enlarged. ***P<0.001.
Figure 5.
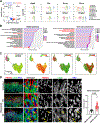
Figure 5.. ErbB signaling is activated in the progenitor cells of gastric corpus after damage.
(A) Bubble plot of normalized expression of Egfr and Erbb2 in each epithelial subpopulation. (B) Bubble plot of normalized expression of Egfr in all epithelial lineages from the injured condition or in Progenitor #2 or Surface #3 clusters from three different conditions. (C) Western blots for tyrosine 1068-phosphorylated EGFR (pEGFR), SOX9 (progenitor cells), PCNA (proliferation), phosphorylated ERK (pERK), total ERK (tERK), pAKT or β-actin loading control for corpus mucosal tissues. (D) Immunostaining for pEGFR, Ki67 and DAPI. Boxes are enlarged on the right. Scale bar=100μm or 50μm for enlarged. (E) Immunostaining for IL33, pERK and DAPI. Scale bar=100μm. (F) Profiling of pERK expression across the corpus mucosal height in different conditions (geometric mean value, n=3 mice). (G) Bubble plot representing enhanced AREG-EGFR or HER2 interaction within the injured epithelial subpopulations compared with normal epithelial cells. Arrows indicate interactions within Progenitor #2, Surface #3 and Parietal #2 populations. Adjusted P-value threshold is 0.001 with 1 million permutations and 10% of cells needed to express a given gene.
Figure 6.
Figure 6.. AREG promotes lineage differentiation into parietal cells during recovery.
(A) Schematic illustration of mouse experiment and UMAPs of 10,276 epithelial cells, composed of 3,356 from recovered and 6,920 from recovered treated with AREG samples, in 12 color-coded clusters based on the projection in Figure 2B. (B) Bar graphs representing the proportion of epithelial subpopulations described in A, arranged according to geographical distribution of the subpopulations. (C) Pseudotime trajectory projection of Progenitor #2, Parietal #1 and Parietal #2 cells showing the influence of AREG on transitions from Progenitor #2 to Parietal #1. Upper panels: a projection of total recovered cells (left) and the expression of Tff2 and Atp4a overlayed (right) onto the projection on the left. The transitions in the left panel are subdivided into three different stages (early, intermediate, and late) based on the expression levels of Tff2 and Atp4a. Lower panels: separated projections of recovered cells according to AREG treatment. (D) Lollipop plots of enriched pathways in AREG-treated cells belonging to the late stage. (E) Immunostaining for BrdU, IL33, HKA and DAPI. Boxes are enlarged on the right. Arrows indicate BrdU-labeled IL33-expressing cells (green) or BrdU-labeled HKA-expressing cells (yellow). Scale bar=100μm or 20μm for enlarged. (F) Quantitation of BrdU-labeled lineage-specific cells per total BrdU+ cells (mean±SD, n=6–7 images from 3 mice per condition). ***P<0.001.
Figure 7.
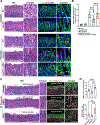
Figure 7.. Two different ligands for EGFR promote distinctive lineage commitment during mucosal recovery.
(A) H&E staining or staining for CD36, BrdU and DAPI. Boxes are enlarged at right. Arrows indicate BrdU-labeled CD36+ newly generated parietal cells. Scale bar=100μm or 50μm for enlarged. (B) Quantitation of BrdU+/CD36+ cells normalized by mucosa area (mean±SD, n=4 images from 3 mice per each untreated condition or 7–16 images from 3 mice per each recovered condition). **P<0.01, ***P<0.001. (C) H&E staining or immunostaining for UEAI (surface cell), BrdU and DAPI. Boxes are enlarged on the right. Dashed lines demarcate surface cell layer. Scale bar=100μm or 50μm for enlarged. (D) Quantitation of UEAI+ area normalized by mucosal area and quantitation of BrdU-labeled UEAI+ cell number normalized by mucosal area (mean±SD, n=5–13 images from 3 mice per each condition). **P<0.01, ***P<0.001.

Similar articles

Cited by

References

    1. Karam SM. Dynamics of epithelial cells in the corpus of the mouse stomach. IV. Bidirectional migration of parietal cells ending in their gradual degeneration and loss. Anat.Rec 1993;236:314–332. - PubMed
    1. Karam SM, Leblond CP. Dynamics of epithelial cells in the corpus of the mouse stomach. I. Identification of proliferative cell types and pinpointing of the stem cells. Anat.Rec 1993;236:259–279. - PubMed
    1. Karam SM, Leblond CP. Dynamics of epithelial cells in the corpus of the mouse stomach. II. Outward migration of pit cells. Anat.Rec 1993;236:280–296. - PubMed
    1. Miao ZF, Adkins-Threats M, Burclaff JR, et al. A Metformin-Responsive Metabolic Pathway Controls Distinct Steps in Gastric Progenitor Fate Decisions and Maturation. Cell Stem Cell 2020;26:910–925 e916. - PMC - PubMed
    1. Willet SG, Mills JC. Stomach Organ and Cell Lineage Differentiation: from Embryogenesis to Adult Homeostasis. Cell Mol Gastroenterol Hepatol 2016;2:546–559. - PMC - PubMed

MeSH terms