

A single workflow for multi-species blood transcriptomics
- PMID: 38493105
- PMCID: PMC10944614
- DOI: 10.1186/s12864-024-10208-2
A single workflow for multi-species blood transcriptomics
Abstract
Background: Blood transcriptomic analysis is widely used to provide a detailed picture of a physiological state with potential outcomes for applications in diagnostics and monitoring of the immune response to vaccines. However, multi-species transcriptomic analysis is still a challenge from a technological point of view and a standardized workflow is urgently needed to allow interspecies comparisons.
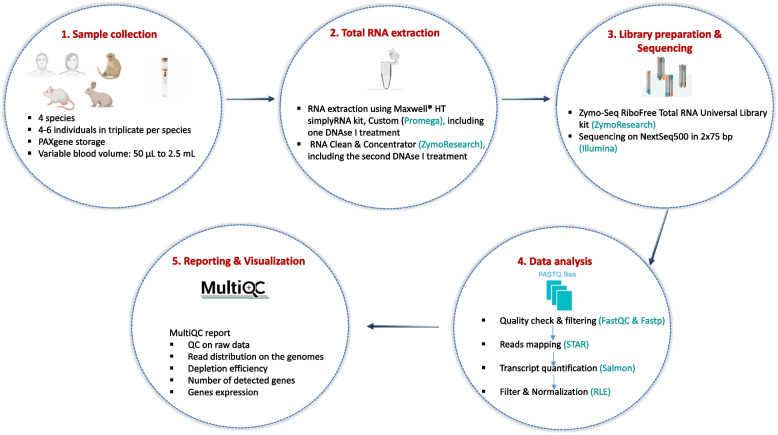
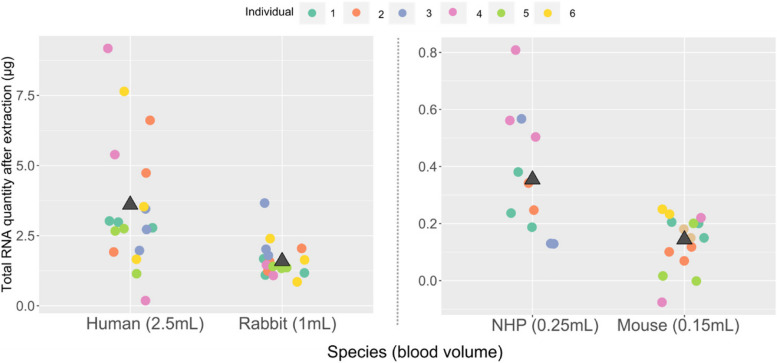
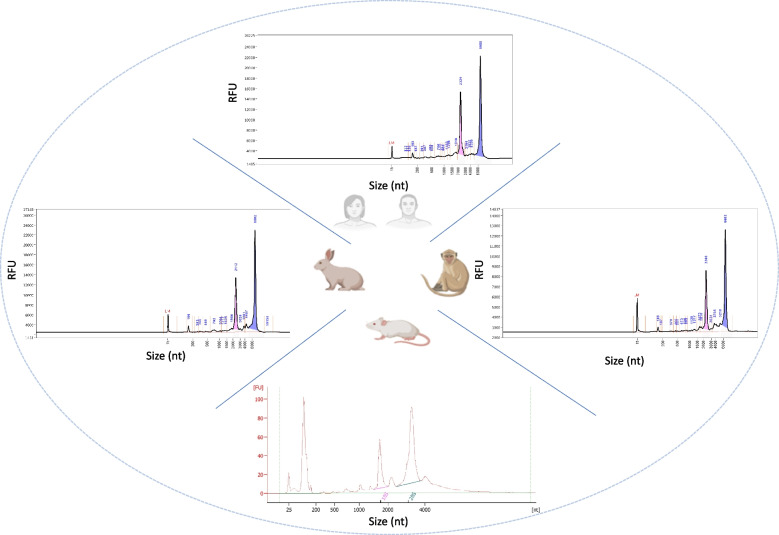
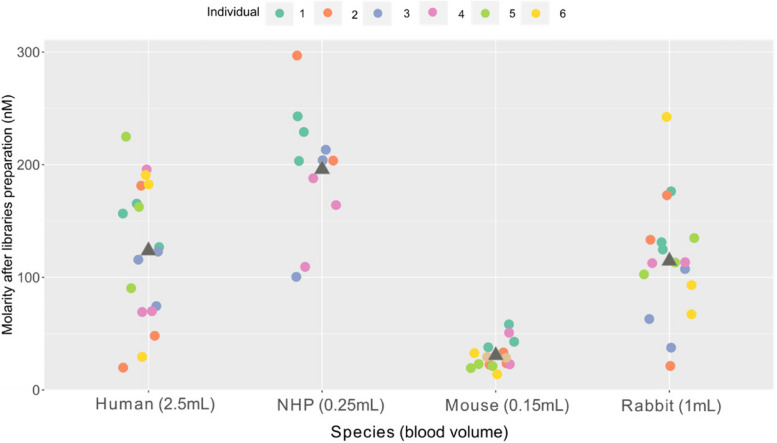
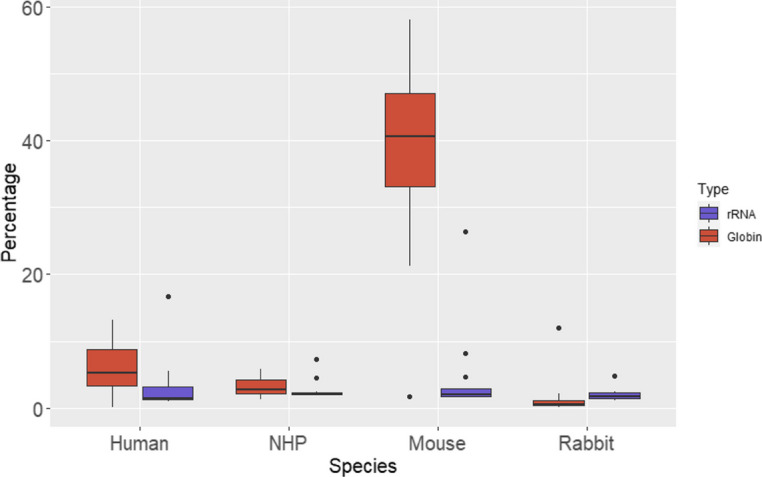
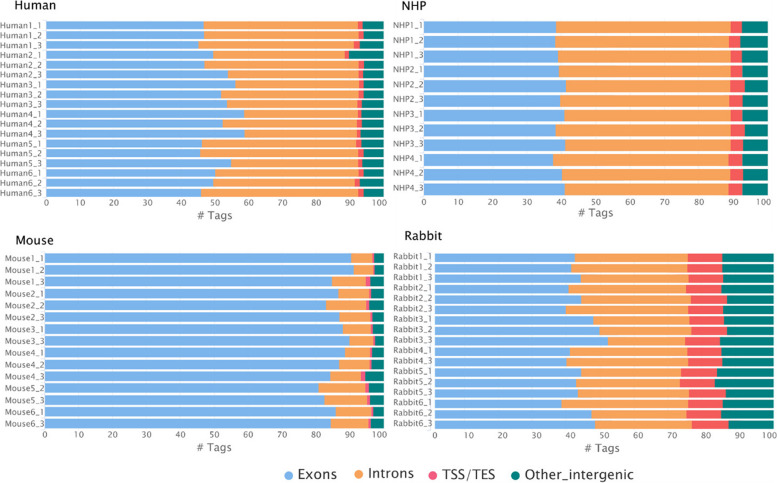
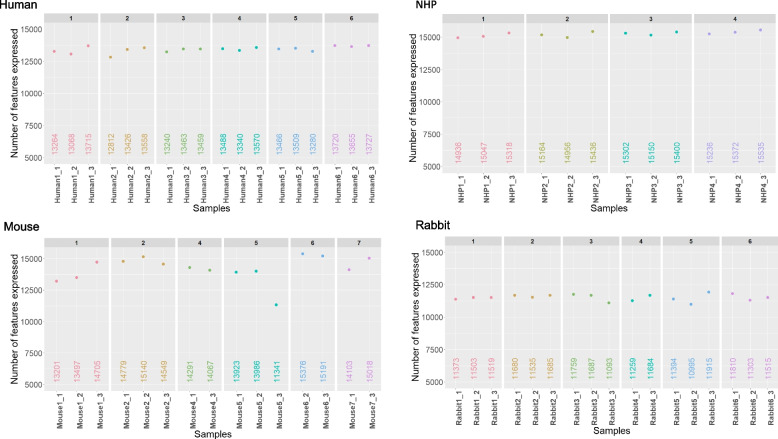
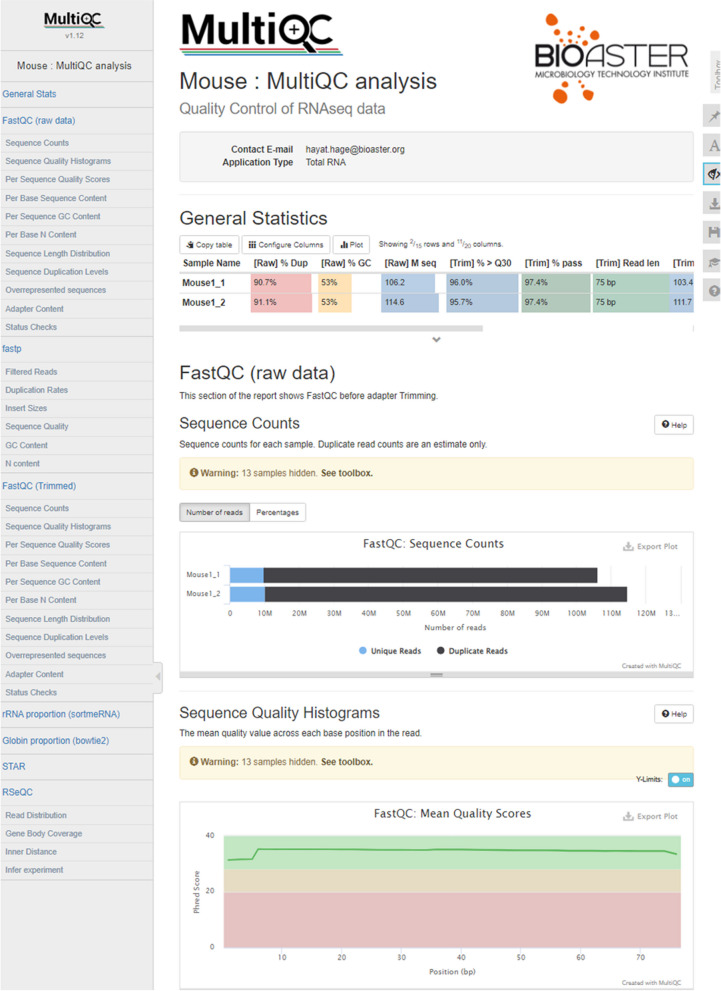
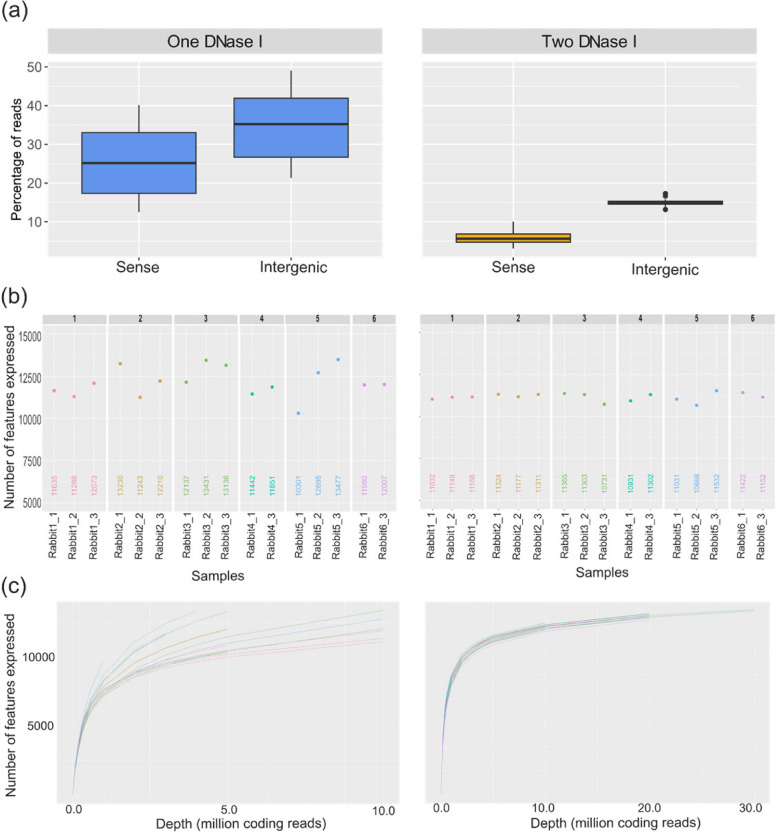
Results: Here, we propose a single and complete total RNA-Seq workflow to generate reliable transcriptomic data from blood samples from humans and from animals typically used in preclinical models. Blood samples from a maximum of six individuals and four different species (rabbit, non-human primate, mouse and human) were extracted and sequenced in triplicates. The workflow was evaluated using different wet-lab and dry-lab criteria, including RNA quality and quantity, the library molarity, the number of raw sequencing reads, the Phred-score quality, the GC content, the performance of ribosomal-RNA and globin depletion, the presence of residual DNA, the strandness, the percentage of coding genes, the number of genes expressed, and the presence of saturation plateau in rarefaction curves. We identified key criteria and their associated thresholds to be achieved for validating the transcriptomic workflow. In this study, we also generated an automated analysis of the transcriptomic data that streamlines the validation of the dataset generated.
Conclusions: Our study has developed an end-to-end workflow that should improve the standardization and the inter-species comparison in blood transcriptomics studies. In the context of vaccines and drug development, RNA sequencing data from preclinical models can be directly compared with clinical data and used to identify potential biomarkers of value to monitor safety and efficacy.
Keywords: Blood samples; Clinical models; Data analysis; Library preparation; Preclinical models; Quality controls; RNA extraction; Report; Standardization; Total RNA sequencing; Transcriptomics; Workflow.
© 2024. The Author(s).
Conflict of interest statement
The authors declare no competing interests.
Figures
Similar articles
-
SPARTA: Simple Program for Automated reference-based bacterial RNA-seq Transcriptome Analysis.BMC Bioinformatics. 2016 Feb 4;17:66. doi: 10.1186/s12859-016-0923-y. BMC Bioinformatics. 2016. PMID: 26847232 Free PMC article.
-
A Guide for Designing and Analyzing RNA-Seq Data.Methods Mol Biol. 2018;1783:35-80. doi: 10.1007/978-1-4939-7834-2_3. Methods Mol Biol. 2018. PMID: 29767357
-
MAP-RSeq: Mayo Analysis Pipeline for RNA sequencing.BMC Bioinformatics. 2014 Jun 27;15:224. doi: 10.1186/1471-2105-15-224. BMC Bioinformatics. 2014. PMID: 24972667 Free PMC article.
-
Computational solutions for spatial transcriptomics.Comput Struct Biotechnol J. 2022 Sep 1;20:4870-4884. doi: 10.1016/j.csbj.2022.08.043. eCollection 2022. Comput Struct Biotechnol J. 2022. PMID: 36147664 Free PMC article. Review.
-
RNA-Seq technology and its application in fish transcriptomics.OMICS. 2014 Feb;18(2):98-110. doi: 10.1089/omi.2013.0110. Epub 2013 Dec 31. OMICS. 2014. PMID: 24380445 Free PMC article. Review.
Cited by
-
Rare pathogenic structural variants show potential to enhance prostate cancer germline testing for African men.Nat Commun. 2025 Mar 10;16(1):2400. doi: 10.1038/s41467-025-57312-9. Nat Commun. 2025. PMID: 40064858 Free PMC article.
References
-
- Della Latta V, Cabiati M, Morales MA, Del Ry S. Bio-molecular evaluation of human transcriptomic profile in whole blood sample: a potential clinical approach? Recenti Prog Med. 2015;106:131–136. - PubMed
-
- Bartholomeus E, De Neuter N, Meysman P, Suls A, Keersmaekers N, Elias G, et al. Transcriptome profiling in blood before and after hepatitis B vaccination shows significant differences in gene expression between responders and non-responders. Vaccine. 2018;36:6282–6289. doi: 10.1016/j.vaccine.2018.09.001. - DOI - PubMed
MeSH terms
Substances
LinkOut - more resources
Full Text Sources
Medical
Miscellaneous
