. 2024 Mar 16;24(1):90.
doi: 10.1186/s12866-024-03247-y.

High-throughput sequencing reveals differences in microbial community structure and diversity in the conjunctival tissue of healthy and type 2 diabetic mice

Affiliations

High-throughput sequencing reveals differences in microbial community structure and diversity in the conjunctival tissue of healthy and type 2 diabetic mice

Fengjiao Li et al. BMC Microbiol. .

Abstract

Background: To investigate the differences in bacterial and fungal community structure and diversity in conjunctival tissue of healthy and diabetic mice.

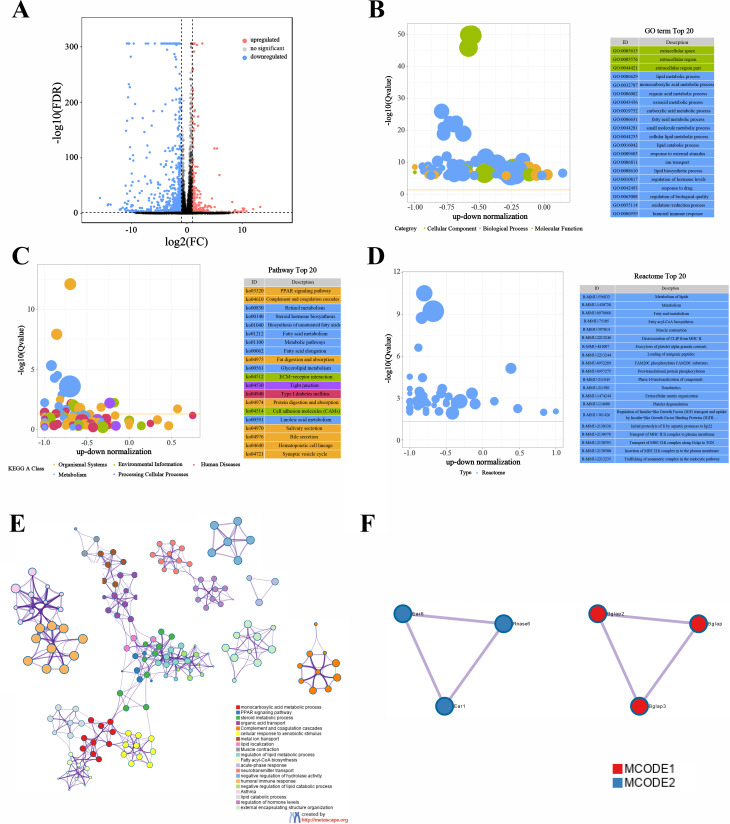
Methods: RNA-seq assays and high-throughput sequencing of bacterial 16 S rDNA and fungal internal transcribed spacer (ITS) gene sequences were used to identify differentially expressed host genes and fungal composition profiles in conjunctival tissues of diabetic BKS-db/db mice and BKS (control) mice. Functional enrichment analysis of differentially expressed genes and the correlation between the relative abundance of bacterial and fungal taxa in the intestinal mucosa were also performed.

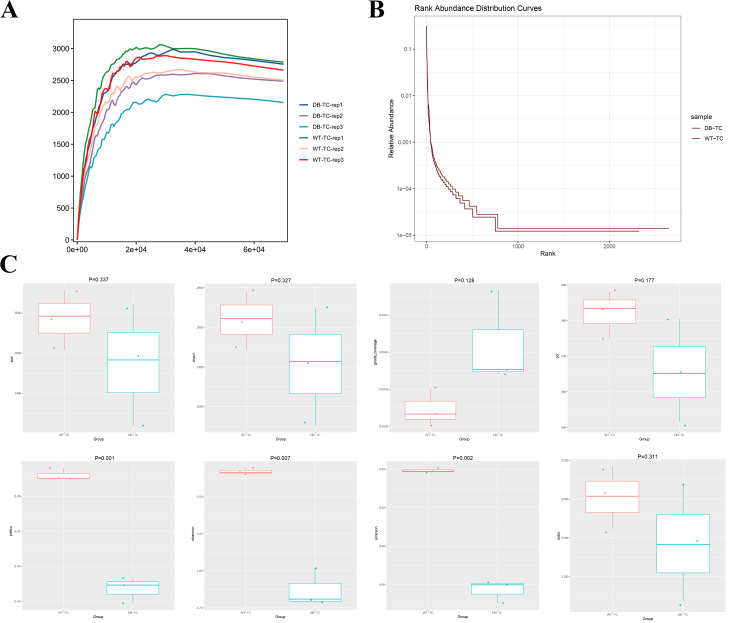
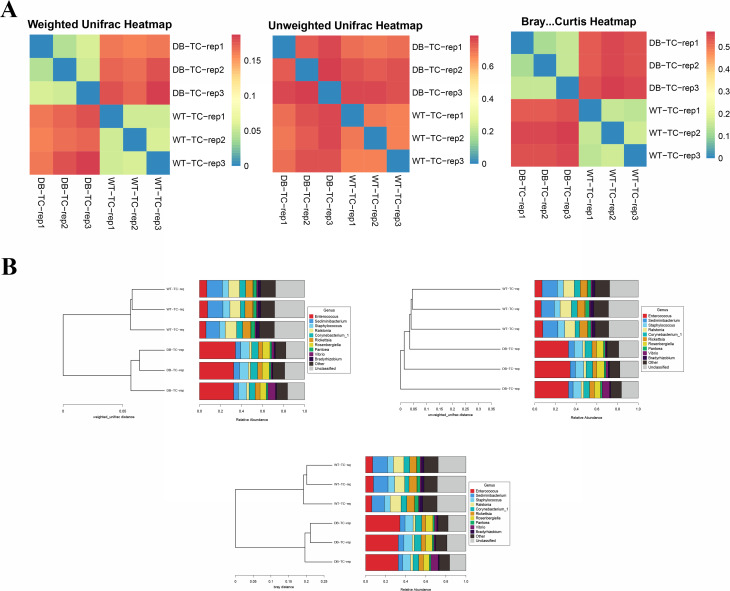
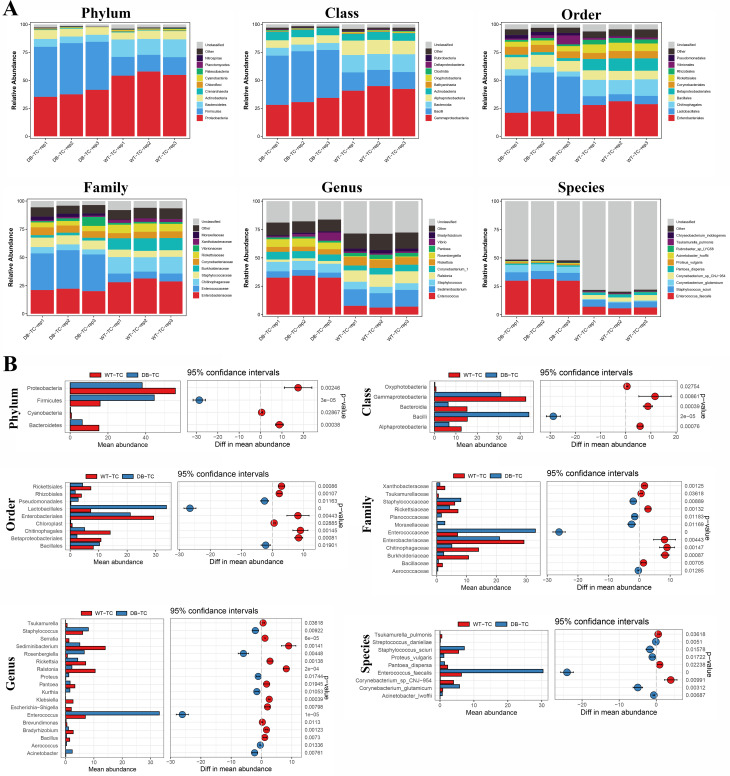
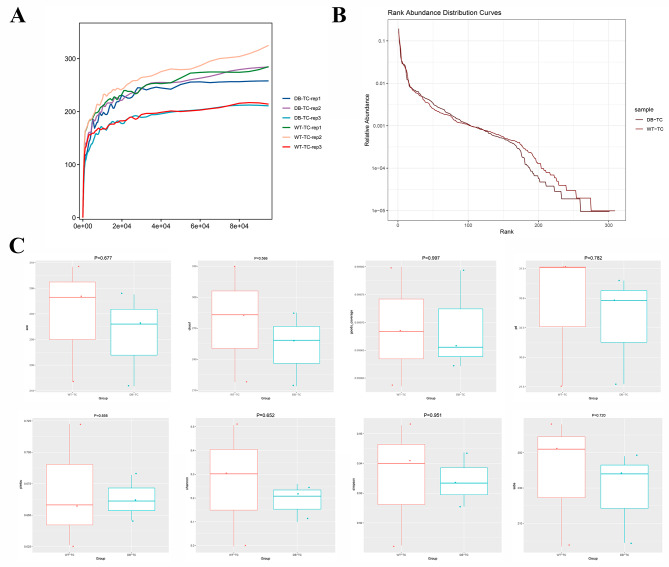
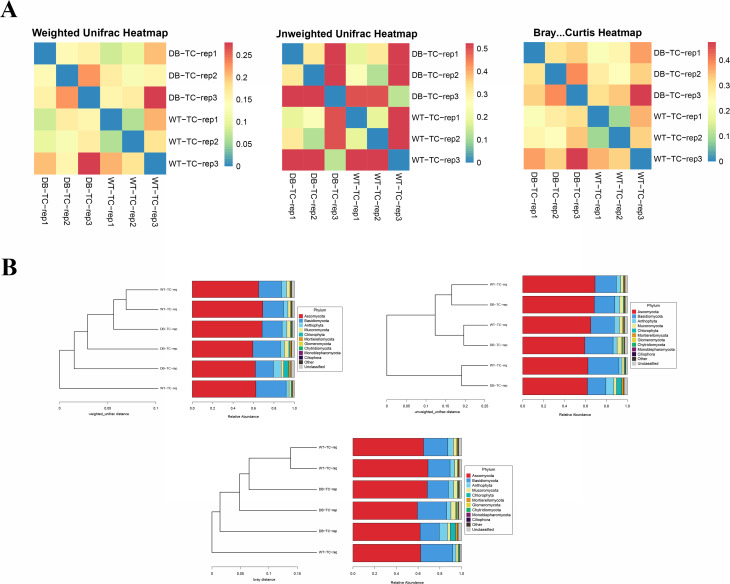
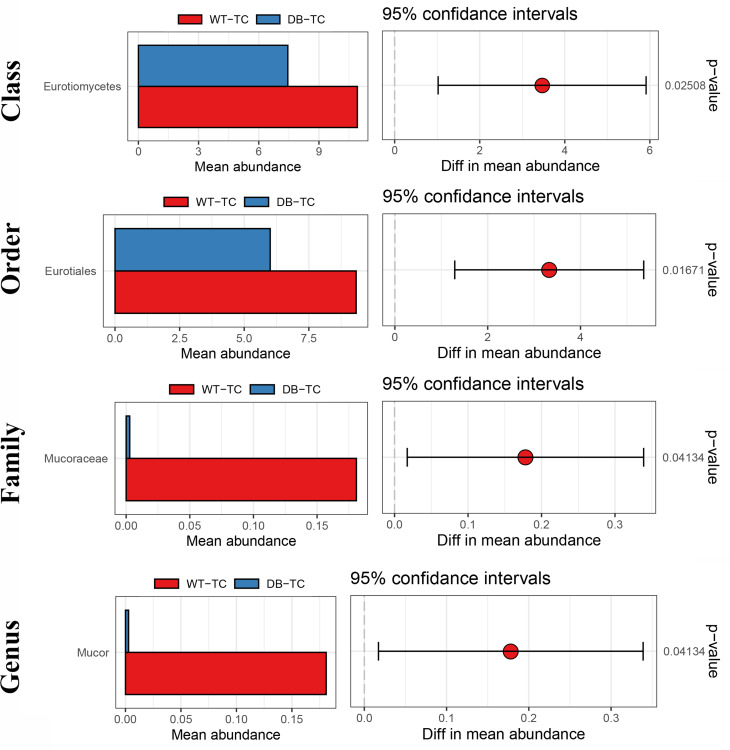
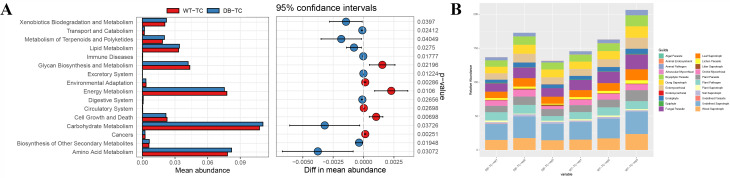
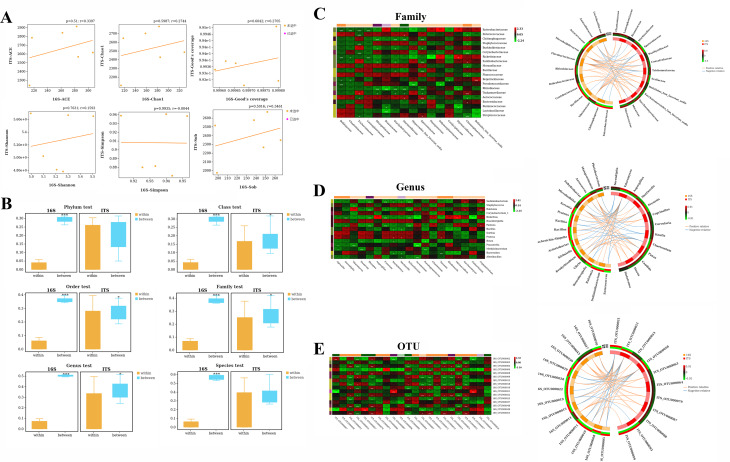
Results: Totally, 449 differential up-regulated genes and 1,006 down-regulated genes were identified in the conjunctival tissues of diabetic mice. The differentially expressed genes were mainly enriched in metabolism-related functions and pathways. A decrease in conjunctival bacterial species diversity and abundance in diabetic mice compared to control mice. In contrast, fungal species richness and diversity were not affected by diabetes. The microbial colonies were mainly associated with cellular process pathways regulating carbohydrate and lipid metabolism, as well as cell growth and death. Additionally, some interactions between bacteria and fungi at different taxonomic levels were also observed.

Conclusion: The present study revealed significant differences in the abundance and composition of bacterial and fungal communities in the conjunctival tissue of diabetic mice compared to control mice. The study also highlighted interactions between bacteria and fungi at different taxonomic levels. These findings may have implications for the diagnosis and treatment of diabetes.

Keywords: Conjunctival tissue; Diabetes mellitus; Diversity; High-throughput sequencing; Microbial community.


Conflict of interest statement

The authors declare no competing interests.

Figures

Fig. 1
Fig. 1
Differential expression and functional analysis of genes in control and diabetic groups. (A) Volcano plot showing the differentially expressed genes in control (WT-TC) and diabetic (DB-TC) groups. 449 genes were upregulated (red) and 1,006 genes were downregulated (blue). The x axis is log2 (Fold Change), which is the multiple of the difference between two groups of samples and the y axis showed the log P-value which calculated by t-test. The cut-off is 1.3=-log10 (0.05). (B) Gene Ontology (GO) functional enrichment analysis of differentially expressed genes. The top enriched GO terms were related to metabolism, such as the lipid metabolic process and the monocarboxylic acid metabolic process. (C) Kyoto Encyclopedia of Genes and Genomes (KEGG) pathway enrichment analysis of differentially expressed genes. The top enriched pathways were metabolic pathways, such as the PPAR signaling pathway and retinol metabolism. (D) Reactome pathway analysis of differentially expressed genes. The top enriched pathways were related to various metabolic processes, such as the metabolism of lipids and fatty acid metabolism. (E) Protein-protein interaction (PPI) network analysis of differentially expressed genes using Metascape. The network was visualized with gene information, and nodes were colored based on their degree of connectivity. (F) The largest subnetworks in the PPI network were selected and visualized using the MCODE plug-in in Cytoscape. MCODE1 functions were mainly enriched in the metabolism of lipids and the response to vitamins
Fig. 2
Fig. 2
Analysis of microbial diversity in control and diabetic groups using 16 S rDNA sequencing. (A) Dilution curve showing the reasonableness of the sample size with the increase of sample size. The x axis represents the number of sequencing samples randomly selected from a certain sample, and the y axis represents the number of OTUs that can be constructed based on this number of sequencing samples to reflect the depth of sequencing. (B) Rank abundance curve showing the abundance and evenness of conjunctival flora in the WT-TC and DB-TC groups. (C) Alpha diversity indices including Pielou, Shannon, and Simpson indices, reflecting the abundance and diversity of microbial communities in the samples. The overall index of the WT-TC group was higher than that of the DB-TC group, indicating a higher degree of microbial community diversity in the control group. The occurrence of diabetes caused a decrease in species richness and diversity (p < 0.05). The goods_coverage index for each group was greater than 0.99, indicating high credibility of the data
Fig. 3
Fig. 3
mBeta diversity was used to compare the magnitude of differences between pairs of samples in terms of species diversity. (A) The beta diversity matrix heat map obtained using Bray-Curtis, weighted UniFrac, and unweighted UniFrac analyses. Samples with similar beta diversity were clustered together, revealing the similarity between them. The beta diversity between the two groups was well-clustered and could be distinguished within a certain range. Based on the beta diversity distance matrix, the samples were classified into UPGMA classification trees, where the more similar samples had shorter common branches. (B) The results of cluster analysis for all samples, indicating that the WT-TC and DB-TC groups had similar colony results but differed in their compositional abundance
Fig. 4
Fig. 4
Microbial diversity in conjunctival flora of diabetic and control mice. (A) Relative abundance of the top 10 phyla, classes, orders, families, genera, and species in both groups of mice. (B) Comparison of the abundance of major phyla, classes, orders, families, genera, and species between diabetic and control mice
Fig. 5
Fig. 5
ITS sequencing results. (A) The dilution curve of conjunctival flora samples, which indicates a reasonable increase in results with increasing sample size. The x axis represents the number of sequencing samples randomly selected from a certain sample, and the y axis represents the number of OTUs that can be constructed based on this number of sequencing samples to reflect the depth of sequencing. (B) The abundance rank curve of the WT-TC and DB-TC groups, revealing that the abundance of conjunctival flora in the two groups is higher and more evenly distributed, while the abundance of the DB-TC group is lower than that of the WT-TC group. (C) Alpha diversity analysis revealed no statistical difference in fungal species abundance and diversity between the two groups (p > 0.05)
Fig. 6
Fig. 6
Results of Beta diversity analysis. (A) Using clustering analysis, poor clustering was shown between the two groups. (B) The fungal colony composition of the WT-TC and DB-TC groups. There are no significant differences between all groups, as indicated by the clustering analysis. These findings suggest that the occurrence of diabetes did not impact the fungal colony composition in the conjunctiva
Fig. 7
Fig. 7
The fungal taxonomic composition and abundance differences between the WT-TC and DB-TC groups based on ITS sequencing. The taxonomic composition of the fungal community at the phylum, class, order, family, and genus levels is presented. Ascomycota, Sordariomycetes, Sordariales, Bolbitiaceae, and Agrocybe were the dominant taxa found in the samples. At the species level, the most high-frequency OTU1 was identified as Agrocybe pediades, Serendipita indica, Humicola grisea, and Rhizopus arrhizus. The abundance of Eurotiomycetes, Eurotiales, Mucoraceae, and Mucor was significantly reduced in the diabetic group compared to the control group (p < 0.05)
Fig. 8
Fig. 8
Functional prediction of 16 S rDNA and ITS sequencing communities. (A) The predicted functional analysis of the KEGG pathways for all samples using Tax4Fun software. The top 16 KEGG secondary functional pathways with relatively high abundance are displayed, including pathways related to carbohydrate, capacity, lipid, terpene and polyketides, amino acid metabolic pathways, biodegradation and metabolism, environmental adaptation, digestion, circulatory and excretory systems, cancer and immune diseases, and cellular process pathways of cell growth and death. (B) The relative abundance of 22 fungal functional taxa (excluding unassigned taxa) analyzed using the FUNGuild tool. The functional taxa are ranked by abundance, and the results indicate that “Bryophyte Parasite-Dung Saprotroph-Ectomycorrhizal-Fungal Parasite-Leaf Saprotroph-Plant Parasite-Undefined Saprotroph-Wood Saprotroph” had the highest abundance among all samples, followed by undefined saprotroph and then orchid mycorrhizal
Fig. 9
Fig. 9
Comparison of bacterial and fungal diversity. (A) The correlation scatter plots of bacterial and fungal species diversity indices, indicating no significant correlation between the two at the alpha diversity level. (B) The statistical test results for within-group and between-group distance differences, as well as the combined distance box plot, demonstrating that grouping differences affected bacteria at the Phylum, Order, Family, Genus, and Species levels and fungi only at the Order, Family, and Genus levels. (C-E) The correlation analyses between bacteria and fungi at the family, genus, and OTU levels using the Sparse Correlations for Compositional data model. The heat map and circos plots are based on the sPLS screening of strongly correlated species, with the internal circos presenting correlation results and the external heat map displaying specific species abundance trends. The results show that there were correlations between bacteria and fungi at all three taxonomic levels, indicating interactions between bacteria and fungi

Similar articles

References

    1. Chatterjee S, Khunti K, Davies MJ. Type 2 diabetes. Lancet. 2017;389(10085):2239–51. doi: 10.1016/S0140-6736(17)30058-2. - DOI - PubMed
    1. Giannopapas V, Palaiodimou L, Kitsos D, Papagiannopoulou G, Stavrogianni K, Chasiotis A, et al. The prevalence of diabetes Mellitus Type II (DMII) in the multiple sclerosis Population: a systematic review and Meta-analysis. J Clin Med. 2023;12(15). 10.3390/jcm12154948. - PMC - PubMed
    1. Tinajero MG, Malik VS. An update on the epidemiology of type 2 diabetes: A Global Perspective. Endocrinol Metab Clin North Am. 2021;50(3):337–55. doi: 10.1016/j.ecl.2021.05.013. - DOI - PubMed
    1. Meigs JB. The genetic epidemiology of type 2 diabetes: opportunities for Health translation. Curr Diab Rep. 2019;19(8):62. doi: 10.1007/s11892-019-1173-y. - DOI - PMC - PubMed
    1. Mansuri F, Bhole PK, Parmar D. Study of dry eye disease in type 2 diabetes mellitus and its association with diabetic retinopathy in Western India. Indian J Ophthalmol. 2023;71(4):1463–7. doi: 10.4103/IJO.IJO_2770_22. - DOI - PMC - PubMed