. 2024 Mar 16;22(1):288.
doi: 10.1186/s12967-024-05057-2.

Single-cell transcriptomic sequencing data reveal aberrant DNA methylation in SMAD3 promoter region in tumor-associated fibroblasts affecting molecular mechanism of radiosensitivity in non-small cell lung cancer

Affiliations

Single-cell transcriptomic sequencing data reveal aberrant DNA methylation in SMAD3 promoter region in tumor-associated fibroblasts affecting molecular mechanism of radiosensitivity in non-small cell lung cancer

Fushi Han et al. J Transl Med. .

Abstract

Objective: Non-small cell lung cancer (NSCLC) often exhibits resistance to radiotherapy, posing significant treatment challenges. This study investigates the role of SMAD3 in NSCLC, focusing on its potential in influencing radiosensitivity via the ITGA6/PI3K/Akt pathway.

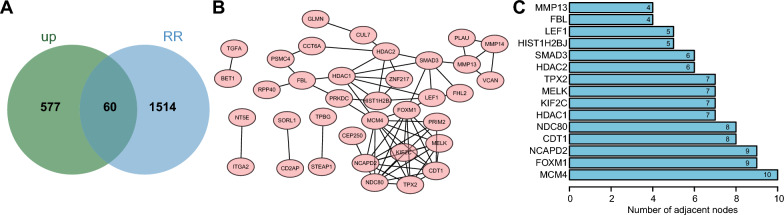
Methods: The study utilized gene expression data from the GEO database to identify differentially expressed genes related to radiotherapy resistance in NSCLC. Using the GSE37745 dataset, prognostic genes were identified through Cox regression and survival analysis. Functional roles of target genes were explored using Gene Set Enrichment Analysis (GSEA) and co-expression analyses. Gene promoter methylation levels were assessed using databases like UALCAN, DNMIVD, and UCSC Xena, while the TISCH database provided insights into the correlation between target genes and CAFs. Experiments included RT-qPCR, Western blot, and immunohistochemistry on NSCLC patient samples, in vitro studies on isolated CAFs cells, and in vivo nude mouse tumor models.

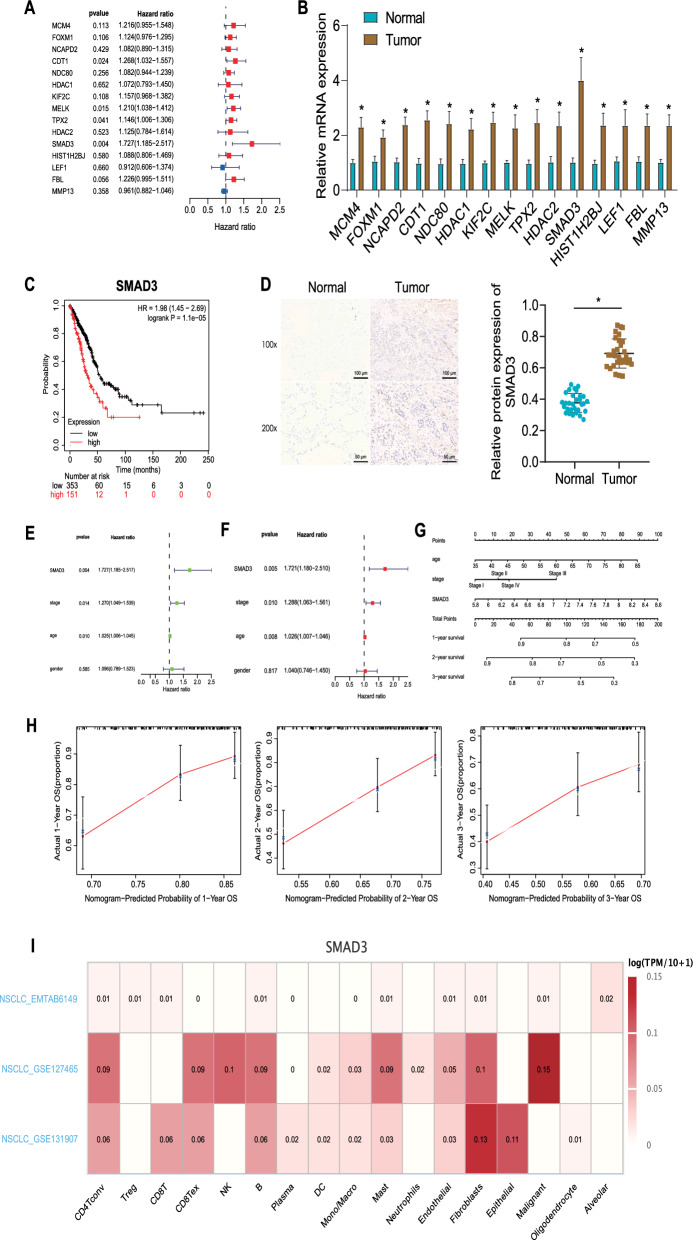
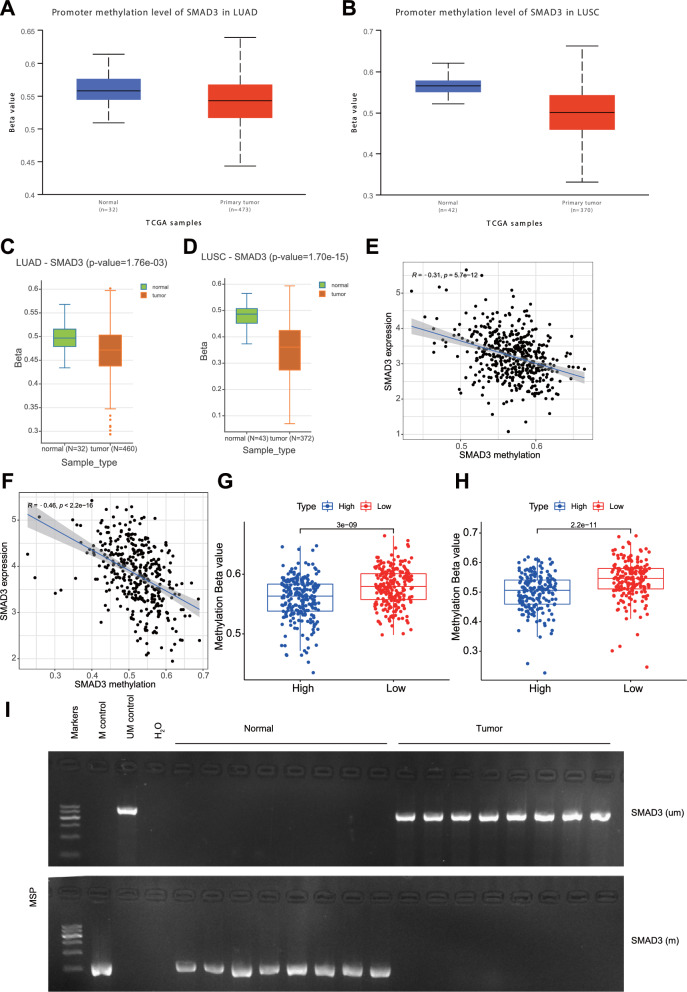
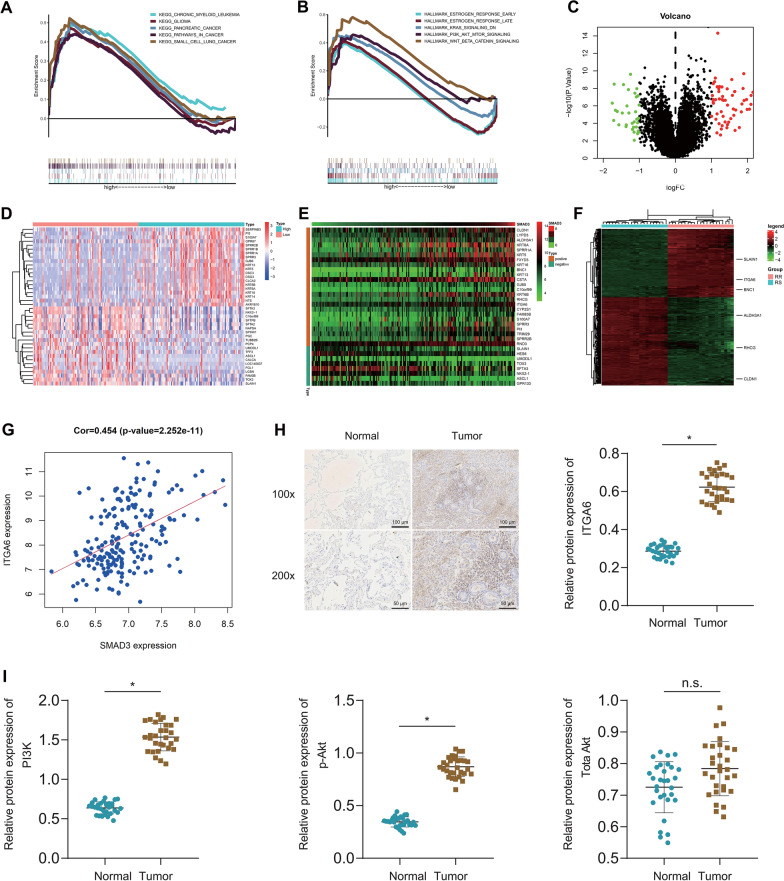
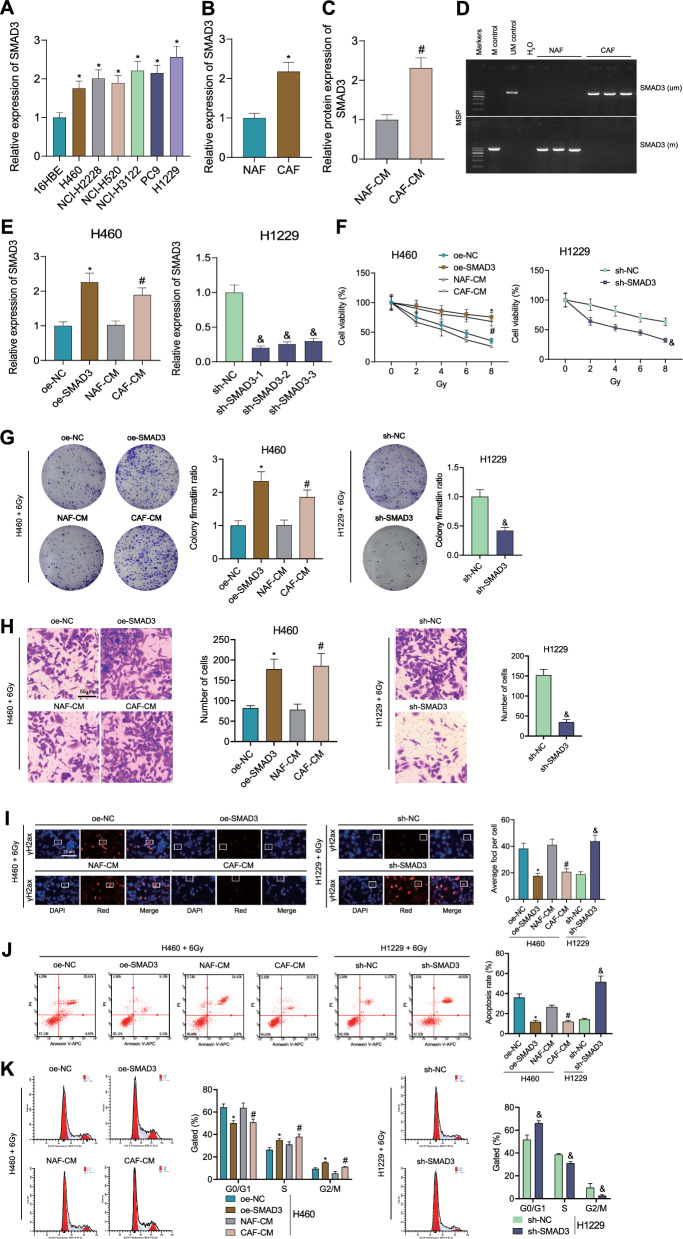
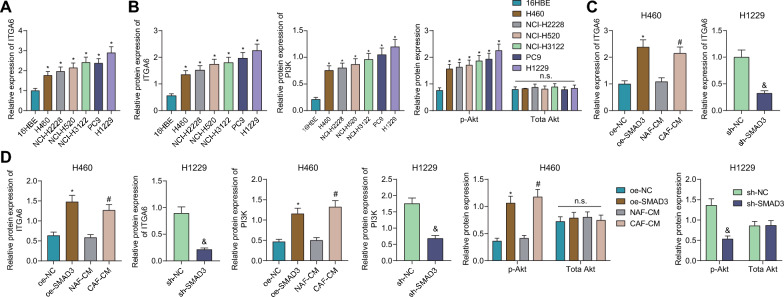
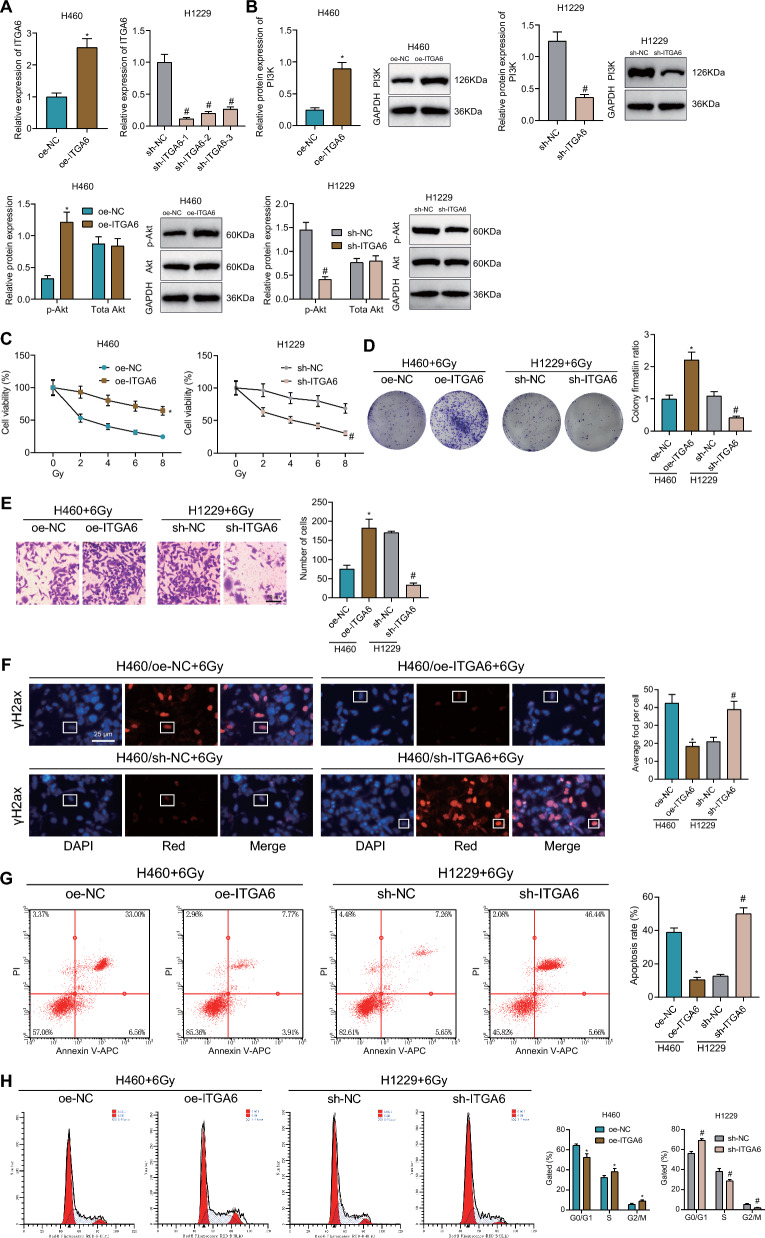
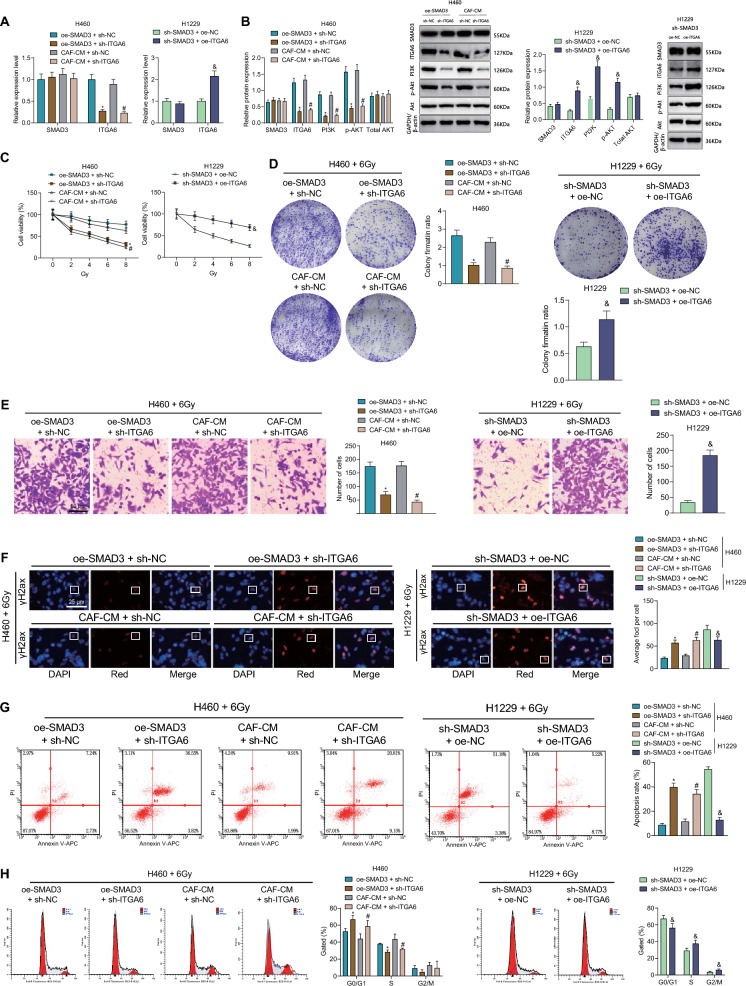
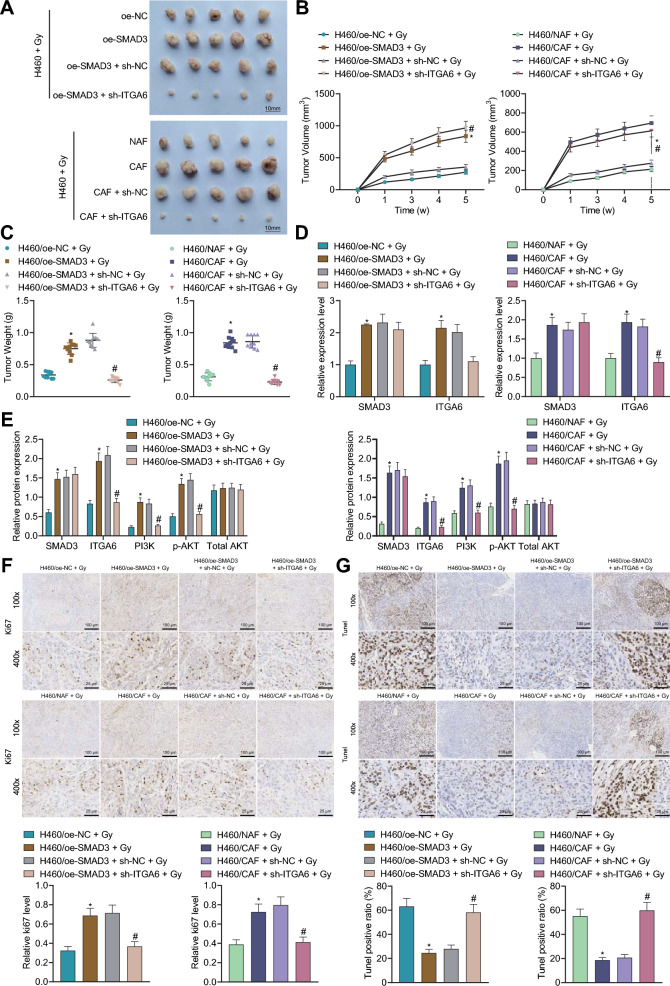
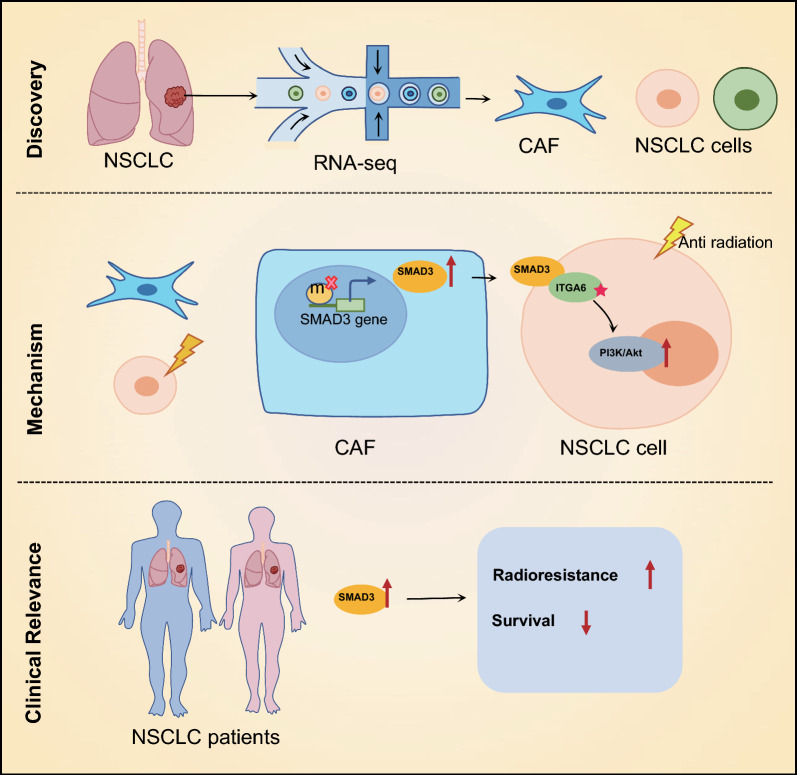
Results: Fifteen key genes associated with radiotherapy resistance in NSCLC cells were identified. SMAD3 was recognized as an independent prognostic factor for NSCLC, linked to poor patient outcomes. High expression of SMAD3 was correlated with low DNA methylation in its promoter region and was enriched in CAFs. In vitro and in vivo experiments confirmed that SMAD3 promotes radiotherapy resistance by activating the ITGA6/PI3K/Akt signaling pathway.

Conclusion: High expression of SMAD3 in NSCLC tissues, cells, and CAFs is closely associated with poor prognosis and increased radiotherapy resistance. SMAD3 is likely to enhance radiotherapy resistance in NSCLC cells by activating the ITGA6/PI3K/Akt signaling pathway.

Keywords: ITGA6; Non-small cell lung cancer; Radiosensitivity; Radiotherapy resistance; SMAD3; Single-cell sequencing; Tumor-associated fibroblasts.


Conflict of interest statement

The authors declare no competing interests.

Figures

Fig. 1
Fig. 1
Screening of genes involved in the radioresistance of NSCLC cells. A Venn diagram of the upregulated DEGs in NSCLC tissues and radioresistant NSCLC cell lines. B PPI network diagram of the 60 genes related to radioresistance drawn by Cytoscape. C The top 15 genes related to radioresistance ranked by Degree value
Fig. 2
Fig. 2
Identification of genes related to the prognosis of NSCLC patients. A Univariate Cox regression analysis of the GSE37745 dataset. The left shows the gene name, the middle is the p value, and the right indicates the risk rate distribution. Hazard ratio represents the risk rate, and a gene with the risk rate greater than 1 represents a high-risk gene, while less than 1, it represents a low-risk gene. B Expression of 15 genes in the clinical tissue samples and adjacent normal tissue samples of NSCLC patients (n = 120) measured by RT-qPCR. * p < 0.05. C Correlation between SMAD3 expression and overall survival in NSCLC patients analyzed by Kaplan–Meier plotter database. Red indicates SMAD3 high expression, black indicates low SMAD3 expression. D Immunohistochemistry of SMAD3 protein in normal lung tissues and NSCLC tissues (30 samples randomly selected from 120 samples). * p < 0.05. E Univariate Cox regression analysis confirmed SMAD3 as an independent prognostic factor of NSCLC. F Multivariate Cox regression analysis confirmed SMAD3 as an independent prognostic factor of NSCLC. G A nomogram composed of SMAD3 expression, age, and tumor stage. H Accuracy of the predicted 1-, 2- and 3-year survival rate determined by a calibration curve based on the nomogram. I SMAD3 enrichment analyzed by the NSCLC-related scRNA-seq dataset from the TISCH database. The abscissa represents the cell type, the ordinate represents the dataset and color scale indicates expression, with darker color corresponding to higher expression
Fig. 3
Fig. 3
Increased expression of SMAD3 in NSCLC is correlated with its promoter hypomethylation. A The DNA methylation level of the SMAD3 promoter region between normal tissues and LUAD tissues analyzed by the UALCAN database. B The DNA methylation level of the SMAD3 promoter region between normal tissues and LUSC tissues analyzed by the UALCAN database. C The DNA methylation level of the SMAD3 promoter region between normal tissues and LUAD tissues analyzed by the DNMIVD database. D The DNA methylation level of the SMAD3 promoter region between normal tissues and LUSC tissues analyzed by the DNMIVD database. E Correlation between SMAD3 expression and DNA methylation of the SMAD3 promoter region in TCGA-LUAD (n = 465). F Correlation between SMAD3 expression and DNA methylation of the SMAD3 promoter region in TCGA-LUSC (n = 370). G The DNA methylation level of the SMAD3 promoter region between the SMAD3 high (n = 233) and low expression groups (n = 232) in TCGA-LUAD. H The DNA methylation level of the SMAD3 promoter region between the SMAD3 high (n = 185) and low expression (n = 185) groups in TCGA-LUSC. I The DNA methylation level of the SMAD3 promoter region in promoter region in the tumor tissues of NSCLC patients detected by MSP-PCR (8 samples randomly selected from 120 samples)
Fig. 4
Fig. 4
SMAD3 enhances the radioresistance of NSCLC cells via ITGA6/PI3K/Akt pathway activation. A Analysis of the function of SMAD3 using GSEA based on the KEGG gene set. Different curves indicate different pathway names. B Analysis of the function of SMAD3 using GSEA based on the Hallmark gene set. Different curves indicate different pathway names. C A volcano map of the DEGs between the SMAD3 high (n = 98) and low expression groups (n = 98). Green indicates the downregulated genes, red indicates the upregulated genes, and black indicates un-differentially expressed genes. D A heat map of the top 20 DEGs between the SMAD3 high and low expression groups. Color scale from red to blue indicates gene expression from high to low. E A heat map of SMAD3-related genes. Color scale from red to green indicates gene expression from high to low. F A heat map of the DEGs in the GSE20549 dataset, with 6 SMAD3-related genes labeled. Color scale from red to green indicates gene expression from high to low. G Correlation of SMAD3 expression with ITGA6 expression in the GSE37745 dataset (n = 196). H The protein expression of ITGA6 in tumor tissues of NSCLC patients determined by immunohistochemistry. I Western blot of PI3K/Akt pathway-related proteins in tumor tissues of NSCLC patients (30 samples randomly selected from 120 samples). * p < 0.05
Fig. 5
Fig. 5
DNA hypomethylation of the SMAD3 promoter region in CAFs leads to increased radioresistance of NSCLC cells. A The expression of SMAD3 in NSCLC cell lines and human bronchial epithelial cells 16HBE measured by RT-qPCR. B The expression of SMAD3 in NAFs and CAFs measured by RT-qPCR. C Western blot of SMAD3 protein in the CAF-CM and NAF-CM. D The DNA methylation level of the SMAD3 promoter region in NAFs and CAFs measured by MSP-PCR. E The expression of SMAD3 in H460 cells treated with oe-SMAD3 or CAF-CM and in H1229 cells treated with sh-SMAD3 measured by RT-qPCR. F Viability of H460 and H1229 cells treated with oe-SMAD3 or sh-SMAD3, respectively, following exposure to different doses of X-ray radiation. G Proliferation of H460 and H1229 cells treated with oe-SMAD3 or sh-SMAD3, respectively, following exposure to 6 Gy X-ray radiation. H Invasion of H460 and H1229 cells treated with oe-SMAD3 or sh-SMAD3, respectively, following exposure to 6 Gy X-ray radiation. I γH2ax fluorescence in H460 cells treated with oe-SMAD3 or CAF-CM and in H1229 cells treated with sh-SMAD3 following exposure to 6 Gy X-ray radiation. J Apoptosis of H460 cells treated with oe-SMAD3 or CAF-CM and of H1229 cells treated with sh-SMAD3 following exposure to 6 Gy X-ray radiation determined by flow cytometry. K Cell cycle distribution of H460 cells treated with oe-SMAD3 or CAF-CM and of H1229 cells treated with sh-SMAD3 following exposure to 6 Gy X-ray radiation determined by flow cytometry. *p < 0.05 vs. 16HBE, NAF, or oe-NC groups. #p < 0.05 vs. NAF-CM group. &p < 0.05 vs. sh-NC group. Cell experiments were repeated three times
Fig. 6
Fig. 6
SMAD3 from CAFs promotes activation of the ITGA6/PI3K/Akt pathway in NSCLC cells. A ITGA6 mRNA expression in NSCLC cell lines and 16HBE cells measured by RT-qPCR. B Western blot of ITGA6 and PI3K/Akt pathway-related proteins in NSCLC cell lines and 16HBE cells. C ITGA6 mRNA expression in H460 cells treated with oe-SMAD3 or CAF-CM and in H1229 cells treated with sh-SMAD3 by RT-qPCR. D Western blot of ITGA6 and PI3K/Akt pathway-related proteins in H460 cells treated with oe-SMAD3 or CAF-CM and in H1229 cells treated with sh-SMAD3. *p < 0.05 vs. 16HBE or oe-NC group. n.s. indicates not significant. #p < 0.05 vs. NAF-CM group. &p < 0.05 vs. sh-NC group. Cell experiments were repeated three times
Fig. 7
Fig. 7
ITGA6/PI3K/Akt pathway exerts promoting function in the radioresistance of NSCLC cells. A ITGA6 mRNA expression in H460 and H1229 cells treated with oe-ITGA6 or sh-ITGA6, respectively, measured by RT-qPCR. B Western blot of PI3K/Akt pathway-related proteins in H460 and H1229 cells treated with oe-ITGA6 or sh-ITGA6, respectively. C Viability of H460 and H1229 cells treated with oe-ITGA6 or sh-ITGA6, respectively, following exposure to different doses of X-ray radiation. D Proliferation of H460 and H1229 cells treated with oe-ITGA6 or sh-ITGA6, respectively, following exposure to 6 Gy X-ray radiation. E Invasion of H460 and H1229 cells treated with oe-ITGA6 or sh-ITGA6, respectively, following exposure to 6 Gy X-ray radiation. F γH2ax fluorescence in H460 and H1229 cells treated with oe-ITGA6 or sh-ITGA6, respectively, following exposure to 6 Gy X-ray radiation. G Apoptosis of H460 and H1229 cells treated with oe-ITGA6 or sh-ITGA6, respectively, following exposure to 6 Gy X-ray radiation determined by flow cytometry. H Cell cycle distribution of H460 and H1229 cells treated with oe-ITGA6 or sh-ITGA6, respectively, following exposure to 6 Gy X-ray radiation determined by flow cytometry. *p < 0.05 vs. oe-NC group. #p < 0.05 vs. sh-NC group. Cell experiments were repeated three times
Fig. 8
Fig. 8
SMAD3 from CAFs reduces the radiosensitivity of NSCLC cells by activating the ITGA6/PI3K/Akt pathway. A The expression of SMAD3 and ITGA6 in H460 cells treated with sh-ITGA6 + oe-SMAD3 or sh-ITGA6 + CAF-CM and in the H1229 cells treated with sh-SMAD3 + oe-ITGA6 determined by RT-qPCR. B Western blot of SMAD3, ITGA6 and the PI3K/Akt pathway-related proteins in H460 cells treated with sh-ITGA6 + oe-SMAD3 or sh-ITGA6 + CAF-CM and in the H1229 cells treated with sh-SMAD3 + oe-ITGA6. C Viability of H460 cells treated with sh-ITGA6 + oe-SMAD3 or sh-ITGA6 + CAF-CM and of H1229 cells treated with sh-SMAD3 + oe-ITGA6 following exposure to 6 Gy X-ray radiation measured by CCK-8. D Colony formation of H460 cells treated with sh-ITGA6 + oe-SMAD3 or sh-ITGA6 + CAF-CM and of H1229 cells treated with sh-SMAD3 + oe-ITGA6, following exposure to 6 Gy X-ray radiation. E Invasion of H460 cells treated with sh-ITGA6 + oe-SMAD3 or sh-ITGA6 + CAF-CM and of H1229 cells treated with sh-SMAD3 + oe-ITGA6, following exposure to 6 Gy X-ray radiation. F γH2ax fluorescence in H460 cells treated with sh-ITGA6 + oe-SMAD3 or sh-ITGA6 + CAF-CM and in H1229 cells treated with sh-SMAD3 + oe-ITGA6, following exposure to 6 Gy X-ray radiation. G Apoptosis of H460 cells treated with sh-ITGA6 + oe-SMAD3 or sh-ITGA6 + CAF-CM and of H1229 cells treated with sh-SMAD3 + oe-ITGA6, following exposure to 6 Gy X-ray radiation determined by flow cytometry. H Cell cycle distribution of H460 cells treated with sh-ITGA6 + oe-SMAD3 or sh-ITGA6 + CAF-CM and of H1229 cells treated with sh-SMAD3 + oe-ITGA6, following exposure to 6 Gy X-ray radiation determined by flow cytometry. *p < 0.05 vs. oe-SMAD3 + sh-NC group. #p < 0.05 vs. CAF-CM + sh-NC group. &p < 0.05 vs. sh-SMAD3 + oe-NC group. Cell experiments were repeated three times
Fig. 9
Fig. 9
SMAD3 from CAFs induces tumor growth by activating the ITGA6/PI3K/Akt pathway in vivo. Nude mice were treated with H460/oe-NC + Gy, H460/NAF + Gy, H460/oe-SMAD3 + Gy, H460/CAFs + Gy, H460/oe-SMAD3 + sh-NC + Gy, H460/CAFs + sh-NC + Gy, H460/oe-SMAD3 + sh-ITGA6 + Gy and H460/CAFs + sh-ITGA6 + Gy. A Schematic diagram of xenografts in nude mice. B Tumor volume of nude mice. C Tumor weight of nude mice. D Expression of SMAD3 and ITGA6 in tumor tissues of nude mice determined by RT-qPCR. E Western blot of SMAD3, ITGA6 and the PI3K/Akt pathway-related proteins in tumor tissues of nude mice. F Cell proliferation in tumor tissues of mice determined by immunohistochemical staining for Ki67. G Cell apoptosis in tumor tissues of mice determined by TUNEL staining. n = 10. *p < 0.05 vs. H460/oe-NC + Gy or H460/NAF + Gy group. #p < 0.05 vs. H460/oe-SMAD3 + sh-NC + Gy or H460/NAF + sh-NC + Gy group
Fig. 10
Fig. 10
The mechanism graph of the regulatory network and function of SMAD3 in radioresistance of NSCLC. SMAD3 is significantly enriched in CAFs, which may promote the radioresistance of NSCLC cells by activating the ITGA6/PI3K/Akt pathway

Similar articles

Cited by

References

    1. Tong Q, Ouyang S, Chen R, Huang J, Guo L. MYCN-mediated regulation of the HES1 promoter enhances the chemoresistance of small-cell lung cancer by modulating apoptosis. Am J Cancer Res. 2019;9(9):1938–1956. - PMC - PubMed
    1. Quintanal-Villalonga Á, Molina-Pinelo S. Epigenetics of lung cancer: a translational perspective. Cell Oncol (Dordr) 2019;42(6):739–756. doi: 10.1007/s13402-019-00465-9. - DOI - PubMed
    1. Li C, Fan K, Qu Y, et al. Deregulation of UCA1 expression may be involved in the development of chemoresistance to cisplatin in the treatment of non-small-cell lung cancer via regulating the signaling pathway of microRNA-495/NRF2. J Cell Physiol. 2020;235(4):3721–3730. doi: 10.1002/jcp.29266. - DOI - PubMed
    1. Hammad A, Namani A, Elshaer M, Wang XJ, Tang X. “NRF2 addiction” in lung cancer cells and its impact on cancer therapy. Cancer Lett. 2019;467:40–49. doi: 10.1016/j.canlet.2019.09.016. - DOI - PubMed
    1. Tang X, Chen H, Chen G, et al. Validated LC-MS/MS method of Sphingosine 1-phosphate quantification in human serum for evaluation of response to radiotherapy in lung cancer. Thorac Cancer. 2020;11(6):1443–1452. doi: 10.1111/1759-7714.13409. - DOI - PMC - PubMed

Publication types

MeSH terms