

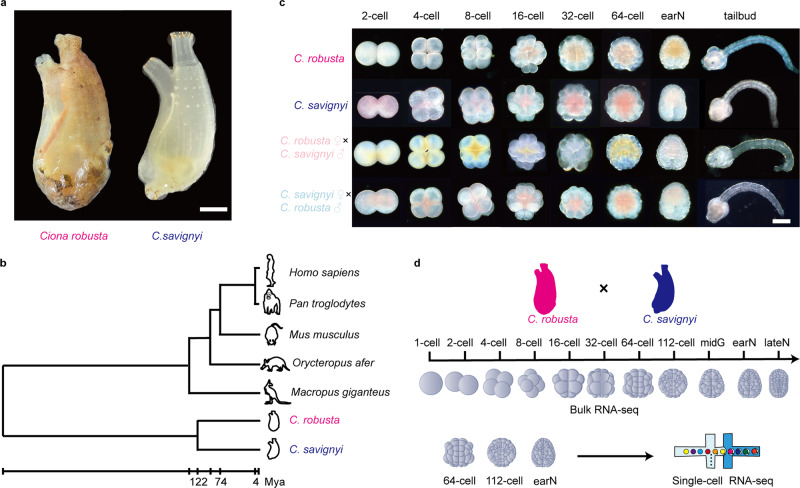
Temporospatial hierarchy and allele-specific expression of zygotic genome activation revealed by distant interspecific urochordate hybrids
- PMID: 38493164
- PMCID: PMC10944513
- DOI: 10.1038/s41467-024-46780-0
Temporospatial hierarchy and allele-specific expression of zygotic genome activation revealed by distant interspecific urochordate hybrids
Abstract
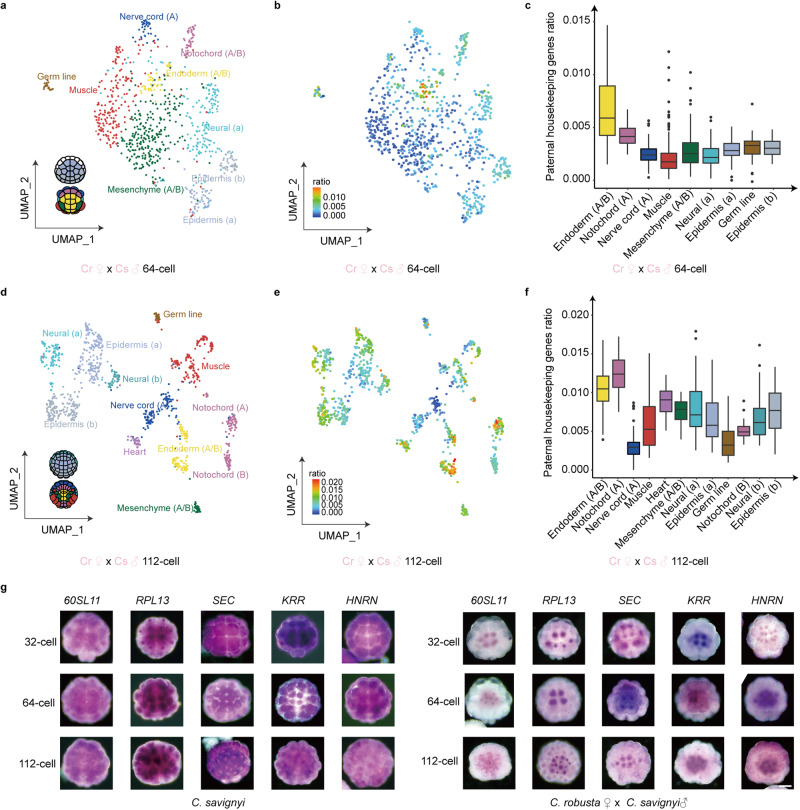
Zygotic genome activation (ZGA) is a universal process in early embryogenesis of metazoan, when the quiescent zygotic nucleus initiates global transcription. However, the mechanisms related to massive genome activation and allele-specific expression (ASE) remain not well understood. Here, we develop hybrids from two deeply diverged (120 Mya) ascidian species to symmetrically document the dynamics of ZGA. We identify two coordinated ZGA waves represent early developmental and housekeeping gene reactivation, respectively. Single-cell RNA sequencing reveals that the major expression wave exhibits spatial heterogeneity and significantly correlates with cell fate. Moreover, allele-specific expression occurs in a species- rather than parent-related manner, demonstrating the divergence of cis-regulatory elements between the two species. These findings provide insights into ZGA in chordates.
© 2024. The Author(s).
Conflict of interest statement
The authors declare no competing interests.
Figures


References
MeSH terms
LinkOut - more resources
Full Text Sources
