. 2024 Mar 16;19(1):25.
doi: 10.1186/s13024-024-00715-x.

Rejuvenating aged microglia by p16ink4a-siRNA-loaded nanoparticles increases amyloid-β clearance in animal models of Alzheimer's disease

Affiliations

Rejuvenating aged microglia by p16ink4a-siRNA-loaded nanoparticles increases amyloid-β clearance in animal models of Alzheimer's disease

Hyo Jung Shin et al. Mol Neurodegener. .

Abstract

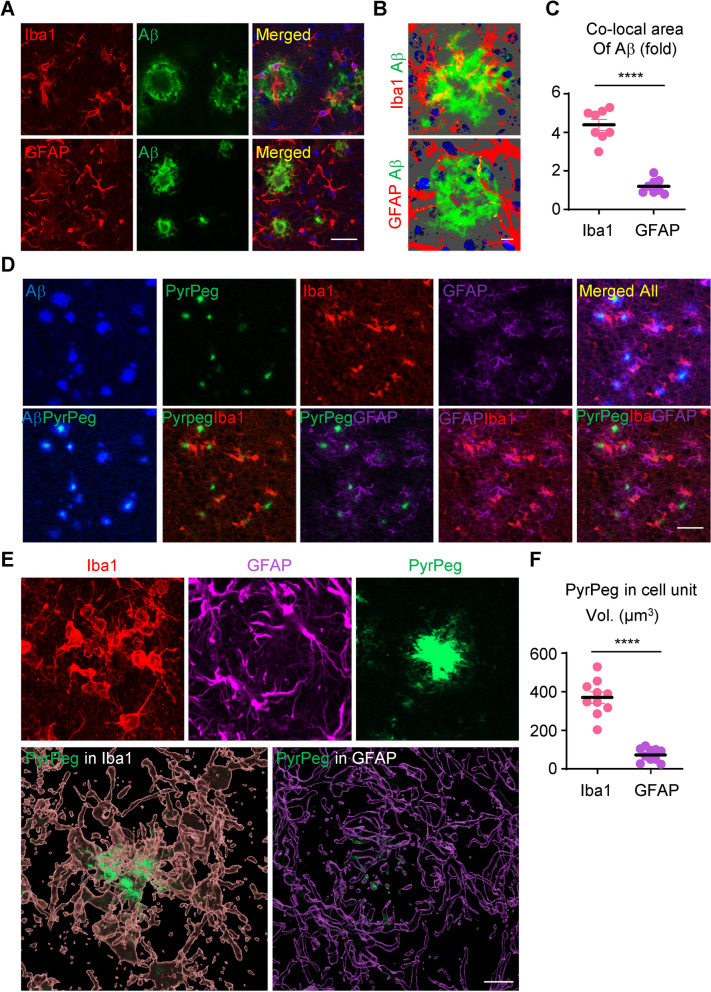
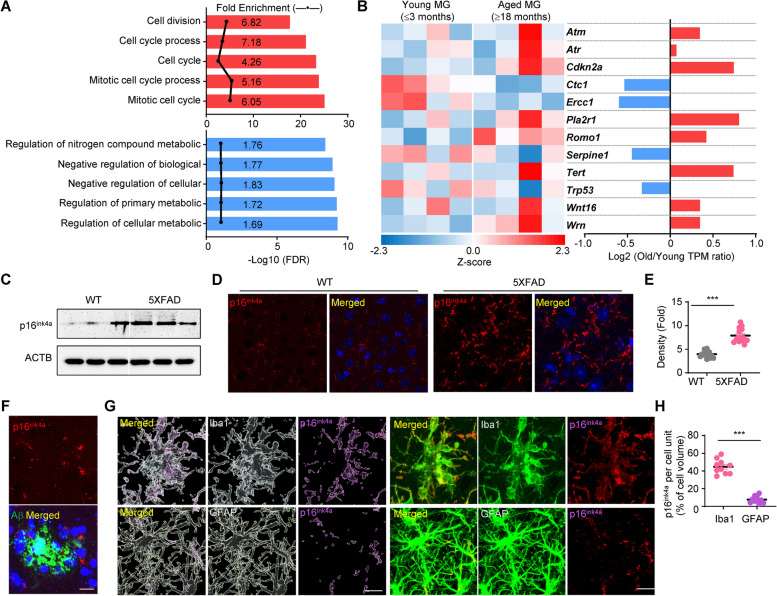
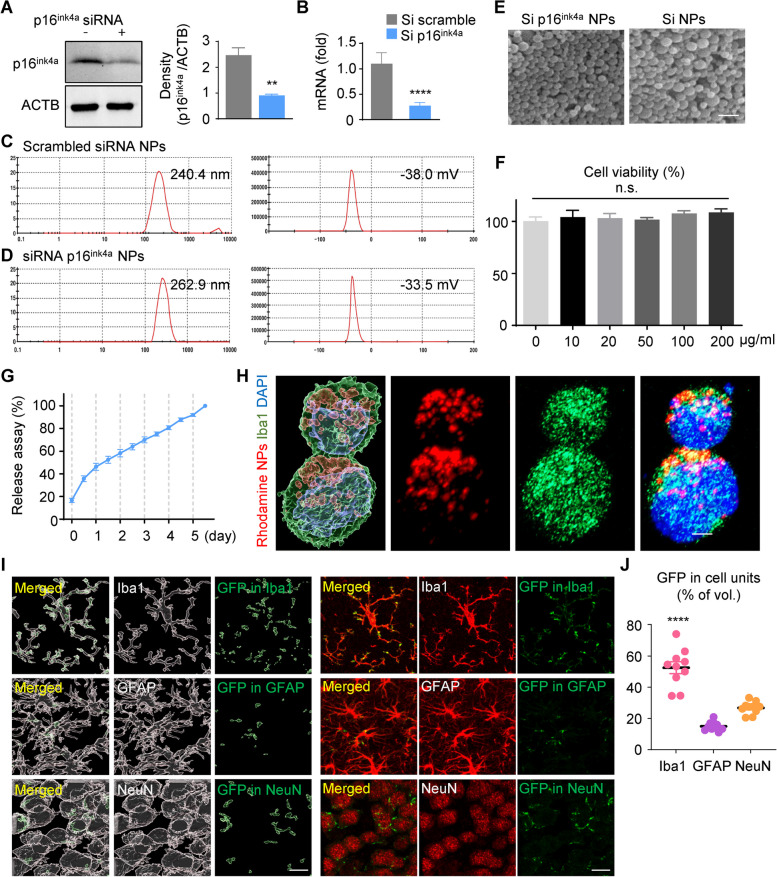
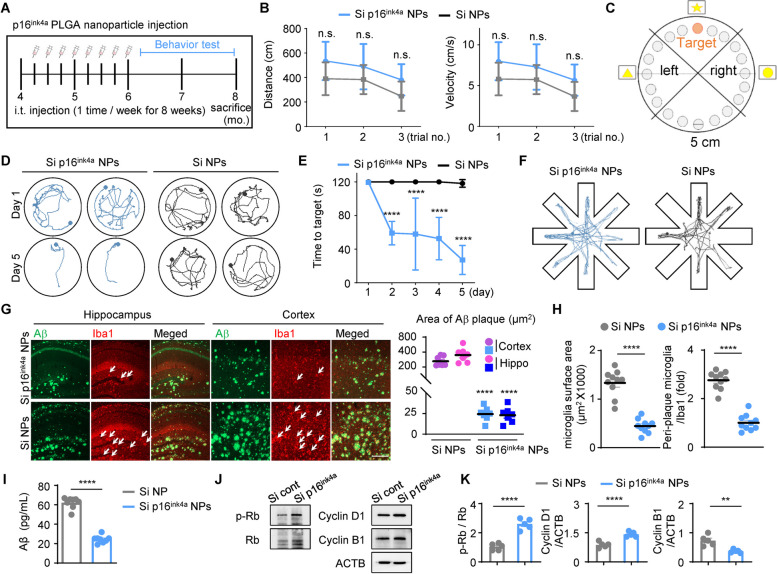
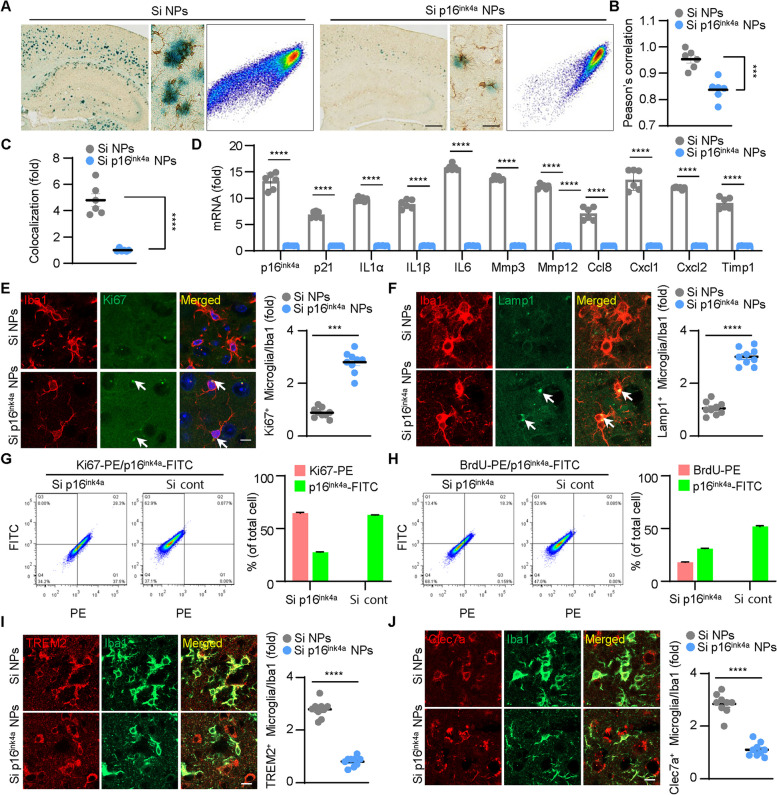
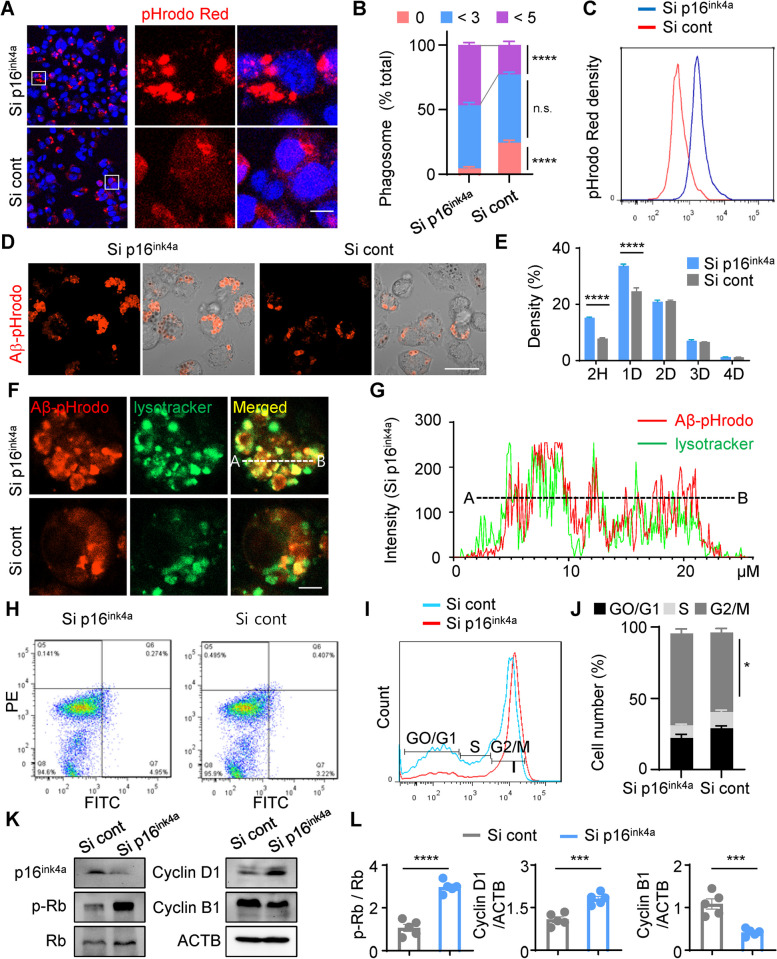
Age-dependent accumulation of amyloid plaques in patients with sporadic Alzheimer's disease (AD) is associated with reduced amyloid clearance. Older microglia have a reduced ability to phagocytose amyloid, so phagocytosis of amyloid plaques by microglia could be regulated to prevent amyloid accumulation. Furthermore, considering the aging-related disruption of cell cycle machinery in old microglia, we hypothesize that regulating their cell cycle could rejuvenate them and enhance their ability to promote more efficient amyloid clearance. First, we used gene ontology analysis of microglia from young and old mice to identify differential expression of cyclin-dependent kinase inhibitor 2A (p16ink4a), a cell cycle factor related to aging. We found that p16ink4a expression was increased in microglia near amyloid plaques in brain tissue from patients with AD and 5XFAD mice, a model of AD. In BV2 microglia, small interfering RNA (siRNA)-mediated p16ink4a downregulation transformed microglia with enhanced amyloid phagocytic capacity through regulated the cell cycle and increased cell proliferation. To regulate microglial phagocytosis by gene transduction, we used poly (D,L-lactic-co-glycolic acid) (PLGA) nanoparticles, which predominantly target microglia, to deliver the siRNA and to control microglial reactivity. Nanoparticle-based delivery of p16ink4a siRNA reduced amyloid plaque formation and the number of aged microglia surrounding the plaque and reversed learning deterioration and spatial memory deficits. We propose that downregulation of p16ink4a in microglia is a promising strategy for the treatment of Alzheimer's disease.

Keywords: Alzheimer’s disease; Cell cycle; Microglia senescence; Phagocytosis; p16ink4a.


Conflict of interest statement

The authors declare that there is no conflict of interest.

Figures

Fig. 1
Fig. 1
Microglia that contain aggregated amyloid-β are activated and are located near neuritic plaques in 5XFAD mice. A Z-stack images of brain tissue from 5XFAD mice after staining with Iba1 or GFAP in the peri-plaque region. Scale bar: 200 µm. B Three-dimensional reconstruction of Z-stack images in which Aβ overlaps with staining by anti-Iba1 antibody or anti-GFAP antibody. Scale bar: 10 µm. C Quantification of Aβ volumes co-localized with glial volumes, as measured in cell units. ****p < 0.001, Aβ volume in Iba1 volume versus Aβ volume in GFAP volume; unpaired Student’s t test. D Representative images of 5XFAD mouse brain sections stained with an anti-Aβ antibody (blue), PyrPeg (green), anti-Iba1 antibody (red), and anti-GFAP antibody (magenta). Scale bar: 100 µm. E Orthogonal view of a 3-dimensional reconstruction of confocal images showing co-localization of an Aβ plaque (green) with Iba1(pink) or GFAP (purple). Scale bar: 10 µm. F Quantification of PyrPeg co-localized with microglia versus astrocytes, as measured in cell units. ****p < 0.001, PyrPeg volume in Iba1 volume versus PyrPeg volume in GFAP volume; unpaired Student’s t test
Fig. 2
Fig. 2
Cdkn2a and its coding protein p16ink4a are increased in senescent microglia, but not astrocytes or neurons, in postmortem brains of patients with Alzheimer’s disease and 8-month-old 5XFAD mice. A Top 5 gene ontology biological process pathways involved in Aβ42-positive microglia from old mice compared with young mice. The upper panel (red) and lower panel (blue) show the pathways enriched by increased and decreased gene expression, respectively. FDR: false discovery rate. B Heat map representing gene expression relating to replicative senescence (GO0090399) in Aβ42-positive microglia (MG) from young and old mice (n = 4 for each group). The scale represents the Z-score from 2.3 (highest expression) to − 2.3 (lowest expression). The bar graph reveals the ratio of the gene expression levels in Aβ42-positive microglia between young and old mice. C Western blot of the protein levels of p16ink4a in brain tissue from WT and 5XFAD mice. ACTB: β-actin. D Immunohistochemistry of p16ink4a and DAPI staining in brain tissue from WT and 5XFAD mice. Scale bar: 100 µm. E Quantification of the protein levels in (D). ***p < 0.005, 5XFAD versus WT; unpaired Student’s t test. F Z-stack confocal images of p16ink4a (red) with Aβ plaque (green). Scale bar: 20 µm. G Representative images show p16ink4a expression (purple) with Iba1 or GFAP immunostaining. Representative images were constructed using Imaris software. Scale bar: 20 µm. H The percentage of p16ink4a expression per cell volume. ***p < 0.005, Iba1 versus GFAP; unpaired Student’s t test
Fig. 3
Fig. 3
Characterization and morphology analysis of poly(D,L-lactic-co-glycolic acid) nanoparticles with p16ink4a siRNA or scrambled siRNA. A Western blot and quantification of the protein levels of p16ink4a after siRNA transfection in BV2 cells. **p < 0.01, versus scrambled siRNA control; unpaired Student’s t test. ACTB: β-actin. B mRNA expression of p16ink4a was quantified by qPCR after transfection in BV2 cells. The data are expressed as the mean ± SEM. ****p < 0.001, versus scrambled siRNA control, unpaired Student’s t test. C,D The size and zeta potential of NPs containing scrambled siRNA (Si) (C) and p16ink4a siRNA (D). E Scanning electron microscope images of NPs. Scale bar: 300 nm. Original magnification: 15,000 × . F MTT cytotoxicity assay of BV2 cells incubated with p16ink4a siRNA encapsulated PLGA NPs (0–200 µg/mL) for 24 h. Data are expressed as mean ± SEM (n = 4) and were analyzed by 1-way ANOVA followed by the Tukey test for multiple comparisons. n.s.: not significant. G The encapsulation efficiency of siRNA NPs as measured by the release of siRNA over 5 days by Nanodrop spectrophotometer. We achieved encapsulation of 31.8% ± 0.1% (mean ± SEM) of the total siRNA into PLGA NPs. H BV2 cells immunostained with anti-Iba1 antibody and 4′,6-diamidino-2-phenylindole (DAPI) after treatment with rhodamine-tagged PLGA NPs for 3 h. Representative images were constructed using Imaris software. Scale bar: 10 µm. I Immunostaining of brain tissues 3 days after injection of AAV-GFP plasmid-loaded PLGA NPs. Tissues were stained with antibodies to Iba1 (microglia marker), GFAP (astrocyte marker), and NeuN (neuronal marker) to visualize the distribution of GFP in the cortex. Representative images were constructed with Imaris software, and GFP fluorescence merged into each cell-type marker was expressed by image sorting. Scale bar: 20 µm. J The volume of merged GFP for each cell-type marker was graphed as a percentage of the total GFP volume. Data are expressed as the mean ± SEM (n = 10 for each group) and were analyzed by 1-way ANOVA followed by the Tukey test for multiple comparisons. ****p < 0.001, Iba1 versus GFAP, and Iba1 versus NeuN
Fig. 4
Fig. 4
Microglia-specific p16ink4a downregulation protects against deterioration of spatial memory and learning in the 5XFAD mouse model of Alzheimer’s disease and promotes the division of microglia, which interferes with cellular senescence. A Schematic of the experimental design for PLGA NP injection into 5XFAD mice. i.t.: intrathecal. B Distance and velocity graphs from the Barnes maze test for mice injected with p16ink4a siRNA NPs or scrambled siRNA NPs. Data are expressed as mean ± SEM (n = 7) of 3 trials and were analyzed by 2-way ANOVA followed by the Bonferroni test for multiple comparisons. n.s.: not significant. C Schematic of the experimental design for the Barnes maze test. D Representative movement paths of mice in the probe test of the Barnes maze test 24 h after the last training day. E The time taken for mice to reach the target in the Barnes maze test over 5 training days. Data are expressed as mean ± SEM (n = 8) and were analyzed by 2-way ANOVA followed by the Bonferroni test for multiple comparisons. ****p < 0.001 F Representative searching tracks of mice injected with p16ink4a NPs or scrambled siRNA NPs in the radial maze test. G In both cortex and hippocampus, Aβ and Iba1 immunostaining paralleled a decrease in the area covered by Aβ plaques in mice injected with p16ink4a siRNA NPs. Scale bar: 100 µm. Data are expressed as mean ± SEM (n = 7) and were analyzed by 1-way ANOVA followed by the Tukey test for multiple comparisons. ****p < 0.001 H The surface area of microglia and the number of microglia around the plaque were measured. White arrows indicate masses of 3 or more microglia around the plaque. ****p < 0.001, versus scrambled siRNA NPs; unpaired Student’s t test. I ELISA of cortex lysate showed decreased of Aβ1-42 of mice infected with PLGA NPs. Each protein lysate samples from cortex were measured based on 50 μg by bradford assay. ****p < 0.001, versus scrambled siRNA NPs; unpaired Student’s t test. J Western blot of p-Rb, Rb, cyclin D1, and cyclin B1 expression in cortex tissue of mice injected with PLGA NPs. β-Actin (ACTB) was used as a protein loading control. K Quantification of the protein levels in (J) after injection of p16ink4a siRNA PLGA NPs in 5XFAD mice brain tissue. **p < 0.01 and ****p < 0.001, versus scrambled siRNA PLGA NPs; unpaired Student’s t test
Fig. 5
Fig. 5
Decreased expression of p16ink4a reduces the number of senescent microglia and initiates new cell divisions, reducing dysfunctional disease-associated microglia (DAM). A SA-β-gal activity (blue) and immunostaining with anti-Iba1 antibody (brown). Yellow arrows indicate senescent cells (blue) that merge with Iba1-stained cells (brown). The second images indicate the magnified area. Scale bar: (left) 300 µm, (right) 20 µm. The third images show scatter plot of each staining images. B Comparison of Pearson’s correlation coefficient for Iba1 channel and SA-β-gal activity channel in brain tissue. ***p < 0.005, versus scrambled siRNA NPs; unpaired Student’s t test. C Graph representing results of colocalization analysis the colocalization plugin from ImageJ program. Results are presented as the mean ± SEM. ****p < 0.001, versus p16ink4a siRNA NPs; unpaired Student’s t test (n = 6). D The mRNA levels of the cyclin-dependent kinase inhibitors, p21, and a panel of SASP factors were determined by RT-qPCR. ****p < 0.001, versus p16ink4a siRNA NPs; unpaired Student’s t test (n = 6). E Co-localization of Ki67 (proliferative marker) and Iba1 (microglia marker). White arrows indicate microglia merged with Ki67. Scale bar: 20 µm. ***p < 0.005, versus scrambled siRNA NPs; unpaired Student’s t test. F Co-localization of Lamp1 (Lysosomal activity marker) and Iba1 (microglia marker). White arrows indicate microglia merged with Lamp1. Scale bar: 20 µm. ****p < 0.001, versus scrambled siRNA NPs; unpaired Student’s t test. G Dot plots from a representative BV2 cells with transfected p16ink4a siRNA and scrambled siRNA are shown. The plot shows the increased expression of ki67 in the p16ink4a siRNA transfected BV2 cell group compared scrambled siRNA transfected cell group. All data were used for each experiment that was repeated three times. H Dot plots from a representative BV2 cells with transfected p16ink4a siRNA and scrambled siRNA are shown. The plot shows the increased expression of BrdU in the p16ink4a siRNA transfected BV2 cell group compared scrambled siRNA transfected cell group. 45 h after siRNA transfection, BrdU was treated for 3 h. All data were used for each experiment that was repeated three times. I Co-localization of TREM2 (Disease associated microglia marker) and Iba1 (microglia marker). Scale bar: 20 µm. ****p < 0.001, versus scrambled siRNA NPs; unpaired Student’s t test. J Co-localization of Clec7a (Disease associated microglia marker) and Iba1 (microglia marker). Scale bar: 20 µm. ****p < 0.001, versus scrambled siRNA NPs; unpaired Student’s t test
Fig. 6
Fig. 6
Downregulation of p16ink4a improves microglial BV2 cell proliferation and efficiently increases cellular phagocytosis and amyloid-β lysis. A Confocal images of BV2 cells transfected with p16ink4a siRNA or scrambled siRNA and, 48 h later, treated with pHrodo bioparticle conjugates for 3 h. Scale bar: 20 µm. B The percentage of the number of phagosomes in each BV2 cell, separated into groups of 0, < 3, and < 5 phagosomes per cell. Data were analyzed by 2-way ANOVA followed by the Tukey test for multiple comparisons. ****p < 0.001, versus scrambled siRNA. n.s.: not significant. C FACS analysis of pHrodo-treated BV2 cells. D BV2 cells transfected with siRNA were treated with Aβ-pHrodo for 1 h. Scale bar: 20 µm. E BV2 cells were treated with Aβ-pHrodo for 2 h, harvested, and analyzed by FACS immediately (2 h after treatment) and on days 1, 2, 3, and 4 after treatment. Data were analyzed by 2-way ANOVA followed by the Tukey test for multiple comparisons. ****p < 0.001, versus scrambled siRNA. D: day, H: hour. F Merged representative images of BV2 cells treated with Aβ-pHrodo and LysoTracker. Scale bar: 5 µm. G Analysis of the fluorescence intensity along the white line from A to B from the upper merged image in (F). H Representative FACS data of BV2 cells double-stained with annexin V and propidium iodide. The 4 populations are non-apoptotic dead cells (Q5), late-apoptotic cells (Q6), viable cells (Q8), and early-apoptotic cells (Q7). I Representative FACS data of the cell cycle phases of BV2 cells transfected with scrambled siRNA or p16ink4a siRNA. J The percentages of cells in G0/G1, S, and G2/M phases for p16ink4a siRNA-transfected BV2 cells compared with scrambled siRNA-transfected control BV2 cells. This experiment was repeated 3 times, and similar results were obtained each time. Data were analyzed by 2-way ANOVA followed by the Bonferroni test for multiple comparisons. *p < 0.05, versus scrambled siRNA. K Western blot of p16ink4a, p-Rb, Rb, cyclin D1, and cyclin B1 expression in BV2 cells. β-Actin (ACTB) was used as a protein loading control. L Quantification of the protein levels in (K) after siRNA transfection in BV2 cells. ***p < 0.005 and ****p < 0.001, versus scrambled siRNA; unpaired Student’s t test. Cont: control, Si: siRNA

References

    1. Madhavan A, Schwarz CG, Duffy JR, Strand EA, Machulda MM, Drubach DA, Kantarci K, Przybelski SA, Reid RI, Senjem ML, et al. Characterizing White Matter Tract Degeneration in Syndromic Variants of Alzheimer's Disease: A Diffusion Tensor Imaging Study. J Alzheimers Dis. 2016;49:633–643. doi: 10.3233/JAD-150502. - DOI - PMC - PubMed
    1. Gold CA, Budson AE. Memory loss in Alzheimer's disease: implications for development of therapeutics. Expert Rev Neurother. 2008;8:1879–1891. doi: 10.1586/14737175.8.12.1879. - DOI - PMC - PubMed
    1. Ahn HJ, Zamolodchikov D, Cortes-Canteli M, Norris EH, Glickman JF, Strickland S. Alzheimer's disease peptide beta-amyloid interacts with fibrinogen and induces its oligomerization. Proc Natl Acad Sci U S A. 2010;107:21812–21817. doi: 10.1073/pnas.1010373107. - DOI - PMC - PubMed
    1. Yuan HF, Li X, Quan QK, Wang NN, Li Y, Li M. Effects of Naoerkang on expressions of beta-amyloid peptide 1–42 and neprilysin in hippocampus in a rat model of Alzheimer's disease. Zhong Xi Yi Jie He Xue Bao. 2010;8:152–157. doi: 10.3736/jcim20100210. - DOI - PubMed
    1. Singh SK, Srivastav S, Yadav AK, Srikrishna S, Perry G. Overview of Alzheimer's Disease and Some Therapeutic Approaches Targeting A beta by Using Several Synthetic and Herbal Compounds. Oxid Med Cell Longev. 2016;2016:7361613. doi: 10.1155/2016/7361613. - DOI - PMC - PubMed