. 2024 Mar 16;15(1):2391.
doi: 10.1038/s41467-024-46506-2.

Ultrasound-induced reorientation for multi-angle optical coherence tomography

Affiliations

Ultrasound-induced reorientation for multi-angle optical coherence tomography

Mia Kvåle Løvmo et al. Nat Commun. .

Abstract

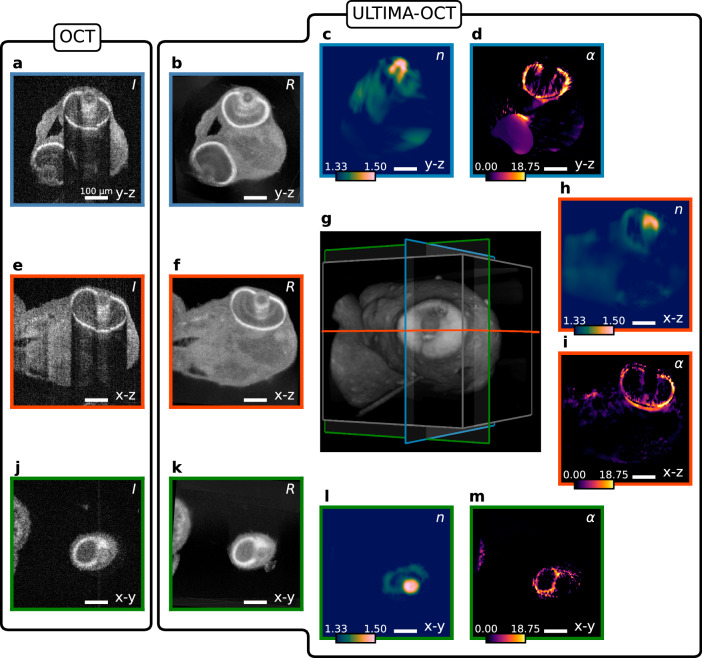
Organoid and spheroid technology provide valuable insights into developmental biology and oncology. Optical coherence tomography (OCT) is a label-free technique that has emerged as an excellent tool for monitoring the structure and function of these samples. However, mature organoids are often too opaque for OCT. Access to multi-angle views is highly desirable to overcome this limitation, preferably with non-contact sample handling. To fulfil these requirements, we present an ultrasound-induced reorientation method for multi-angle-OCT, which employs a 3D-printed acoustic trap inserted into an OCT imaging system, to levitate and reorient zebrafish larvae and tumor spheroids in a controlled and reproducible manner. A model-based algorithm was developed for the physically consistent fusion of multi-angle data from a priori unknown angles. We demonstrate enhanced penetration depth in the joint 3D-recovery of reflectivity, attenuation, refractive index, and position registration for zebrafish larvae, creating an enabling tool for future applications in volumetric imaging.


Conflict of interest statement

The authors declare no competing interests.

Figures

Fig. 1
Fig. 1. Schematics and workflow of ULTrasound-Induced reorientation for Multi-Angle-OCT (ULTIMA-OCT).
a Depicts the fluid-filled acoustic chamber in which the sample is levitated and reoriented by means of acoustic actuation. The specimen is rotated in a step-wise manner into several stable trapping positions (b), and optical coherence microscopy (OCM) imaging is performed in each of them (c). The acquired OCM data is post-processed (d) and fed into a multiscale optimization algorithm (e), which performs a fusion of the images and outputs 3D reconstructions (f) of reflectivity R, attenuation α, and refractive index (RI) contrast Δn. In (g), an exemplary collection of samples is shown, where ULTIMA-OCT can be applied.
Fig. 2
Fig. 2. Acoustic actuation for multi-angle imaging.
a An illustration of acoustic manipulation of levitated zebrafish embryo (not to scale). By coupling bulk acoustic waves into the fluid-filled chamber from multiple directions, acoustic standing waves (green) are generated upon reflection, to levitate the sample and induce transient rotations for optical imaging (red beam), e.g., for multi-angle high-speed OCM through the bottom cover glass of the 3D printed octagon frame (black). The direction of rotation in the xz-planes is indicated (blue arrow). b Assembled octagon chamber with levitated zebrafish embryo (inside stippled red circle), scale bar: 5 mm. c The optimization of the acoustic actuation can be carried out on an inverted microscope with optical image acquisition. As an example, darkfield (oblique illumination) images of a wild-type 3 dpf zebrafish embryo are shown here, for a selection of eight chosen angles of acoustic reorientation, scale bar: 600 μm.
Fig. 3
Fig. 3. OCM limitations.
a An average intensity projection for zebrafish embryo and standard deviation projection for melanoma spheroid, both in logarithmic scale (OCM en face images). b Cross-section images for zebrafish embryo and melanoma spheroid in logarithmic scale. Cross-section image positions are indicated by the yellow dash lines in the OCM en face images in (a). Shadow artifacts are indicated by the yellow dashed boxes in the OCM cross-section images. Scale bars: 200 μm.
Fig. 4
Fig. 4. OCM en face images of acoustically reoriented 5 dpf zebrafish embryo.
a OCM en face images of the head section and b full body images of a zebrafish embryo (mutation Mitfab692/b692/ednrb1b140/b140). Frame colors indicate corresponding angles. Scale bars: 200 μm.
Fig. 5
Fig. 5. Reconstruction results for the head section of a 3 dpf wild-type zebrafish embryo.
ad The ( yz), e, f, h, i the (xz), and jm depict the (xy) sections of the reconstructions. The leftmost column (a, e, j) shows the sections of the recorded OCM volumes in logarithmic scale, whereas the adjacent column (b, f, k) shows the reconstructed reflectivity map R of the same sections in logarithmic scale. d, i, m Show the slices of the reconstructed attenuation map α (in mm−1), whereas c, h, l depict the sections through the reconstructed RI distribution n. In (g), a 3D rendering of the reconstructed reflectivity map is shown, together with the planes shown in (af) and (hm). Scale bars: 100 μm.
Fig. 6
Fig. 6. Reconstruction results for the head section of a 3 dpf zebrafish embryo of a mutation with reduced pigmentation.
ad The (y–z), e, f, h, i the (xz), and jm depict the (xy) sections of the reconstructions. The leftmost column (a, e, j) shows the sections of the recorded OCM volumes in logarithmic scale, whereas the adjacent column (b, f, k) shows the reconstructed reflectivity map R of the same sections in logarithmic scale. d, i, m Show the slices of the reconstructed attenuation map α (in mm−1), whereas c, h, l depict the sections through the reconstructed RI distribution n. In (g), a 3D rendering of the reconstructed reflectivity map is shown, together with the planes shown in (af) and (hm). Scale bars: 100 μm.
Fig. 7
Fig. 7. The schematic of the OCM system and the add-on acoustic chamber.
RC reflective collimator, M mirror, BS beam splitter, VNDF variable neutral density filter, CM concave mirror, O objective, Gx x galvanometer scanner, Gy y galvanometer scanner. Credit to Thorlabs Inc. for drawings of optical components (RC04APC-P01, PF10-03-P01, CM254-050-P01, BS065, B4C/M, C4W, KM100, KS05T/M, LMR05/M, TRF90/M, CP35/M, NDC-50C-4, RMS10X, MAX313D/M, RP01/M, BA2/M, AP90/M, TR75V/M).

References

    1. Sakalem ME, De Sibio MT, da Costa FAdS, de Oliveira M. Historical evolution of spheroids and organoids, and possibilities of use in life sciences and medicine. Biotechnol. J. 2021;16:2000463. doi: 10.1002/biot.202000463. - DOI - PubMed
    1. Gunti S, Hoke AT, Vu KP, London Jr NR. Organoid and spheroid tumor models: techniques and applications. Cancers. 2021;13:874. doi: 10.3390/cancers13040874. - DOI - PMC - PubMed
    1. Kozlowski MT, Crook CJ, Ku HT. Towards organoid culture without matrigel. Commun. Biol. 2021;4:1387. doi: 10.1038/s42003-021-02910-8. - DOI - PMC - PubMed
    1. Aisenbrey EA, Murphy WL. Synthetic alternatives to Matrigel. Nat. Rev. Mater. 2020;5:539–551. doi: 10.1038/s41578-020-0199-8. - DOI - PMC - PubMed
    1. Habaza M, Gilboa B, Roichman Y, Shaked NT. Tomographic phase microscopy with 180∘ rotation of live cells in suspension by holographic optical tweezers. Opt. Lett. 2015;40:1881–1884. doi: 10.1364/OL.40.001881. - DOI - PubMed