. 2024 Mar 16;14(1):6388.
doi: 10.1038/s41598-024-57043-9.

Protein kinase C activity modulates nuclear Lamin A/C dynamics in HeLa cells

Affiliations

Protein kinase C activity modulates nuclear Lamin A/C dynamics in HeLa cells

Chase C Wesley et al. Sci Rep. .

Abstract

The nuclear lamina serves important functions in the nucleus, providing structural support to the nuclear envelope and contributing to chromatin organization. The primary proteins that constitute the lamina are nuclear lamins whose functions are impacted by post-translational modifications, including phosphorylation by protein kinase C (PKC). While PKC-mediated lamin phosphorylation is important for nuclear envelope breakdown during mitosis, less is known about interphase roles for PKC in regulating nuclear structure. Here we show that overexpression of PKC ß, but not PKC α, increases the Lamin A/C mobile fraction in the nuclear envelope in HeLa cells without changing the overall structure of Lamin A/C and Lamin B1 within the nuclear lamina. Conversely, knockdown of PKC ß, but not PKC α, reduces the Lamin A/C mobile fraction. Thus, we demonstrate an isoform-specific role for PKC in regulating interphase Lamin A/C dynamics outside of mitosis.


Conflict of interest statement

The authors declare no competing interests.

Figures

Figure 1
Figure 1
PKC βI overexpression increases the Lamin A/C mobile fraction. Genome-edited eGFP-LMNA HeLa cells were transfected with plasmids expressing mCherry (Control), mCherry-PKC α-dNPS (PKC α overexpression), or mCherry-PKC βI-dNPS (PKC β1 overexpression). Imaging of eGFP-LMNA was performed. A circular region of eGFP-LMNA within the NE closest to the coverslip was photobleached (see B) and FRAP time lapses were acquired. 10 prebleach images and 121 postbleach images were acquired at regular time intervals for each time lapse. The total postbleach acquisition time was 45 min. (A) Images of eGFP-LMNA from representative FRAP timelapses are shown. Scale bar: 5 µm. (B) Diagram showing how a circular region of eGFP-LMNA within the NE closest to the coverslip was photobleached (red lines). (C) Average fluorescence recovery curves based on full scale normalized data (see “Materials and methods”). Solid lines are normalized average fluorescence. Dashed lines are 95% confidence intervals. (D) Mobile fraction values were calculated as described in Materials and Methods. (E) t1/2 values were calculated as described in Materials and Methods. Y-axis shows base 10 logarithmic scale. On scatter plots, dashed lines represent means. Data were acquired for 23 nuclei from the mCherry control group, 30 nuclei from the mCherry-PKC α-dNPS group, and 33 nuclei from the mCherry-PKC βI-dNPS group based on three independent trials for each group. One-way ANOVA with Dunnett’s multiple comparisons statistical tests were performed, with significance relative to the mCherry control shown. ns, not significant; *p < 0.05.
Figure 2
Figure 2
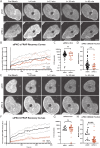
PKC β knockdown decreases the Lamin A/C mobile fraction. eGFP-LMNA HeLa cells were transfected with siRNAs targeting negative control (siSCR), PKC α (siPKC α), or PKC β (siPKC β). FRAP experiments were performed and analyzed as in Fig. 1. (AD) PKC α knockdown experiments. (EH) PKC β knockdown experiments. (A,E) Images from representative timelapses are shown. Scale bars: 5 µm. (B,F) Average fluorescence recovery curves based on full scale normalized data are shown. Solid lines are normalized average fluorescence. Dashed lines are 95% confidence intervals. (C,G) t1/2 values are shown. (D,H) Mobile fraction values are shown. On scatter plots, dashed lines represent means. For (AD), data were acquired for 69 nuclei from the siSCR negative control group and 23 nuclei from the siPKC α group based on at least two independent trials. For (EH), data were acquired for 20 nuclei from the siSCR negative control group and 36 nuclei from the siPKC β group based on three independent trials for each group. Unpaired, two-tailed t tests were performed. ns, not significant; ****p < 0.0001.
Figure 3
Figure 3
PKC βI overexpression does not alter overall nuclear lamina organization or NPC density. (A) eGFP-LMNA HeLa cells were transfected with plasmids expressing mCherry (Control) or mCherry-PKC βI-dNPS (PKC β1 overexpression). Cells were stained with α-Lamin B1 and α-NPC antibodies and superresolution imaging was performed. Images were subjected to skeletonization as described in Materials and Methods. Representative images are shown. Scale bar: 1 µm. NA indicates skeletonization not applicable for NPC staining. (B) Lamin A/C branch lengths were quantified. (C) Lamin B1 branch lengths were quantified. (D) NPC densities were quantified. On scatter plots, dashed lines represent means. For (B), 1419 control and 1222 PKC β overexpression Lamin A/C branches were quantified. For (C), 1040 control and 853 PKC β overexpression Lamin B1 branches were quantified. For (D), 15 control nuclei and 13 PKC β overexpression nuclei were quantified. All data were collected from three biological replicates. Unpaired, two-tailed t tests were performed. ns, not significant.

Similar articles

Cited by

References

    1. Belmont AS, Zhai Y, Thilenius A. Lamin B distribution and association with peripheral chromatin revealed by optical sectioning and electron microscopy tomography. J. Cell Biol. 1993;123:1671–1685. doi: 10.1083/jcb.123.6.1671. - DOI - PMC - PubMed
    1. Shimi T, et al. Structural organization of nuclear lamins A, C, B1, and B2 revealed by superresolution microscopy. Mol. Biol. Cell. 2015;26:4075–4086. doi: 10.1091/mbc.E15-07-0461. - DOI - PMC - PubMed
    1. Guelen L, et al. Domain organization of human chromosomes revealed by mapping of nuclear lamina interactions. Nature. 2008;453:948–951. doi: 10.1038/nature06947. - DOI - PubMed
    1. Peric-Hupkes D, et al. Molecular maps of the reorganization of genome-nuclear lamina interactions during differentiation. Mol. Cell. 2010;38:603–613. doi: 10.1016/j.molcel.2010.03.016. - DOI - PMC - PubMed
    1. Blencowe BJ, Nickerson JA, Issner R, Penman S, Sharp PA. Association of nuclear matrix antigens with exon-containing splicing complexes. J. Cell Biol. 1994;127:593–607. doi: 10.1083/jcb.127.3.593. - DOI - PMC - PubMed