. 2024 Mar 16;15(1):2382.
doi: 10.1038/s41467-024-46589-x.

Maternal dietary fat during lactation shapes single nucleus transcriptomic profile of postnatal offspring hypothalamus in a sexually dimorphic manner in mice

Affiliations

Maternal dietary fat during lactation shapes single nucleus transcriptomic profile of postnatal offspring hypothalamus in a sexually dimorphic manner in mice

Yi Huang et al. Nat Commun. .

Abstract

Maternal overnutrition during lactation predisposes offspring to develop metabolic diseases and exacerbates the relevant syndromes in males more than females in later life. The hypothalamus is a heterogenous brain region that regulates energy balance. Here we combined metabolic trait quantification of mother and offspring mice under low and high fat diet (HFD) feeding during lactation, with single nucleus transcriptomic profiling of their offspring hypothalamus at peak lacation to understand the cellular and molecular alterations in response to maternal dietary pertubation. We found significant expansion in neuronal subpopulations including histaminergic (Hdc), arginine vasopressin/retinoic acid receptor-related orphan receptor β (Avp/Rorb) and agouti-related peptide/neuropeptide Y (AgRP/Npy) in male offspring when their mothers were fed HFD, and increased Npy-astrocyte interactions in offspring responding to maternal overnutrition. Our study provides a comprehensive offspring hypothalamus map at the peak lactation and reveals how the cellular subpopulations respond to maternal dietary fat in a sex-specific manner during development.


Conflict of interest statement

The authors declare no competing interests.

Figures
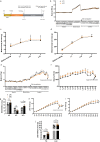
Fig. 1
Fig. 1. Metabolic measurements for mothers fed with different dietary fat during lactation as well as their offspring.
a Diagram of experimental design. b Maternal body weight (BW) (c) body fat mass, d body lean mass, e food intake (FI) and (f) energy intake (EI) from low fat and high fat dietary groups during lactation. Sample sizes of mothers fed low fat diet (LFD) during lactation were 9, for those fed high fat diet (HFD) were 6. g Maternal metabolizable energy intake (MEI), daily energy expenditure (DEE) and milk energy output (MEO) during peak lactation. Sample sizes of maternal LFD group for the measurements were 8, for those from maternal HFD group were 3. p value by GLM adjusted with BW. h Litter and (i) pup mass of offspring raised by mothers fed with different dietary fat during lactation. j Litter fat and lean mass of postnatal day16 offspring raised by mothers fed with different dietary fat. Sample sizes of litters from maternal LFD group were 8, for those from maternal HFD group were 5. p value by one-way ANOVA. * represents p < 0.05, ** represents p < 0.01. ns represents no significance between comparisons. Values are means±s.d. LFD represents low fat diet, HFD represents high fat diet, P represents postnatal in (a). BL represents baseline, L represents lactation in (bi). Source data are provided as a Source Data file.
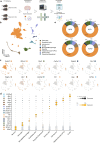
Fig. 2
Fig. 2. Establishing a single nucleus atlas of mouse hypothalamus from postnatal day 15 (P15) male and female offspring raised by mothers fed with different dietary fat during lactation.
a Diagram of single nucleus RNA-seq experiment using 10x Genomics (n = 2 for each maternal dietary group, groups including: fLHD female offspring under maternal low fat diet during lactation, fHFD, female offspring under maternal high fat diet during lactation, mLFD male offspring under maternal low fat diet during lactation, mHFD male offspring under maternal high fat diet during lactation). This image was adapted and created with BioRender.com. b Uniform Manifold Approximation and Projection (UMAP) visualization of key lineages after data integration, colored by different cell types (total cell number after QC = 38,594). c Canonical marker genes for key lineages shown on the UMAP. d Dotplots show the marker genes for key lineages. e Donut plots of the cell proportions of key lineages from female and male offspring under maternal LFD and HFD exposure.
Fig. 3
Fig. 3. Heterogeneity of P15 offspring hypothalamic neuronal subpopulations.
a UMAP of canonical maker genes of glutamatergic, gamma-aminobutyric acid-ergic (GABAergic) as well as histaminergic (HA) neurons. b UMAP of neuronal subpopulations, colored by different neuronal subpopulations. c Dotplot shows the canonical marker genes for neuronal subpopulations. d GO enrichment analysis of cell type specific transcriptomic signatures shows significant enrichment (Padj < 0.05) in metabolic relevant categories of feeding behavior, insulin signaling, glucose homeostasis and circadian rhythm in several neuronal subpopulations. p value was adjusted by Benjamin-Hochberg correction. e Differential abundance analysis (DAseq) shows the enrichment of the abundance of cells from different neuronal subpopulations when comparing fHFD vs mHFD. Colored dots represent the enrichment of abundance in different groups.
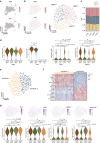
Fig. 4
Fig. 4. Heterogeneity of AgRP/Npy and Avp/Rorb neurons in P15 offspring hypothalamus.
a UMAP of canonical marker genes for AgRP neurons (Agrp and Npy) in neuronal subpopulations. b UMAP of canonical marker genes for AgRP neurons (Agrp and Npy) on the extracted AgRP/Npy neurons. Unsupervised clustering of extracted AgRP/Npy subclusters identified three distinct subtypes. c Barplot of the cell proportions of AgRP subclusters from fHFD, fLFD, mHFD and mLFD groups. d Violin plots of the expression of Agrp, Xist, Brd1 and Hdac3 genes in four groups in AgRP/Npy neurons. * represents P < 0.05 for Wilcoxon test. e Unsupervised clustering of extracted Avp/Rorb subclusters identified two distinct subtypes. f Heatmap of the top 10 differentially expressed genes in each Avp/Rorb subcluster. g Umap and Violin plots of the expressions of Avp, Rorb, Igfbp5 and Gm42418 genes in four groups in Avp/Rorb neurons. * represents p < 0.05, ** represents p < 0.01 and *** represents p < 0.001 for Wilcoxon test. ns represents no significance between comparisons.
Fig. 5
Fig. 5. Heterogeneity of astrocytes and oligodendrocytes in P15 offspring hypothalamus.
a Unsupervised clustering of extracted astrocytes identified two distinct subtypes and the expression of canonical marker genes Gfap (Astrocytes-1) and Slc7a10 (Astrocytes-2) on UMAP. b Trajectory analysis of astrocytes identified a trajectory from subtype Astrocyte-1 to Astrocyte-2. Trajectory related gene expressions along the pseudotime including Myoc, Id1, Id3 and Id4 that represents a more-stemmed status were pseudo-gradually down-regulated wheares genes including Plpp3, Cst3 were up-regulated along the trajectory. c, d UMAP of unsupervised clustering of extracted oligodendrocytes identified five distinct subtypes and the expression of canonical marker genes Pdgfra (oligodendrocyte precursor cells) and Plp1 (oligodendrocytes). Trajectory analysis shows the trajectory from ODC-1 to ODC-5. e Violin plots of canonical marker genes Pdgfra and Plp1 in five oligodendrocyte subclusters. Plp1 shows a gradual change of expression along the differentiation trajectory.
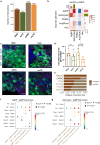
Fig. 6
Fig. 6. Cell-cell interactions in offspring hypothalamus revealed sex- and maternal diet-specific effects.
a Total numbers of cell-cell interactions in fHFD, fLFD, mHFD and mLFD groups. b Overall interactive signaling changes on key neuronal subpopulations and top scoring non-neuronal populations between mHFD and fHFD groups. c Immunohistochemistry staining shows the co-localization of AgRP/Npy neurons and astrocytes. Green cells marked by GFP represent AgRP/Npy neurons, purple cells marked by S100β represent astrocytes, blue dots marked by DAPI represent the nuclei. White overlapping by both GFP and S100β represents the colocalization of AgRP/Npy neurons and astrocytes. d Cell counts of colocalized AgRP/Npy neurons and astrocytes in four groups. Biologically independent animals for fHFD group were 5, for fLFD group were 5, for mHFD group were 5, for mLFD group were 4. p value by two-sided Student’s t test. Values are means ± s.d. * represents p < 0.05 for Wilcoxon test. e The identified key pathways of the interactive signaling between mHFD and fHFD groups. f, g The identified key up-regulated and down-regulated signaling ligand-receptor pairs between the interactions of AgRP neurons and astrocytes in mHFD and fHFD groups. Source data is provided as a Source Data file.

References

    1. World Health Organization. Obesity and overweight. https://www.who.int/news-room/fact-sheets/detail/obesity-and-overweight (2024).
    1. Du Q, et al. Postnatal weight gain induced by overfeeding pups and maternal high-fat diet during the lactation period modulates glucose metabolism and the production of pancreatic and gastrointestinal peptides. Peptides. 2015;70:23–31. doi: 10.1016/j.peptides.2015.05.003. - DOI - PubMed
    1. Gorski JN, et al. Postnatal environment overrides genetic and prenatal factors influencing offspring obesity and insulin resistance. Am. J. Physiol. Regul. Integr. Comp. Physiol. 2006;291:R768–R778. doi: 10.1152/ajpregu.00138.2006. - DOI - PubMed
    1. Guillaumin MCC, et al. Maternal over- and malnutrition and increased risk for addictive and eating disorders in the offspring. Nutrients. 2023;15:1095. doi: 10.3390/nu15051095. - DOI - PMC - PubMed
    1. Li C, et al. Amylin receptor insensitivity impairs hypothalamic POMC neuron differentiation in the male offspring of maternal high-fat diet-fed mice. Mol. Metab. 2021;44:101135. doi: 10.1016/j.molmet.2020.101135. - DOI - PMC - PubMed