. 2024 Mar 16;4(1):50.
doi: 10.1038/s43856-024-00474-2.

Lifestyle and demographic associations with 47 inflammatory and vascular stress biomarkers in 9876 blood donors

Affiliations

Lifestyle and demographic associations with 47 inflammatory and vascular stress biomarkers in 9876 blood donors

Bertram Kjerulff et al. Commun Med (Lond). .

Abstract

Background: The emerging use of biomarkers in research and tailored care introduces a need for information about the association between biomarkers and basic demographics and lifestyle factors revealing expectable concentrations in healthy individuals while considering general demographic differences.

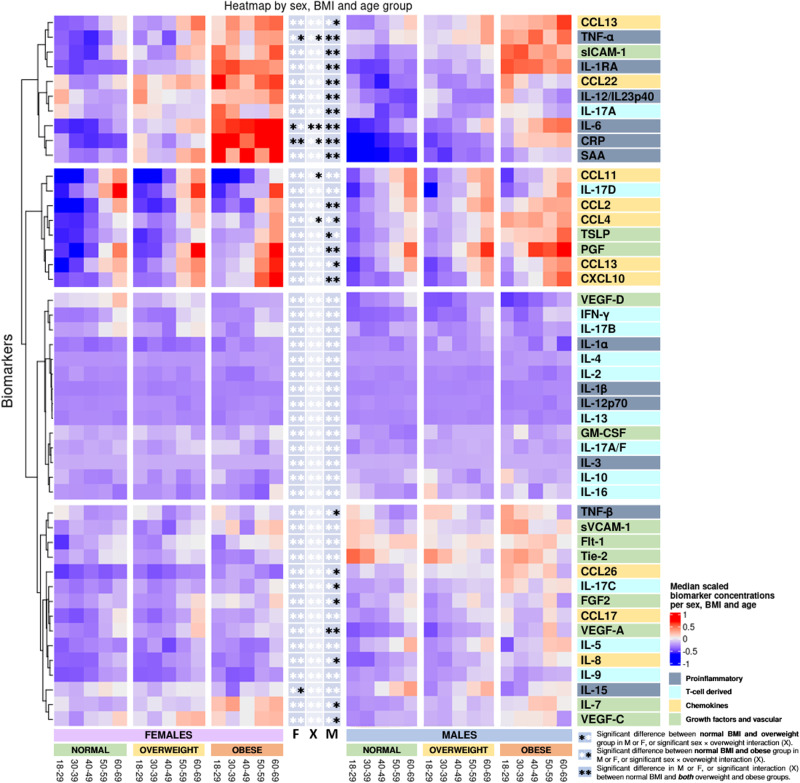
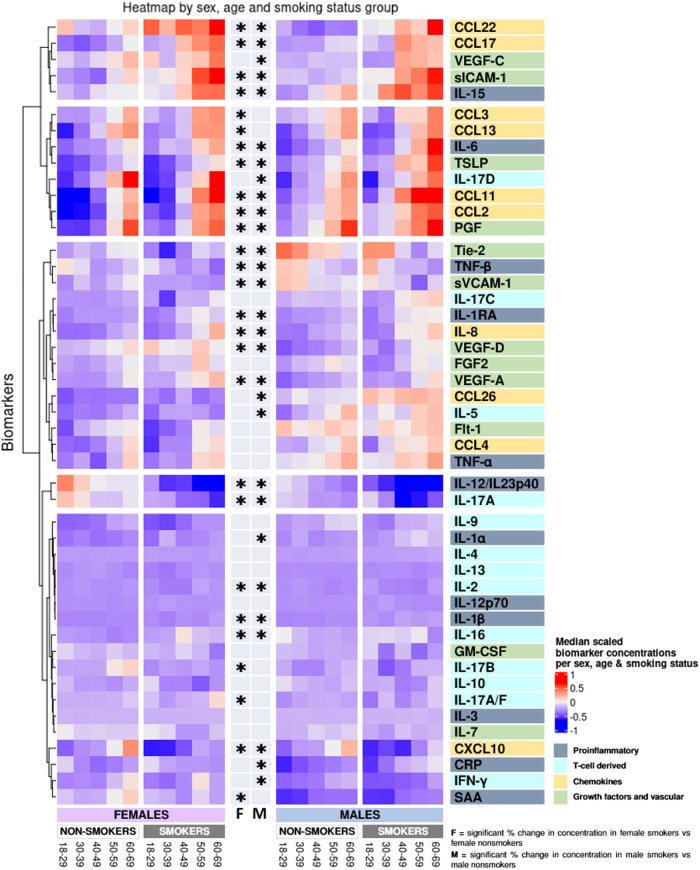
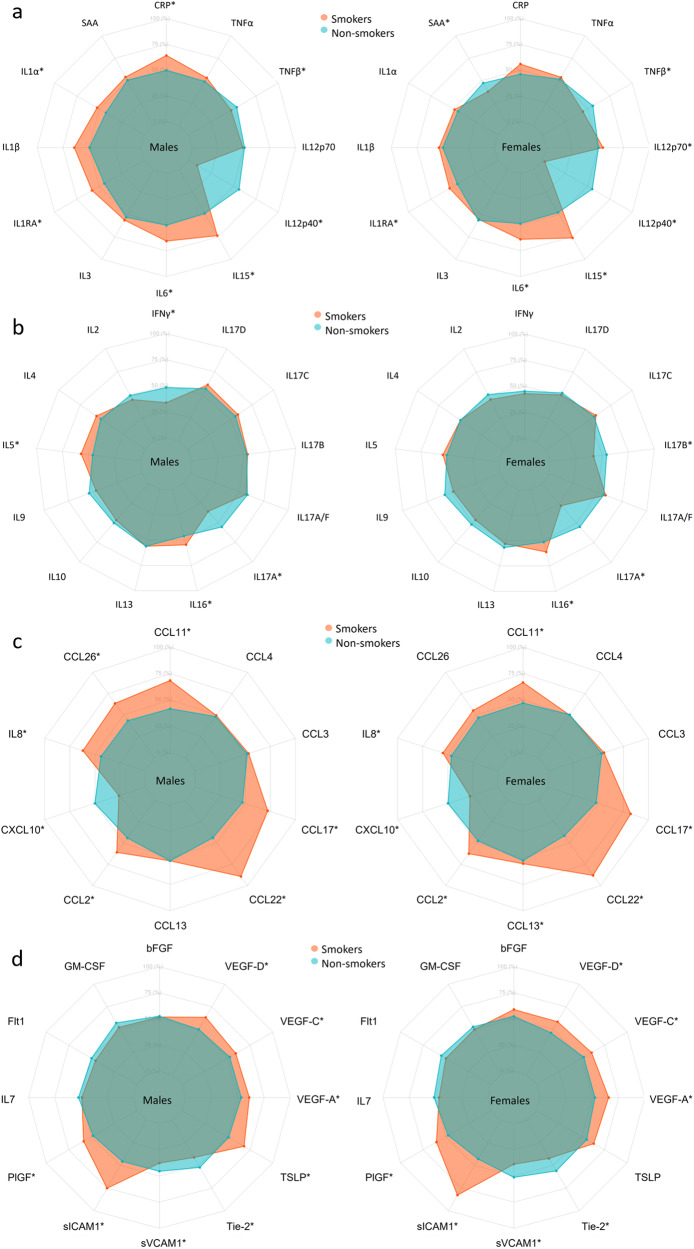
Methods: A selection of 47 biomarkers, including markers of inflammation and vascular stress, were measured in plasma samples from 9876 Danish Blood Donor Study participants. Using regression models, we examined the association between biomarkers and sex, age, Body Mass Index (BMI), and smoking.

Results: Here we show that concentrations of inflammation and vascular stress biomarkers generally increase with higher age, BMI, and smoking. Sex-specific effects are observed for multiple biomarkers.

Conclusion: This study provides comprehensive information on concentrations of 47 plasma biomarkers in healthy individuals. The study emphasizes that knowledge about biomarker concentrations in healthy individuals is critical for improved understanding of disease pathology and for tailored care and decision support tools.

Plain language summary

Blood-based biomarkers are circulating molecules that can help to indicate health or disease. Biomarker levels may vary depending on demographic and lifestyle factors such as age, sex, smoking status, and body mass index. Here, we examine the effects of these demographic and lifestyle factors on levels of biomarkers related to activation of the immune system and cardiovascular stress. Measurements of 47 different proteins were performed on blood samples from nearly 10,000 healthy Danish blood donors. Measurement data were linked with questionnaire data to assess effects of lifestyle. We found that immune activation and vascular stress generally increased with age, BMI, and smoking. As these measurements are from healthy blood donors they can serve as a reference for expectable effects and inflammation levels in healthy individuals. Knowledge about the healthy state is important for understanding disease progression and optimizing care.


Conflict of interest statement

The authors declare no competing interests.

Figures

Fig. 1
Fig. 1. Flow chart of the sample selection.
A random inclusion sample was selected for every participant and the selection was sampled to ensure a subset with equal age and sex distribution. Samples from the pilot study were added to the pool, while samples that could not be identified, were from participants who withdrew consent, or had concerns regarding sample quality were excluded.
Fig. 2
Fig. 2. Heatmap of median scaled biomarker concentrations by sex and age group.
Biomarker labels are color-coded based on their grouping. Biomarkers are clustered by change with age. *Indicates significant change with age in females (F), males (M), or significant interaction between age and sex (X) derived from the linear models in the Supplementary Tables 3–49 using log-transformed concentrations and adjusted for smoking, BMI, region, sample storage time and measurement date, as relevant.
Fig. 3
Fig. 3. Heatmap of differences in biomarker concentrations by sex and BMI group.
Biomarkers are clustered by change with BMI group. *Indicates significant change in biomarker concentrations between normal BMI group and either the overweight group (star to the left) or the obese group (star to the right) in females (F), males (M), or significant interaction between BMI group and sex (X) derived from the linear models in the Supplementary Tables 3–49. **Indicates a significant change in biomarker concentrations between the normal BMI group and the overweight group, and additionally between the normal group and the obese group. Linear regressions were performed using log-transformed concentrations and adjusted for sex, age, smoking, region, sample storage time, and measurement date.
Fig. 4
Fig. 4. Heatmap of differences in biomarker concentrations per sex and smoking status.
Biomarkers are clustered by change with smoking. *Indicate significant change with smoking in females (F), males (M) derived from the linear models in Supplementary Tables 3–49 where log-transformed concentrations were used, adjusted for age, BMI, region, sample storage time, and measurement date.
Fig. 5
Fig. 5. Radar charts of the median of the scaled concentration of biomarkers for the age groups 18–30 and 60–70 years.
Axis percentage spans from the first to the third quartile within each marker. a is proinflammatory group, b is T cell-derived group, c is chemokine group, and d is growth factors and vascular group. * marks confidence intervals not spanning 0 for the effect of a 10-year increase in age.
Fig. 6
Fig. 6. Radar charts of the median of the scaled concentration of biomarkers for BMI groups.
Axis percentage spans from the first to the third quartile within each biomarker. Normal BMI in blue, overweight BMI in magenta, obese BMI in red/orange. a is proinflammatory group, b is T cell-derived group, c is chemokine group, and d is growth factors and vascular group. * marks confidence intervals not spanning 0 for the difference between overweight and obese compared to normal, # marks the same for just one group.
Fig. 7
Fig. 7. Radar charts of the median of the scaled concentration of biomarkers for smokers vs non-smokers.
Axis percentage spans from the first to the third quartile within each biomarker. a is proinflammatory group, b is T cell-derived group, c is chemokine group, and d is growth factors and vascular group. * marks a statistically significant difference between smokers and non-smokers.

References

    1. Lee H, et al. Short- and long-term exposure to ambient air pollution and circulating biomarkers of inflammation in non-smokers: a hospital-based cohort study in South Korea. Environ. Int. 2018;119:264–273. doi: 10.1016/j.envint.2018.06.041. - DOI - PubMed
    1. Wang Y, et al. Genome-wide association study identifies 16 genomic regions associated with circulating cytokines at birth. PLoS Genet. 2020;16:e1009163. doi: 10.1371/journal.pgen.1009163. - DOI - PMC - PubMed
    1. Califf RM. Biomarker definitions and their applications. Exp. Biol. Med. 2018;243:213–221. doi: 10.1177/1535370217750088. - DOI - PMC - PubMed
    1. Lehallier B, et al. Undulating changes in human plasma proteome profiles across the lifespan. Nat. Med. 2019;25:1843–1850. doi: 10.1038/s41591-019-0673-2. - DOI - PMC - PubMed
    1. Williams SA, et al. Plasma protein patterns as comprehensive indicators of health. Nat. Med. 2019;25:1851–1857. doi: 10.1038/s41591-019-0665-2. - DOI - PMC - PubMed