. 2024 Mar 26;43(3):113897.
doi: 10.1016/j.celrep.2024.113897. Epub 2024 Mar 16.

Histone H3.1 is a chromatin-embedded redox sensor triggered by tumor cells developing adaptive phenotypic plasticity and multidrug resistance

Affiliations

Histone H3.1 is a chromatin-embedded redox sensor triggered by tumor cells developing adaptive phenotypic plasticity and multidrug resistance

Flavio R Palma et al. Cell Rep. .

Erratum in

Abstract

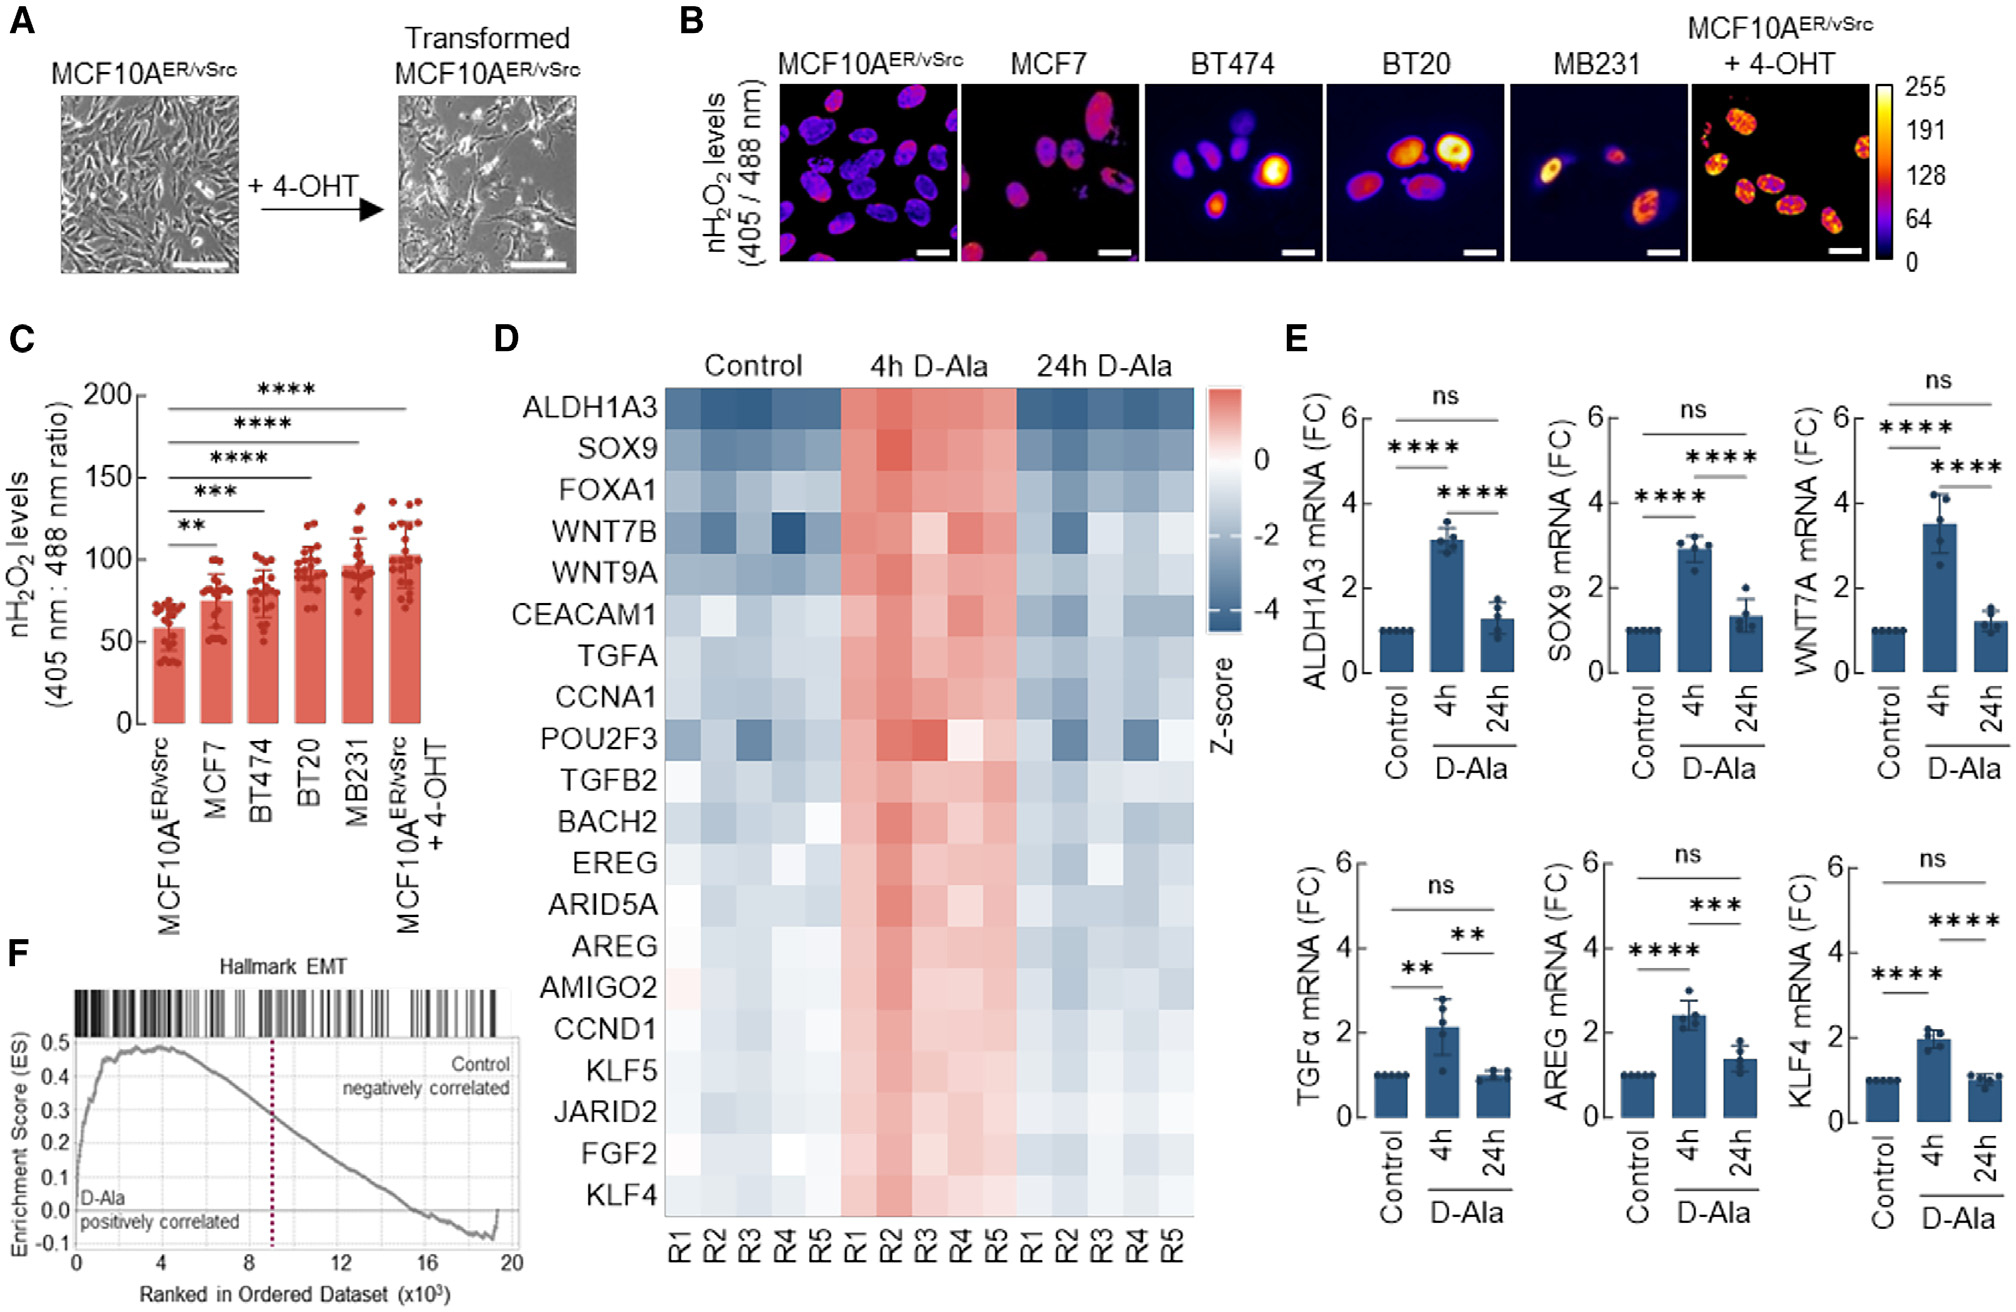
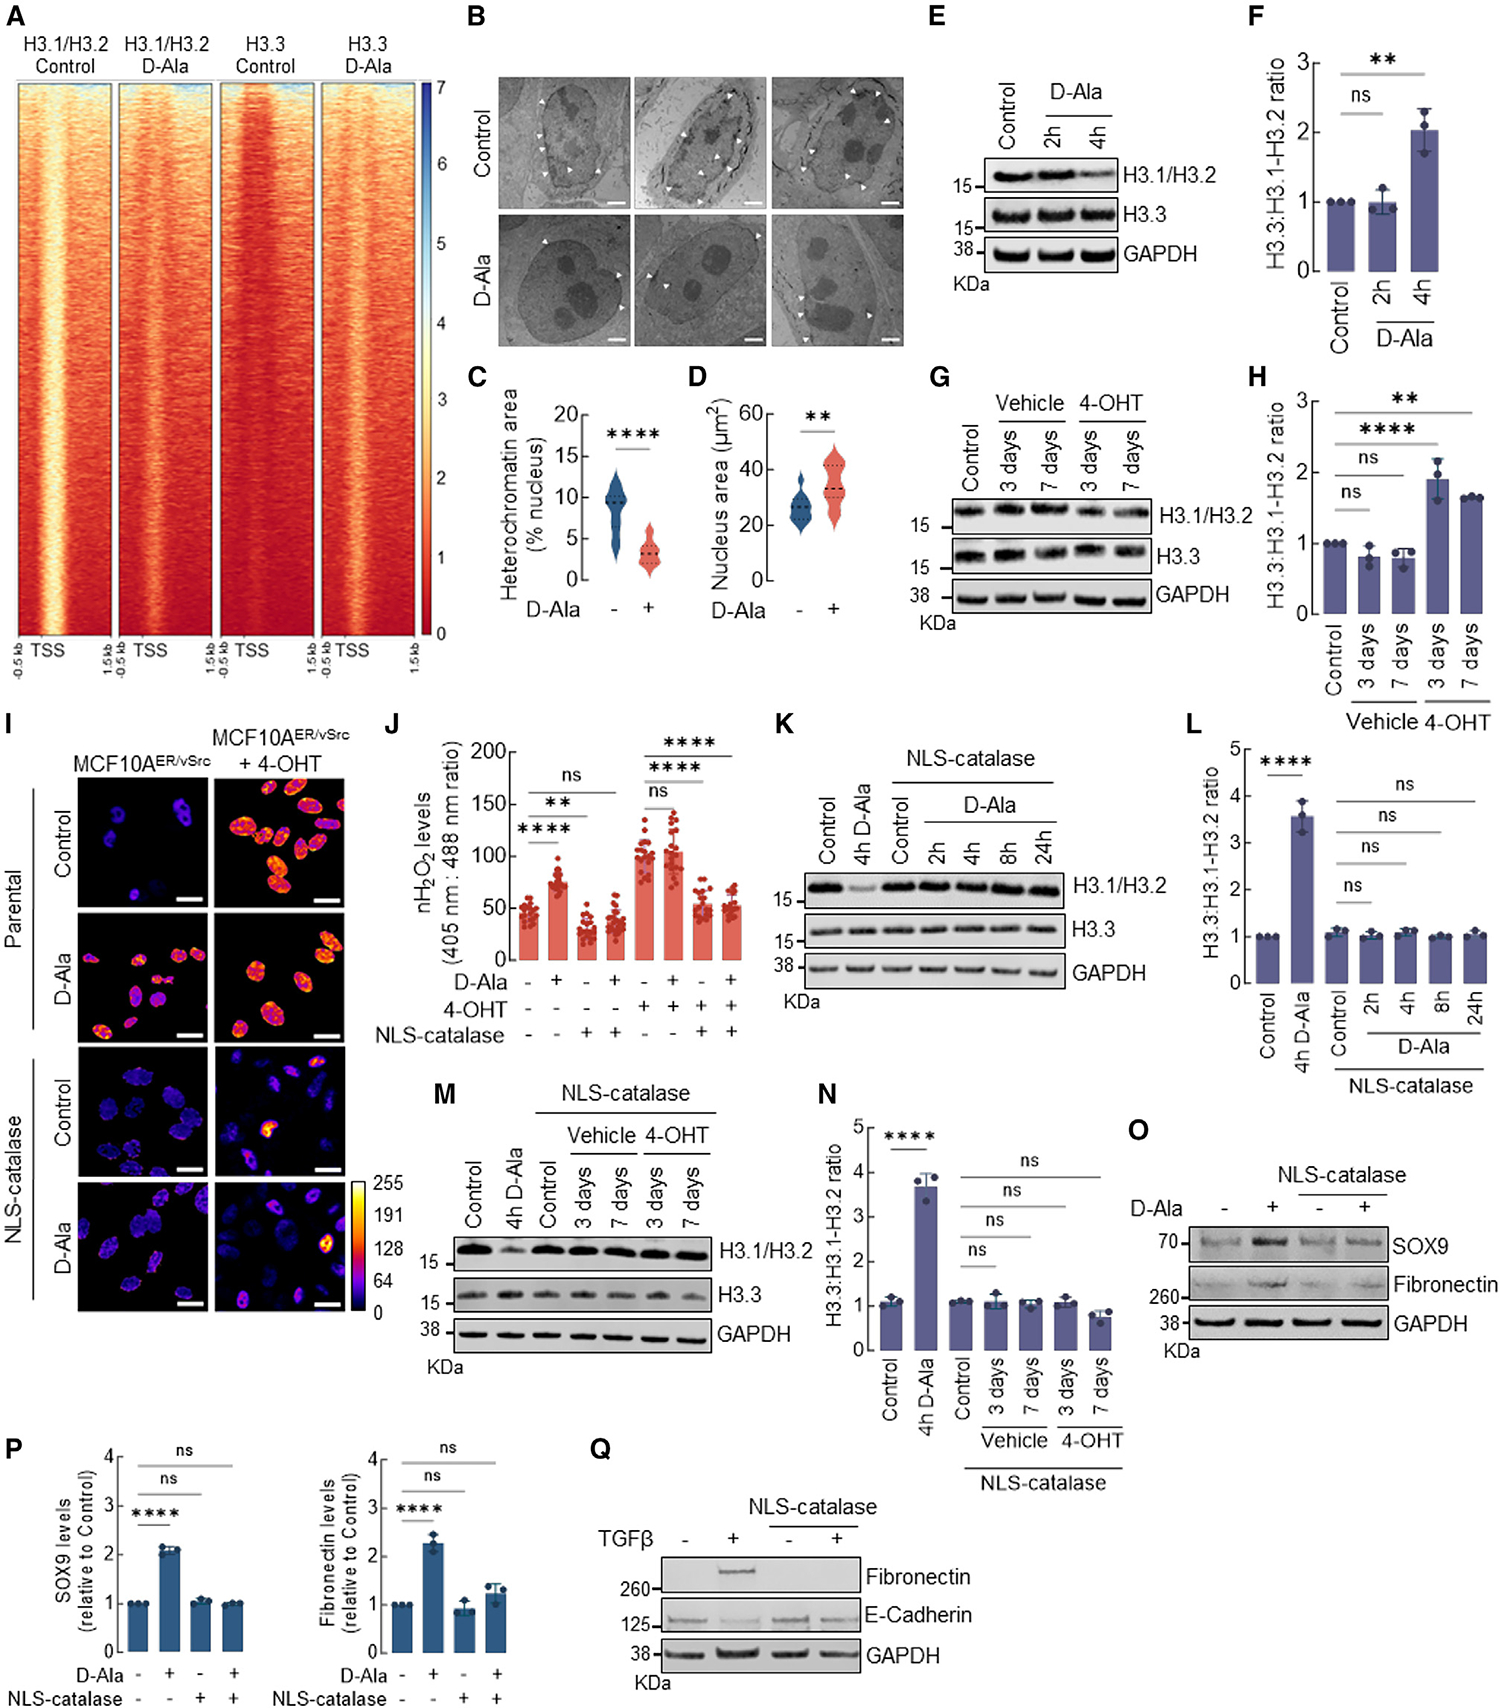
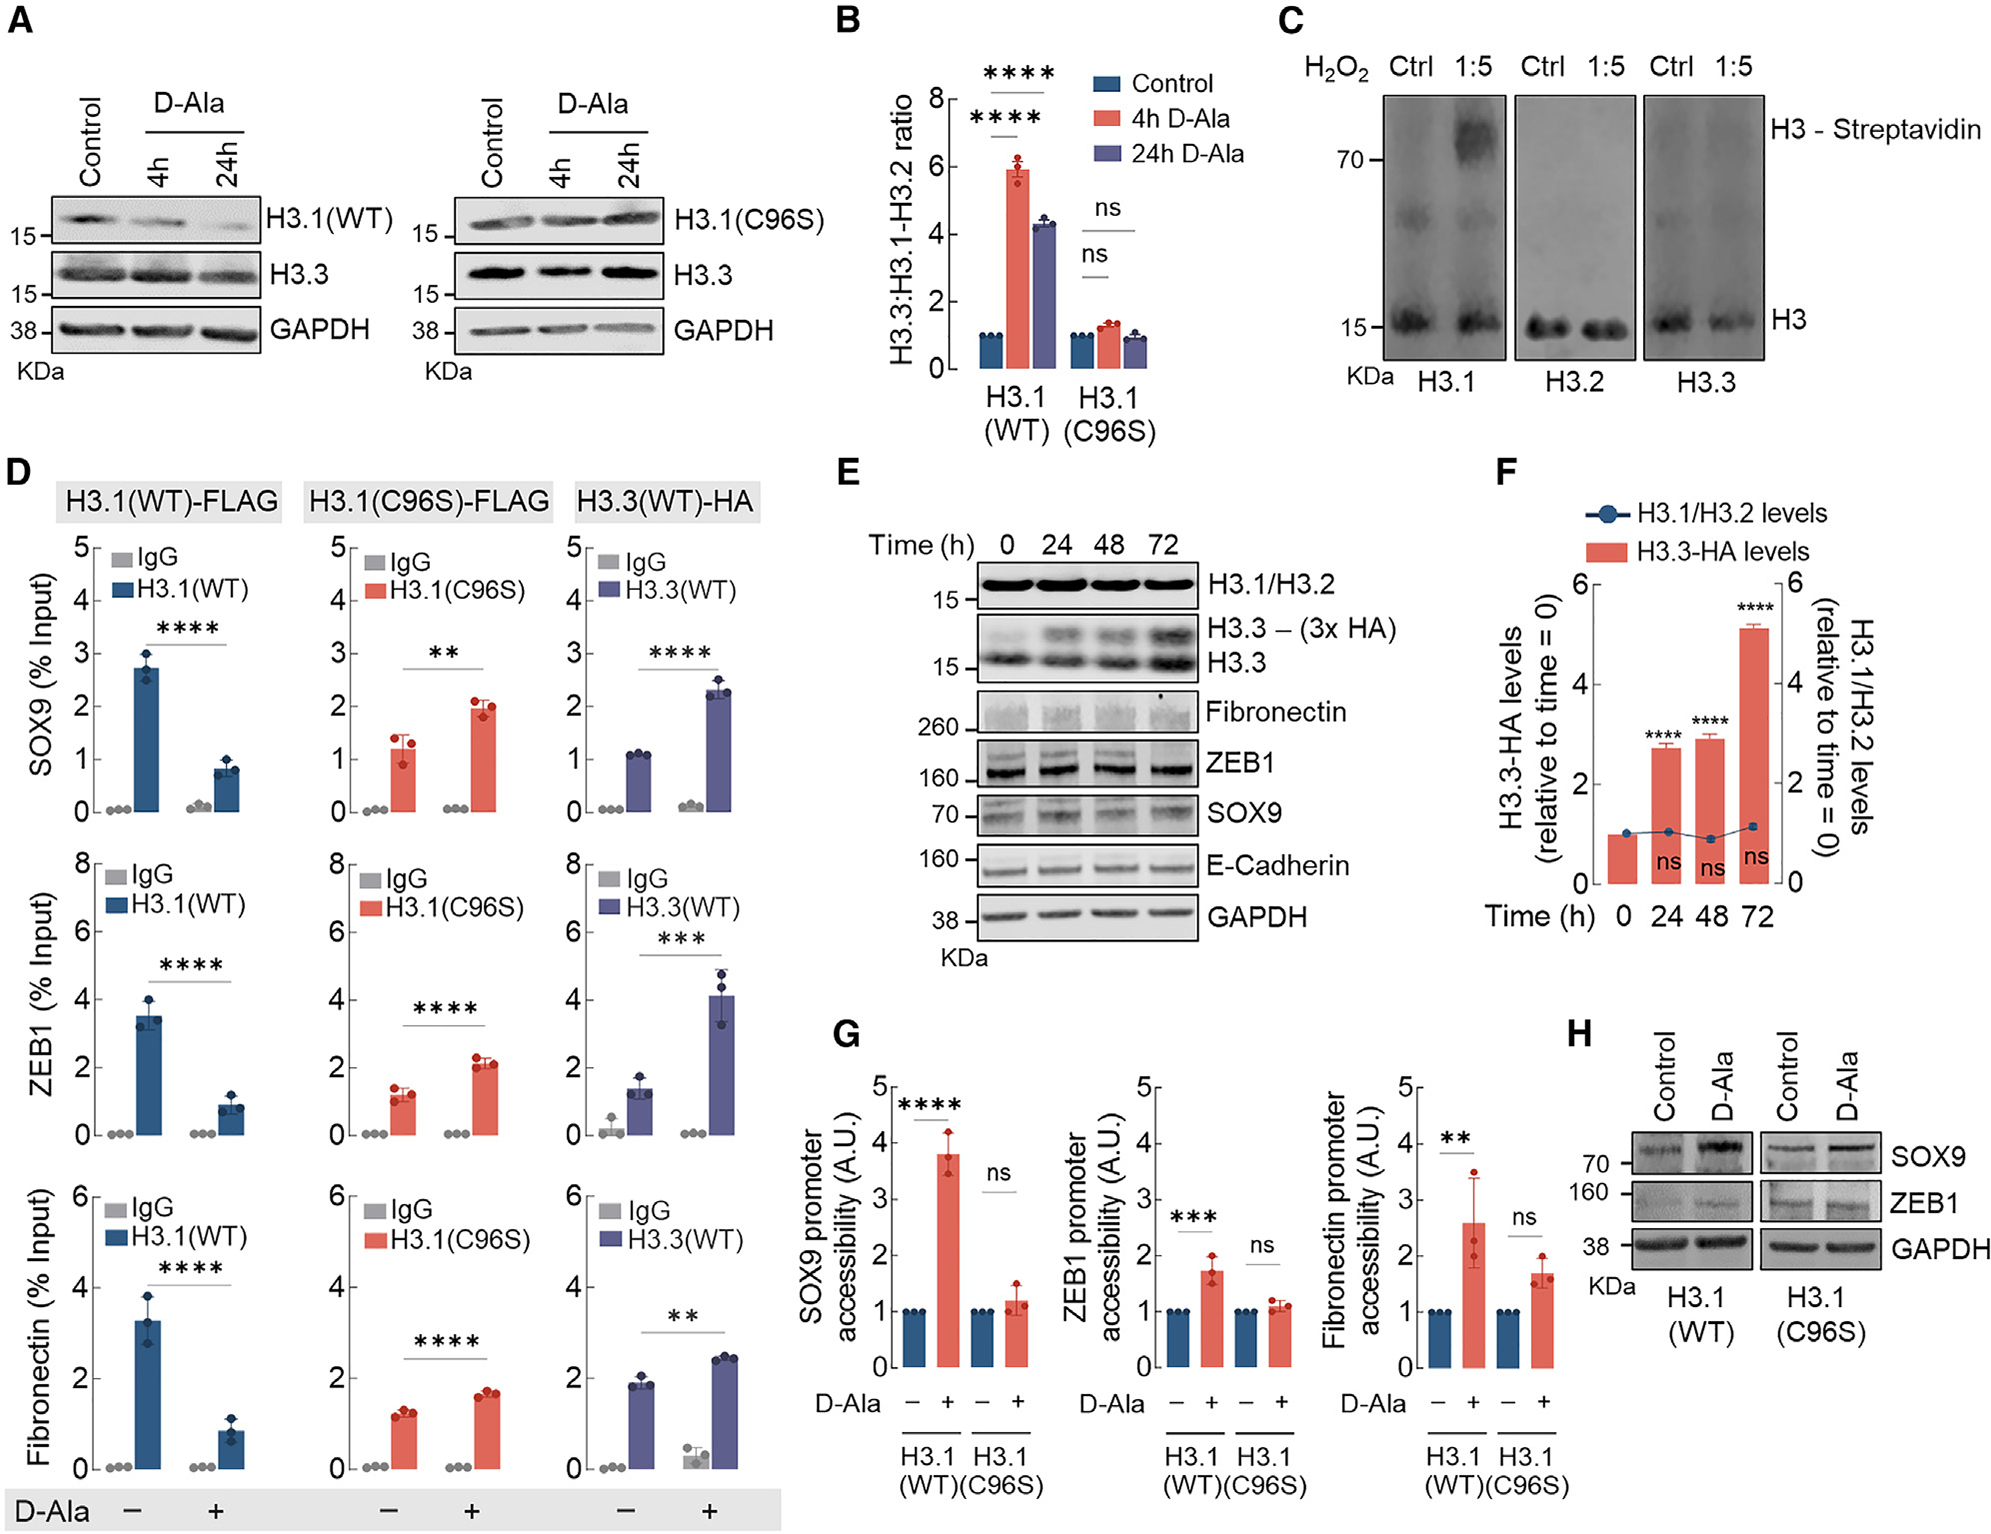
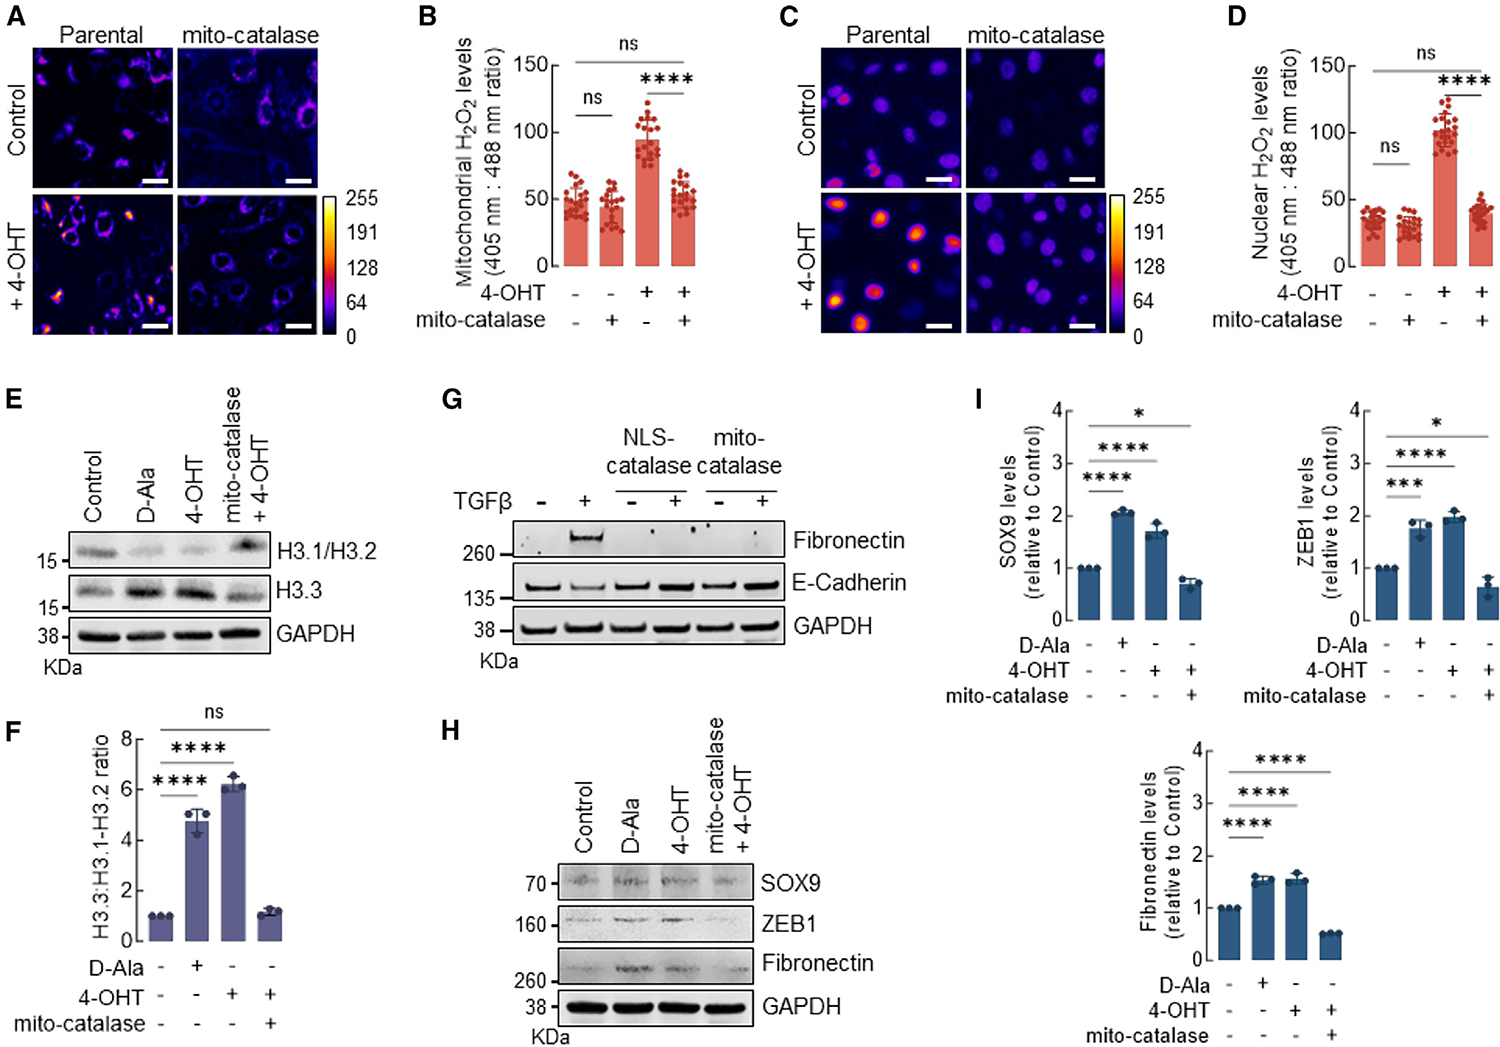
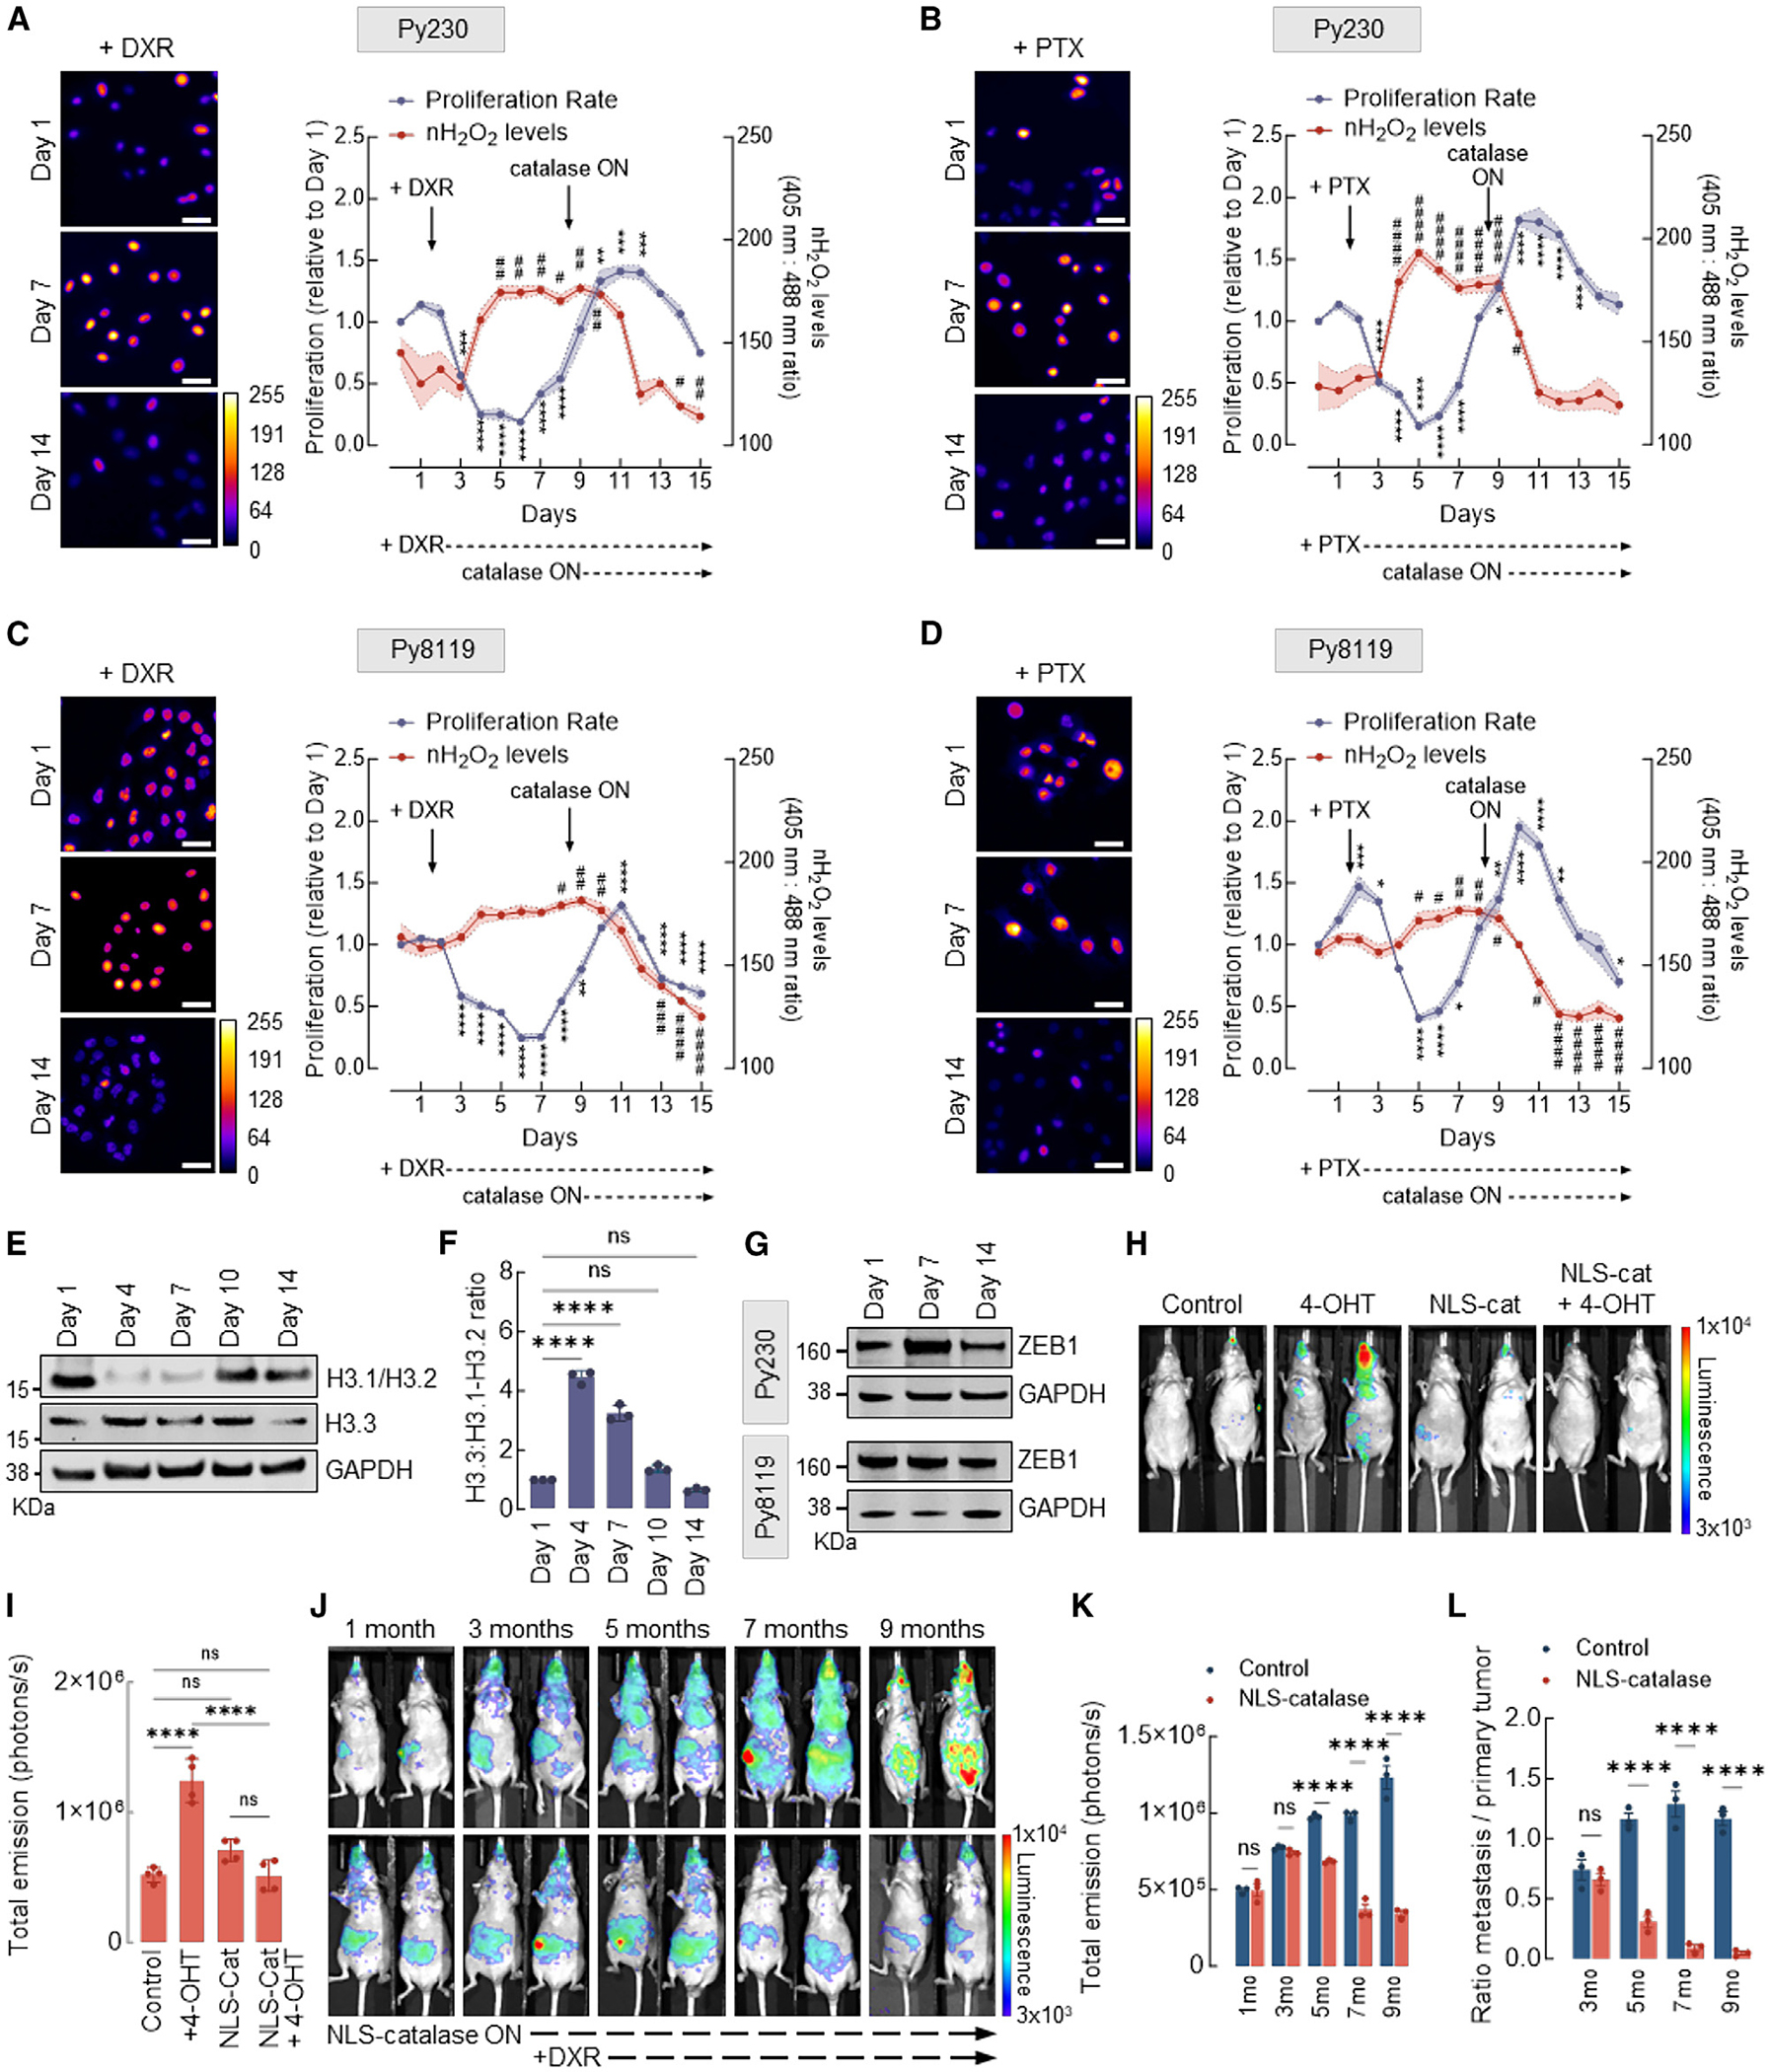
Chromatin structure is regulated through posttranslational modifications of histone variants that modulate transcription. Although highly homologous, histone variants display unique amino acid sequences associated with specific functions. Abnormal incorporation of histone variants contributes to cancer initiation, therapy resistance, and metastasis. This study reports that, among its biologic functions, histone H3.1 serves as a chromatin redox sensor that is engaged by mitochondrial H2O2. In breast cancer cells, the oxidation of H3.1Cys96 promotes its eviction and replacement by H3.3 in specific promoters. We also report that this process facilitates the opening of silenced chromatin domains and transcriptional activation of epithelial-to-mesenchymal genes associated with cell plasticity. Scavenging nuclear H2O2 or amino acid substitution of H3.1(C96S) suppresses plasticity, restores sensitivity to chemotherapy, and induces remission of metastatic lesions. Hence, it appears that increased levels of H2O2 produced by mitochondria of breast cancer cells directly promote redox-regulated H3.1-dependent chromatin remodeling involved in chemoresistance and metastasis.

Keywords: CP: Cancer; EMT; H3; ROS; breast cancer; chemoresistance; drug resistance; histone variants; metastasis; redox; thiol oxidation.


Conflict of interest statement

Declaration of interests The authors declare no competing interests.

Figures

Figure 1.
Figure 1.. Steady-state levels of nuclear H2O2 (nH2O2) are higher in transformed breast cancer cells and promote plasticity gene expression
(A) Nontumorigenic epithelial MCF10AER/vSrc cells were transformed to a mesenchymal/tumorigenic phenotype via stimulation with 4-OHT. Scale bars, 200 μm. (B) Expression of nuclear-targeted Orp1-roGFP2 in different cell lines. The levels of H2O2 in the nucleus of normal epithelial (MCF10AER/vSrc) and cancer cell lines (MCF7, BT474, BT20, MB231, and transformed MCF10AER/vSrc) were determined using confocal microscopy. Oxidized (λex = 405 nm) and reduced (λex = 488 nm) roGFP2 signals were acquired, and oxidized/reduced ratios were calculated using ImageJ (shown as a heatmap). Scale bars, 20 μm. On the side scale, 0 (colder colors) represents low ROS levels, whereas warmer colors toward the 255 mark represent higher ROS levels. (C) Quantification of oxidized:reduced ratio of nuclear Orp1-roGFP2 in (B). Statistical significance was determined by 1-way ANOVA with post hoc Tukey test. Bars represent mean ± SEM. **p < 0.01; ***p < 0.001; ****p < 0.0001. (D) Heatmap of core-enriched genes 4 or 24 h after 10 nM d-Ala treatment. Z scores were calculated based on the expression of each gene. (E) qRT-PCR analysis of a subset of genes differentially expressed in (D). Statistical significance was determined by 1-way ANOVA with post hoc Tukey test. Bars represent mean ± SEM. **p < 0.01; ***p < 0.001; ****p < 0.0001; ns, not significant. (F) GSEA enrichment plot of Hallmark genes associated with EMT and upregulated in cells 4 h after 10 nM d-Ala treatment. See also Figures S1 and S2.
Figure 2.
Figure 2.. nH2O2 promotes H3.1/H3.2 and H3.3 remodeling associated with EMT activation
(A) Heatmap of H3.1/H3.2 and H3.3 ChIP-seq peaks across TSS (−0.5 kb, +1.5 kb) in MCF10AER/vSrc cells 4 h after 10 nM d-Ala treatment. On the side scale, 0 represents low occupancy, whereas higher numbers represent increased occupancy levels. (B) Representative images of heterochromatin distribution in cells 4 h after 10 nM d-Ala treatment. Heterochromatin was assessed by TEM. White arrows indicate heterochromatin. Scale bars, 2 μm. (C) Quantification of perinuclear heterochromatin in (B) using Trainable Weka Segmentation plug-in in Fiji ImageJ. Statistical significance was determined by t test. ****p < 0.0001. (D) Area of the nucleus of cells in (B). Statistical significance was determined by t test. **p < 0.01. (E) Western blot analysis of H3.1-H3.2 and H3.3 in MCF10AER/vSrc cells 2 or 4 h after 10 nM d-Ala treatment. (F) H3.3:H3.1-H3.2 ratio quantification of (E). Statistical significance was determined by 1-way ANOVA with post hoc Tukey test. Bars represent mean ± SEM. **p < 0.01; ns, not significant. (G) Western blot analysis of H3.1-H3.2 and H3.3 in MCF10AER/vSrc transformed cells (3 and 7 days after treatment with 4-OHT). (H) H3.3:H3.1-H3.2 ratio quantification of (G). Statistical significance was determined by 1-way ANOVA with post hoc Tukey test. Bars represent mean ± SEM. **p < 0.01; ****p < 0.0001; ns, not significant. (I) The levels of H2O2 in the nucleus of MCF10AER/vSrc cells expressing NLS-catalase and treated with 10 nM d-Ala or transformed with 4-OHT were determined using confocal microscopy. Oxidized (λex = 405 nm) and reduced (λex = 488 nm) roGFP2 signals were acquired, and the oxidized:reduced ratio was calculated using ImageJ (shown as a heatmap). White bars represent 20 μm. On the heatmap scale, 0 represents low ROS levels, whereas warmer colors toward the 255 mark represent relatively higher ROS levels. (J) Quantification of oxidized:reduced ratio of nuclear Orp1-roGFP2 in (I). Statistical significance was determined by 1-way ANOVA with post hoc Tukey test. Bars represent mean ± SEM. **p < 0.01; ****p < 0.0001; ns, not significant. (K) Western blot analysis of H3.1-H3.2 and H3.3 in MCF10AER/vSrc cells expressing NLS-catalase. Indicated times represent points when cells were harvested relative to t = 0 h (10 nM d-Ala addition to the media). (L) H3.3:H3.1-H3.2 ratio quantification in (K). Statistical significance was determined by 1-way ANOVA with post hoc Tukey test. Bars represent mean ± SEM. ****p < 0.0001; ns, not significant. (M) Western blot analysis of H3.1-H3.2 and H3.3 in MCF10AER/vSrc transformed cells (3 and 7 days after treatment with 4-OHT) expressing NLS-catalase. (N) H3.3:H3.1-H3.2 ratio quantification in (M). Statistical significance was determined by 1-way ANOVA with post hoc Tukey test. Bars represent mean ± SEM. ****p < 0.0001; ns, not significant. (O) Western blot analysis of SOX9 and fibronectin (EMT markers) in MCF10AER/vSrc cells expressing NLS-catalase 8 h after 10 nM d-Ala treatment. (P) Quantification of SOX9 and fibronectin protein levels in (O). Statistical significance was determined by 1-way ANOVA with post hoc Tukey test. Bars represent mean ± SEM. ****p < 0.0001; ns, not significant. (Q) EMT induction in MCF10A cells treated with TGF-β. Parental and NLS-catalase-expressing cells were treated with 10 ng/mL TGF-β for 14 days. The levels of the mesenchymal marker fibronectin and the epithelial marker E-cadherin were determined by western blot.
Figure 3.
Figure 3.. H3.1 histone is distinctively sensitive and is evicted from chromatin by nH2O2
(A) Western blot analysis of H3.1 (WT and C96S) and H3.3 (endogenous) in MCF10AER/vSrc cells 4 and 24 h after 10 nM d-Ala treatment. (B) H3.3/H3.1-H3.2 ratio quantification of (A). Statistical significance was determined by 2-way ANOVA with post hoc Bonferroni test. Bars represent mean ± SEM. ****p < 0.0001; ns, not significant. (C) H3 variants labeling with DCP-Bio1. Recombinant H3.1, H3.2, and H3.3 were treated with H2O2 and incubated with biotin-conjugated DCP-Bio1, a dimedone derivative that labels oxidized Cys-SOH sulfenic acid residues. Biotin-conjugated DCP-Bio1 adducts were determined by western blot after incubation with Alexa Fluor-labeled streptavidin. (D) H3.1(WT)-FLAG, H3.1(C96S)-FLAG, and H3.3-HA enrichment (ChIP-qPCR) in promoter regions of SOX9, ZEB1, and fibronectin in MCF10AER/vSrc cells 8 h after 10 nM d-Ala treatment. Statistical significance was determined by 2-way ANOVA with post hoc Bonferroni test. Bars represent mean ± SEM. **p < 0.01; ***p < 0.001; ****p < 0.0001. (E) H3.3 expression does not affect the expression of H3.1-H3.2 or EMT genes. Overexpressing inducible H3.3-HA did not interfere with levels of endogenous H3.1-H3.2 or mesenchymal markers (fibronectin, ZEB1, and SOX9) and epithelial marker (E-cadherin). (F) H3.1-H3.2 levels in response to H3.3-HA overexpression in (E). Statistical significance was determined by 1-way ANOVA with post hoc Tukey test. Bars represent mean ± SEM. ****p < 0.0001; ns, not significant. (G) SOX9, ZEB1, and fibronectin gene accessibility in MCF10AER/vSrc cells expressing H3.1(WT) or H3.1(C96S) 4 h after 10 nM d-Ala treatment. Chromatin accessibility was determined in the promoter region of SOX9, ZEB1, and fibronectin. Statistical significance was determined by 1-way ANOVA with post hoc Tukey test. Bars represent mean ± SEM. **p < 0.01; ***p < 0.001; ****p < 0.0001; ns, not significant. (H) Western blot analysis of SOX9 and ZEB1 in MCF10AER/vSrc cells expressing H3.1(WT) or H3.1(C96S) 24 h after 10 nM d-Ala treatment. See also Figures S3 and S4.
Figure 4.
Figure 4.. Mitochondria-generated H2O2 promotes H3.1 depletion in the nucleus and activates EMT
(A) The levels of H2O2 in the mitochondria of MCF10AER/vSrc cells expressing mito-catalase and/or transformed with 4-OHT were determined using fluorescence microscopy. Oxidized (λex = 405 nm) and reduced (λex = 488 nm) roGFP2 signals were acquired, and the oxidized:reduced ratio was calculated using ImageJ (shown as a heatmap). White bars represent 20 μm. On the heatmap scale, 0 represents low ROS levels, whereas warmer colors toward the 255 mark represent relatively higher ROS levels. (B) Quantification of oxidized:reduced ratio of mitochondrial Orp1-roGFP2 in (A). Statistical significance was determined by 1-way ANOVA with post hoc Tukey test. Bars represent mean ± SEM. ****p < 0.0001; ns, not significant. (C) The levels of H2O2 in the nucleus of MCF10AER/vSrc cells expressing NLS-catalase and/or transformed with 4-OHT were determined using fluorescence microscopy. Oxidized (λex = 405 nm) and reduced (λex = 488 nm) roGFP2 signals were acquired, and the oxidized:reduced ratio was calculated using ImageJ (shown as a heatmap). White bars represent 20 μm. On the heatmap scale, 0 represents low ROS levels, whereas warmer colors toward the 255 mark represent relatively higher ROS levels. (D) Quantification of oxidized:reduced ratio of nuclear Orp1-roGFP2 in (C). Statistical significance was determined by 1-way ANOVA with post hoc Tukey test. Bars represent mean ± SEM. ****p < 0.0001; ns, not significant. (E) Western blot analysis of H3.1-H3.2 and H3.3 in MCF10AER/vSrc cells expressing mito-catalase and/or transformed with 4-OHT (7 days). Parental cells were harvested 4 h after 10 nM d-Ala treatment and were used as positive controls. (F) H3.3/H3.1-H3.2 ratio quantification in (E). Statistical significance was determined by 1-way ANOVA with post hoc Tukey test. Bars represent mean ± SEM. ****p < 0.0001; ns, not significant. (G) EMT induction of MCF10A cells with TGF-β. Cells expressing NLS-catalase or mito-catalase were treated with 10 ng/mL TGF-β for 14 days. The levels of fibronectin (mesenchymal marker) and E-cadherin (epithelial marker) were determined by western blot. (H) Western blot analysis of SOX9, ZEB1, and fibronectin in MCF10AER/vSrc cells expressing mito-catalase and/or transformed with 4-OHT (7 days). (I) Quantification of SOX9, ZEB1, and fibronectin protein levels in (H). Statistical significance was determined by 1-way ANOVA with post hoc Tukey test. Bars represent mean ± SEM. *p < 0.05; ***p < 0.001; ****p < 0.0001.
Figure 5.
Figure 5.. nH2O2 promotes chemoresistance, tumorigenicity, and metastasis of mammary xenograft tumors
(A) Cell proliferation and levels of H2O2 in the nucleus of murine mammary carcinoma Py230 cells expressing inducible NLS-catalase and treated with 200 nM DXR. Oxidized (λex = 405 nm) and reduced (λex = 488 nm) roGFP2 signals were acquired, and the ratio oxidized:reduced was calculated using ImageJ (shown as a heatmap). Cell proliferation is relative to day 1. White bars represent 50 μm. Statistical significance was determined by 1-way ANOVA with post hoc Tukey test (proliferation and nH2O2 calculated separately). Lines and shadows represent mean ± SEM. **p < 0.01, ***p < 0.001, and ****p < 0.0001 (for proliferation) and #p < 0.05 and ##p < 0.01 (for nH2O2 levels). On the heatmap scale, 0 represents low ROS levels, whereas warmer colors toward the 255 mark represent relatively higher ROS levels. (B) Cell proliferation and levels of H2O2 in the nucleus of Py230 cells expressing inducible NLS-catalase and treated with 10 nM PTX. Oxidized (λex = 405 nm) and reduced (λex = 488 nm) roGFP2 signals were acquired, and the ratio oxidized:reduced was calculated using ImageJ (shown as a heatmap). Cell proliferation is relative to day 1. White bars represent 50 μm. Statistical significance was determined by 1-way ANOVA with post hoc Tukey test (proliferation and nH2O2 calculated separately). Lines and shadows represent mean ± SEM. *p < 0.05, ***p < 0.001, and ****p < 0.0001 (for proliferation) and #p < 0.05 and ####p < 0.0001 (for nH2O2 levels). On the heatmap scale, 0 represents low ROS levels, whereas warmer colors toward the 255 mark represent relatively higher ROS levels. (C) Cell proliferation and levels of H2O2 in the nucleus of Py8119 cells expressing inducible NLS-catalase and treated with 200 nM DXR. Oxidized (λex = 405 nm) and reduced (λex = 488 nm) roGFP2 signals were acquired, and the ratio oxidized:reduced was calculated using ImageJ (shown as a heatmap). Cell proliferation is relative to day 1. White bars represent 50 μm. Statistical significance was determined by 1-way ANOVA with post hoc Tukey test (proliferation and nH2O2 calculated separately). Lines and shadows represent mean ± SEM. **p < 0.01 and ****p < 0.0001 (for proliferation) and #p < 0.05, ##p < 0.01, ###p < 0.001, and ####p < 0.0001 (for nH2O2 levels). On the heatmap scale, 0 represents low ROS levels, whereas warmer colors toward the 255 mark represent relatively higher ROS levels. (D) Cell proliferation and levels of H2O2 in the nucleus of Py8119 cells expressing inducible NLS-catalase and treated with 10 nM PTX. Oxidized (λex = 405 nm) and reduced (λex = 488 nm) roGFP2 signals were acquired, and the ratio oxidized:reduced was calculated using ImageJ (shown as a heatmap). Cell proliferation is relative to day 1. White bars represent 50 μm. Statistical significance was determined by 1-way ANOVA with post hoc Tukey test (proliferation and nH2O2 calculated separately). Lines and shadows represent mean ± SEM. *p < 0.05, **p < 0.01, and ****p < 0.0001 (for proliferation) and #p < 0.05, ##p < 0.01, and ####p < 0.0001 (for nH2O2 levels). On the heatmap scale, 0 represents low ROS levels, whereas warmer colors toward the 255 mark represent relatively higher ROS levels. (E) Western blot analysis of H3.1/H3.2 and H3.3 in Py230 cells treated with 200 nM DXR at the indicated time points. (F) H3.3:H3.1-H3.2 ratio quantification in (E). Statistical significance was determined by 1-way ANOVA with post hoc Tukey test. Bars represent mean ± SEM. ****p < 0.0001; ns, not significant. (G) Western blot analysis of ZEB1 in Py230 cells (top) and Py8119 cells (bottom) treated with 200 nM DXR at the indicated different time points. (H) Assessment of tumors in NU/J mice injected with 4-OHT-transformed MCF10AER/vSRC cells and expressing NLS-catalase. The injection of MCF10AER/vSrc cells (±4-OHT, ±NLS-catalase expression) was performed subcutaneously in the mammary fat pad, and the bioluminescent signal of tumors in representative animals is shown (13 weeks after injection). Luciferase signal was detected using high exposure for 120 s. (I) Quantification of total emission in (H). Statistical significance was determined by 1-way ANOVA with post hoc Tukey test. Bars represent mean ± SEM. ****p < 0.0001; ns, not significant. (J) Assessment of tumors in NU/J mice injected with 4-OHT-transformed MCF10AER/vSRC cells and expressing inducible NLS-catalase. The injection of 4-OHT-transformed MCF10AER/vSrc cells was performed subcutaneously in the mammary fat pad, and tumor growth and metastasis were measured monthly. The induction of NLS- catalase occurred after the third month, and the treatment with DXR was performed on a weekly basis after the fifth month. Luciferase signal was detected using high exposure for 120 s. (K) Quantification of total emission in (J). Statistical significance was determined by 2-way ANOVA with post hoc Bonferroni test. Bars represent mean ± SEM. ****p < 0.0001; ns, not significant. (L) Ratio metastasis:primary tumor of (J). Statistical significance was determined by 2-way ANOVA with post hoc Bonferroni test. Bars represent mean ± SEM. ****p < 0.0001; ns, not significant. See also Figure S5.

References

    1. Morris SA (2019). The evolving concept of cell identity in the single cell era. Development 146. 10.1242/dev.169748. - DOI - PubMed
    1. Bussotti G, Piel L, Pescher P, Domagalska MA, Rajan KS, Cohen-Chalamish S, Doniger T, Hiregange DG, Myler PJ, Unger R, et al. (2021). Genome instability drives epistatic adaptation in the human pathogen Leishmania. Proc. Natl. Acad. Sci. USA 118, e2113744118. 10.1073/pnas.2113744118. - DOI - PMC - PubMed
    1. Jain SU, Khazaei S, Marchione DM, Lundgren SM, Wang X, Weinberg DN, Deshmukh S, Juretic N, Lu C, Allis CD, et al. (2020). Histone H3.3 G34 mutations promote aberrant PRC2 activity and drive tumor progression. Proc. Natl. Acad. Sci. USA 117, 27354–27364. 10.1073/pnas.2006076117. - DOI - PMC - PubMed
    1. Zhao Y, and Garcia BA (2015). Comprehensive Catalog of Currently Documented Histone Modifications. Cold Spring Harbor Perspect. Biol. 7, a025064. 10.1101/cshperspect.a025064. - DOI - PMC - PubMed
    1. Gomes AP, Ilter D, Low V, Rosenzweig A, Shen ZJ, Schild T, Rivas MA, Er EE, McNally DR, Mutvei AP, et al. (2019). Dynamic Incorporation of Histone H3 Variants into Chromatin Is Essential for Acquisition of Aggressive Traits and Metastatic Colonization. Cancer Cell 36, 402–417.e13. 10.1016/j.ccell.2019.08.006. - DOI - PMC - PubMed

Publication types