. 2024 Apr:368:728-739.
doi: 10.1016/j.jconrel.2024.03.019. Epub 2024 Mar 19.

A quantitative MRI-based approach to estimate the permeation and retention of nanomedicines in tumors

Affiliations

A quantitative MRI-based approach to estimate the permeation and retention of nanomedicines in tumors

Alireza Nomani et al. J Control Release. 2024 Apr.

Abstract

Despite the potential of the enhanced permeability and retention (EPR) effect in tumor passive targeting, many nanotherapeutics have failed to produce meaningful clinical outcomes due to the variable and challenging nature of the tumor microenvironment (TME) and EPR effect. This EPR variability across tumors and inconsistent translation of nanomedicines from preclinical to clinical settings necessitates a reliable method to assess its presence in individual tumors. This study aimed to develop a reliable and non-invasive approach to estimate the EPR effect in tumors using a clinically compatible quantitative magnetic resonance imaging (qMRI) technique combined with a nano-sized MRI contrast agent. A quantitative MR imaging was developed using a dynamic contrast-enhanced (DCE) MRI protocol. Then, the permeability and retention of the nano-sized MRI contrast agent were evaluated in three different ovarian xenograft tumor models. Results showed significant differences in EPR effects among the tumor models, with tumor growth influencing the calculated parameters of permeability (Ktrans) and retention (Ve) based on Tofts pharmacokinetic (PK) modeling. Our data indicate that the developed quantitative DCE-MRI method, combined with the Tofts PK modeling, provides a robust and non-invasive approach to screen tumors for their responsiveness to nanotherapeutics. These results imply that the developed qMRI method can be beneficial for personalized cancer treatments by ensuring that nanotherapeutics are administered only to patients with tumors showing sufficient EPR levels.

Keywords: Enhanced permeability and retention effect (EPR); MRI; Magnetic resonance imaging; Nanomedicine; Nanoparticle permeation; Tofts; Tumor vasculature leakiness.


Conflict of interest statement

Declaration of competing interest The authors declare that they have no known competing financial interests or personal relationships that could have appeared to influence the work reported in this paper.

Figures
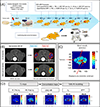
Figure 1.
Figure 1.
(A) Schematic representation of both semi-quantitative and quantitative DCE-MRI protocols used for assessing tumor permeability in response to the macromolecular contrast agent. (B) Axial GRE high-resolution scans of SKOV-3 xenograft tumors located on mouse flanks. Images display tumors pre-segmentation (left) and post-segmentation of the rim-core (right) both prior to and following contrast agent injection. Phantom-normalized pre-injection images are subtracted from their corresponding 30-minute post-contrast agent injection slices to identify the GadoSpin-positive regions. The unenhanced areas of the rim and core are highlighted in red and blue, respectively, in the upper right image. Meanwhile, the enhanced areas of the rim and core (30-minute post-injection) are indicated in yellow and cyan, respectively, in the bottom right image. (C) Exemplary calculated R1 map from an axial scan of SKOV-3 xenograft tumors on mouse flanks. A VFA mGRE SP pulse sequence was used for quantitative DCE-MRI analysis. Images were imported and the R1-map was constructed to identify tumor and blood longitudinal relaxivities. (D) Quantitative DCE-MR image processing with PK modeling and analysis. Abbreviations: W: week, D: day, DCE-MRI: dynamic contrast-enhanced magnetic resonance imaging, FSE: fast spin echo, GRE: gradient echo with external average, mGRE-SP: multiple spoiled gradient echo, CA: Gd contrast agent, Pre/post-inj.: pre/post-contrast agent injection, VFA: varied flip angle, R1: relaxivity heat map of the contrast agent measured at the T1 MRI sequence.
Figure 2.
Figure 2.
Semi-quantitative DCE-MRI assessment of tumor permeability and retention. The Gd-enhanced volumes of the tumor rim and core are plotted against the total tumor sizes. The 30-minute post-Gd injection data from the segmented tumor rim area (A) are indicative of tumor permeability, while the120-minute post-Gd injection data from the segmented tumor core area (B) served as a rough indicator of tumor retention. Each panel shows the pooled mean values from four distinct tumors in each tumor model. Each square (data point) corresponds to an individual tumor at a specific tumor size. The vertical red dashed line denotes the approximate tumor size at which a significant increase in the Gd-positive area was observed.
Figure 3.
Figure 3.
Representative parametric R1 maps of both pre- and post-Gd contrast agent injection, along with the Gd concentration maps for three distinct ovarian xenograft tumors at various time points post-Gd injection within a day. The tumor locations are delineated by the dashed lines and highlighted with yellow arrowheads.
Figure 4.
Figure 4.
Part (A) shows the percent injected dose of GadoSpinP per gram tumor (% ID/g) at the tumor site at Cmax. Part (B) summarizes the mixed-effect linear regression analysis of the % ID/g tumor data. The table provides the slope of the best-fit-line and its associated significance (p-value). For the detailed results, refer to the Supplementary Information file.
Figure 5.
Figure 5.
(A) Depicts the tumor core GadoSpin P (Gd) concentration at 120-minute post-injection throughout the growth duration of each tumor. The mixed-effects linear regression, processed via IBM SPSS software, was used to calculate the slope, standard error of slope, 95% confidence intervals, and p-value for the regression line of Gd concentration versus tumor size for each model. (B) Below the graph, a summary table displays the mixed-effects linear regression data. This table outlines the slope of the best-fit-line and its associated significances (p-value). For a comprehensive analysis results, see the Supplementary Information file.
Figure 6.
Figure 6.
(A) Displays the Ktrans values plotted against the cubic root of the tumor size for three ovarian xenograft mouse models over the growth duration of each tumor. The mixed-effects linear regression was used to calculate the slope, standard error of slope, 95% confidence interval, and p-values of Ktrans versus tumor size regression line for each model. (B) underneath the graph, a summary table presents the statistical data derived from the mixed-effects linear regression. This table details the slope of the best-fit-line and its associated significances (p-value). For a detailed breakdown of these results, see the Supplementary Information file.
Figure 7.
Figure 7.
(A) Displays the Ve values plotted against the cubic root of the tumor size for three ovarian xenograft mouse models throughout each tumor’s growth period. The mixed-effects linear regression was used to determine the slope, standard error of the slope, 95% confidence interval, and p-value for the regression line of Ve in relation to tumor size for each model. (B) A summary table presents the calculated statistical data from the mixed-effects linear regression. This table outlines the slope of the best-fit-line and its associated significances (p-value). For the detailed analysis results, see the Supplementary Information file.
Figure 8.
Figure 8.
(A) The graphs illustrate the correlation between Ve and Ktrans for three ovarian mouse xenograft models throughout the growth duration of each tumor. Using the mixed-effects linear regression, we calculated the slope, standard error of slope, 95 % confidence interval, and p-value of Ve vs. Ktrans regression line for each tumor model. (B) A summary table showing the statistical results of the mixed-effects linear regression. This table highlights the slope of the best-fit-line and the related significances (p-value). For the detailed analysis results, see the Supplementary Information file.

References

    1. Iwai K, Maeda H, Konno T, Use of oily contrast medium for selective drug targeting to tumor: enhanced therapeutic effect and X-ray image, Cancer Research, 44 (1984) 2115–2121. - PubMed
    1. Lammers T, Kiessling F, Hennink WE, Storm G, Drug targeting to tumors: principles, pitfalls and (pre-) clinical progress, J Control Release, 161 (2012) 175–187. - PubMed
    1. Wolfram J, Ferrari M, Clinical cancer nanomedicine, Nano Today, 25 (2019) 85–98. - PMC - PubMed
    1. D’Mello SR, Cruz CN, Chen ML, Kapoor M, Lee SL, Tyner KM, The evolving landscape of drug products containing nanomaterials in the United States, Nat Nanotechnol, 12 (2017) 523–529. - PubMed
    1. Wagh A, Song H, Zeng M, Tao L, Das TK, Challenges and new frontiers in analytical characterization of antibody-drug conjugates, mAbs, 10 (2018) 222–243. - PMC - PubMed

Publication types

LinkOut - more resources