. 2024 Aug;17(4):537-553.
doi: 10.1016/j.mucimm.2024.03.006. Epub 2024 Mar 15.

TL1A priming induces a multi-cytokine Th9 cell phenotype that promotes robust allergic inflammation in murine models of asthma

Affiliations

TL1A priming induces a multi-cytokine Th9 cell phenotype that promotes robust allergic inflammation in murine models of asthma

Michelle L Niese et al. Mucosal Immunol. 2024 Aug.

Abstract

Multi-cytokine-producing Th9 cells secrete IL-9 and type 2 cytokines and mediate mouse and human allergic inflammation. However, the cytokines that promote a multi-cytokine secreting phenotype have not been defined. Tumor necrosis factor superfamily member TL1A signals through its receptor DR3 to increase IL-9. Here we demonstrate that TL1A increases expression of IL-9 and IL-13 co-expressing cells in murine Th9 cell cultures, inducing a multi-cytokine phenotype. Mechanistically, this is linked to histone modifications allowing for increased accessibility at the Il9 and Il13 loci. We further show that TL1A alters the transcription factor network underlying expression of IL-9 and IL-13 in Th9 cells and increases binding of transcription factors to Il9 and Il13 loci. TL1A-priming enhances the pathogenicity of Th9 cells in murine models of allergic airway disease through the increased expression of IL-9 and IL-13. Lastly, in both chronic and memory-recall models of allergic airway disease, blockade of TL1A signaling decreases the multi-cytokine Th9 cell population and attenuates the allergic phenotype. Taken together, these data demonstrate that TL1A promotes the development of multi-cytokine Th9 cells that drive allergic airway diseases and that targeting pathogenic T helper cell-promoting cytokines could be an effective approach for modifying disease.


Conflict of interest statement

DECLARATIONS OF COMPETING INTEREST

The authors have no competing interests to declare.

Figures

Fig. 1
Fig. 1
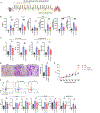
TL1A increases IL-9 and IL-13 in human and mouse Th9 cells. Splenic naive CD4+ T cells from C57BL/6 mice were cultured for 5 days in Th9 cell polarizing media with TL1A (red) or a vehicle Ctrl (black). (A) Cells were collected for quantitative RT-PCR on days 0–5 and at hours 2–24 post-restimulation with PMA and Ionomycin. (B) Cells were collected on day 5 for flow cytometric analysis of cytokine production and were gated on live, CD4+ T cells. Representative flow plots (left) and quantification (right) are shown. (C) Splenic naïve CD4+ T cells were cultured in Th9 (vehicle – black, TL1A – red) or Th2 polarizing conditions (vehicle – black, TL1A – blue) with TL1A or a vehicle Ctrl for 5 days and analyzed with flow cytometry. Representative flow plots (top) and quantification (bottom) are shown. (D) Splenic naive CD4+ T cells were cultured in Th9 (vehicle – black, TL1A – red) or Th17 polarizing conditions (vehicle – gray, TL1A – blue) with TL1A or a vehicle Ctrl for 5 days and analyzed with flow cytometry. Representative flow plots (top) and quantification (bottom) are shown. (E) Naive CD4+ T cells were isolated from human buffy coat samples and cultured in Th9 polarizing conditions with TL1A or a vehicle Ctrl for 7 days and analyzed via flow cytometry. Cells were gated on live, CD4+ T cells. Representative flow plots (top) and quantification (bottom) are shown. (F) Schematic showing Il9 and Il13 loci regions for analysis (top). Th9 cell cultures treated with TL1A or a vehicle were processed for ChIP using antibodies against histone modifications indicative of euchromatin or heterochromatin (bottom). Student’s t test was used for comparison of two groups. One-way analysis of variance with Tukey’s post-hoc test was used for comparison of three or more groups. Data from A–C, and E are the average of four mice per condition, data from D are the average of 11 buffy coat donors and are representative of two to three experiments. Two-way analysis of variance was used for comparison of time-course studies with two groups and multiple time points. * p < 0.05, ** p < 0.01, *** p < 0.001, **** p < 0.0001. CD = cluster of differentiation; ChIP = chromatin immunoprecipitation; Ctrl = control; gMFI = geometric mean fluorescence intensity; IL = interleukin; PMA = Phorbol Myristate Acetate; RT-PCR = reverse transcriptase-polymerase chain reaction; Th = T helper.
Fig. 2
Fig. 2
TL1A increases IL-9 associated transcription factor expression in Th9 cells. (A) scRNA sequencing data of clustered Th9, Th2, Th9rm cells. Each bar is representative of one cell. The magnitude of each colored bar indicates the counts associated with that cytokine (Il9 – blue, Il5 – orange, Il13 – gray) in the given cell. (B) Transcript abundance from scRNAseq dataset of transcription factors Pparg, Batf, and Irf4 in Th9 (black), Th9rm (red), and Th2 (blue) subsets. (C) Expression of PPARγ, BATF, and IRF4 in cultured TL1A-primed Th9 cells (red), conventionally primed Th9 cells (black), and Th2 cells (blue) assessed by flow cytometry. Quantification (top) and representative histograms (bottom). Data are the average of three mice per condition and representative of two experiments. Wilcoxon Rank Sum test was used for statistical comparison of scRNAseq data. One-way analysis of variance with Tukey’s post-hoc test was used for comparison of three or more groups. * p < 0.05, ** p < 0.01. Ctrl = control; IL = interleukin; n.s. = not significant; scRNAseq = single cell ribonucleic acid sequencing; Th = T helper; Th9rm = resident memory Th9.
Fig. 3
Fig. 3
TL1A increases binding of transcription factors to the Il9 and Il13 loci. Splenic naive CD4+ T cells were cultured for 5 days in Th9 cell polarizing media with TL1A (red) or vehicle control (black) and subsequently processed for ChIP. (A) Schematic of Il9 and Il13 loci regions of interest. (B–F) ChIP of PPARγ (B), BATF (C), IRF4 (D), NF-kB p52 (E), and STAT5A (F) binding at the Il9 and Il13 loci. Data are the average of four mice per condition and representative of three experiments. One-way analysis of variance with Tukey’s post-hoc test was used for comparison of three or more groups. * p < 0.05, ** p < 0.01, *** p < 0.001. CD = cluster of differentiation; ChIP = chromatin immunoprecipitation; Ctrl = control; IgG, immunoglobulin G; LCR = locus control region.
Fig. 4
Fig. 4
TL1A-primed Th9 cells induce greater allergic disease than conventionally primed Th9 cells. (A) Schematic of experimental design. Splenic naive CD4+ T cells were isolated from OTII mice and cultured in Th9 or Th2 polarizing media with TL1A or a vehicle control. Cells were adoptively transferred into Boy/J recipients. Recipient mice were dosed with intranasal OVA for five Ds. Mice were euthanized for downstream analysis 24 hours after fifth OVA dose. Diagram was created with BioRender.com. (B) Airway hyperreactivity testing in response to increasing doses of methacholine. Dose-response curve (left) and response at 100 mg/mL (right). (C) Immune cell expansion and infiltration in the lung and airway as measured by flow cytometry. (D) Lung total B cell (CD45+B220+) and plasma cell (CD45+B220− CD138+) frequency and number measured by flow cytometry. (E) Eosinophil (CD45+SiglecF+CD11c−) frequency and number in the lung and airway as measured by flow cytometry. Data are the average of five mice per condition and representative of two experiments. One-way analysis of variance with Tukey’s post-hoc test was used for comparison of three or more groups. Two-way analysis of variance was used for comparison of time-course studies with two groups and multiple time points. * p < 0.05, ** p < 0.01, *** p < 0.001. # = number; BAL = bronchoalveolar lavage; CD = cluster of differentiation; D = day; OTII = B6.Cg-Tg(TcraTcrb)425Cbn/J; OVA = ovalbumin; PBS = phosphate buffer saline; RI = airway resistance; Th = T helper.
Fig. 5
Fig. 5
Blockade of IL-9 or IL-13 signaling attenuates allergic disease induced by TL1A-primed Th9 cells. (A) Schematic of experimental design. Splenic naive CD4+ T cells were isolated from OTII mice and cultured in Th9 or Th2 polarizing media with TL1A or a vehicle control. Cells were adoptively transferred into Boy/J recipients. Recipient mice were dosed with intranasal OVA for 5 days. Mice also received anti-IL-9 or anti-IL-13 on days 2 and 4 concurrently with OVA. Mice were euthanized for downstream analysis 24 hours after the fifth OVA dose. Fig. was generated with BioRender.com. (B) Airway hyperreactivity testing in response to increasing doses of methacholine. Dose-response curve (left) and response at 100mg/mL (right). Color of significance asterisks corresponds to the anti-IL-9 (black) or anti-IL-13 (blue) treatment as compared to the isotype control. (C) Immune cell expansion and infiltration in the lung and airway as measured by flow cytometry. (D) Lung total B cell (CD45+B220+) and plasma cell (CD45+B220−CD138+) frequency and number measured by flow cytometry. (E) Eosinophil (CD45+SiglecF+CD11c−) frequency and number in the lung and airway as measured by flow cytometry. Data are the average of 3–6 mice per condition and representative of two experiments. One-way analysis of variance with Tukey’s post-hoc test was used for comparison of three or more groups. Two-way analysis of variance was used for comparison of time-course studies with two groups and multiple time points. * p < 0.05, ** p < 0.01, *** p < 0.001, **** p < 0.0001. # = number; BAL = bronchoalveolar lavage; CD = cluster of differentiation; D = day; IL = interleukin; ns = not significant; OTII = B6.Cg-Tg(TcraTcrb)425Cbn/J; OVA = ovalbumin; RI = airway resistance; Th = T helper.
Fig. 6
Fig. 6
Attenuating TL1A signaling decreases allergic disease in a chronic model of AAD. (A) Schematic of experimental design. WT mice were challenged with intranasal PBS (black) or A. fumigatus three times a week for 6 weeks. During the last two weeks, mice were also treated with either anti-TL1A (red) or an isotype control (blue). Figs. were created with BioRender.com. (B) Cellularity of airways and lung (left two), eosinophil (CD45+SiglecF+CD11c−) frequency and number in the airway (middle two), and eosinophil frequency and number in the lung (right two). (C) Lung total B cell (CD45+B220+) and plasma cell (CD45+B220−CD138+) frequency and number measured by flow cytometry. (D) Hematoxylin and eosin staining of lung sections (left) and quantified (right). (E) Representative flow plots of CD4+ lung T cells pre-gated on live, CD45+, CD4+ cells (top). Quantification of frequency, number, and staining intensity of IL-9+, IL-13+, and IL-9+IL-13+ cells (bottom). (F) Airway hyperreactivity testing in response to increasing doses of methacholine. Data are the average of 3–6 mice per condition and are the result of two combined experiments. One-way analysis of variance with Tukey’s post-hoc test was used for comparison of three or more groups. Two-way analysis of variance was used for comparison of time-course studies with two groups and multiple time points. * p < 0.05, ** p < 0.01, *** p < 0.001, **** p < 0.0001. # = number; A.f. = Aspergillus fumigatus; AAD = allergic airway disease; BAL = bronchoalveolar lavage; CD = cluster of differentiation; IL = interleukin; ns = not significant; PBS = phosphate buffer saline; WT = wildtype.
Fig. 7
Fig. 7
Attenuating TL1A signaling decreases allergic disease in a memory-recall model of AAD. (A) Schematic of experimental design. WT mice were challenged with intranasal PBS (black) or A.f. three times a wk for 6 wks. Mice were then rested without allergen exposure for 6 wks. Four days prior to euthanasia, mice were treated with anti-TL1A (red) or isotype control (blue) for 4 days. Mice were treated with intranasal A.f. at 48 hours and 8 hours before euthanasia for the recall response. Figs. were created with BioRender.com. (B) Cellularity of airways and lung (left two), eosinophil (CD45+SiglecF+CD11c−) frequency and number in airway (middle two), and eosinophil frequency and number in the lung (right two). (C) Lung total B cell (CD45+B220+) and plasma cell (CD45+B220−CD138+) frequency and number measured by flow cytometry. (D) Hematoxylin and eosin staining of lung sections (left) and quantified (right). (E) Representative flow plots of T cells pre-gated on live, CD45+, CD4+ cells isolated from lungs (top) and quantification of frequency, number, and staining intensity of IL-9+, IL-13+, and IL-9+IL-13+ cells (bottom). (F) Airway hyperreactivity testing in response to increasing doses of methacholine. Data are the average of 3–6 mice per condition and are the result of two combined experiments. One-way analysis of variance with Tukey’s post-hoc test was used for comparison of three or more groups. Two-way analysis of variance was used for comparison of time-course studies with two groups and multiple time points. * p < 0.05, ** p < 0.01, *** p < 0.001, **** p < 0.0001. # = number; A.f. = Aspergillus fumigatus; AAD = allergic airway disease; BAL = bronchoalveoalr lavage; CD = cluster of differentiation; i.n = intranasally; IL = interleukin; PBS = phosphate buffer saline; RI = resistance; wk, week; WT = wildtype.

References

    1. Ferrante G & La Grutta S The burden of pediatric asthma. Front. Pediatr. 6, 186 (2018). - PMC - PubMed
    1. Locksley RM Asthma and allergic inflammation. Cell 140, 777–783 (2010). - PMC - PubMed
    1. Chung KF & Barnes PJ Cytokines in asthma. Thorax. 54, 825–857 (1999). - PMC - PubMed
    1. Robinson DS et al. Predominant TH2-like bronchoalveolar T-lymphocyte population in atopic asthma. N. Engl. J. Med. 326, 298–304 (1992). - PubMed
    1. Walker JA & McKenzie ANJ TH2 cell development and function. Nat. Rev. Immunol. 18, 121–133 (2018). - PubMed

MeSH terms

Substances