. 2024 May;14(5):855-866.
doi: 10.1002/2211-5463.13793. Epub 2024 Mar 17.

Cholesterol-regulated cellular stiffness may enhance evasion of NK cell-mediated cytotoxicity in gastric cancer stem cells

Affiliations

Cholesterol-regulated cellular stiffness may enhance evasion of NK cell-mediated cytotoxicity in gastric cancer stem cells

Lijuan Zhu et al. FEBS Open Bio. 2024 May.

Abstract

Gastric cancer has a high rate of recurrence, and as such, immunotherapy strategies are being investigated as a potential therapeutic strategy. Although the involvement of immune checkpoints in immunotherapy is well studied, biomechanical cues, such as target cell stiffness, have not yet been subject to the same level of investigation. Changes in the cholesterol content of the cell membrane directly influence tumor cell stiffness. Here, we investigated the effect of cholesterol on NK cell-mediated killing of gastric cancer stem-like cells. We report that surviving tumor cells with stem-like properties elevated cholesterol metabolism to evade NK cell cytotoxicity. Inhibition of cholesterol metabolism enhances NK cell-mediated killing of gastric cancer stem-like cells, highlighting a potential avenue for improving immunotherapy efficacy. This study suggests a possible effect of cancer cell stiffness on immune evasion and offers insights into enhancing immunotherapeutic strategies against tumors.

Keywords: NK cell; SREBP2; cancer stem cells; cholesterol; gastric cancer; immunotherapy.


Conflict of interest statement

The authors declare no conflict of interest.

Figures
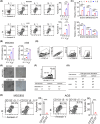
Fig. 1
Fig. 1
Gastric cancer stem cells evade NK cell‐mediated attack. (A) MGC803 or AGS cells were co‐incubated with NK‐92 at different ratios for 6 h. Cell apoptosis was determined using flow cytometry. (B) CD133 levels in MGC803 and AGS cells co‐incubated with NK‐92 cells at different E : T ratios were detected by flow cytometry. (C) NANOG, OCT4, and SOX2 levels in MGC803 and AGS cells co‐incubated with NK‐92 at different E : T ratios were detected using qPCR. (A) Surviving cancer cells from the NK tumor co‐culture system was determined by flow cytometry. (D) Surviving cancer cells from the NK tumor co‐culture system were determined by flow cytometry. (E) MGC803 (left) and AGS (right) cells were cultured in a flask system or 3D gel Matrigel for 3 days. In vitro colony formation assays, Bar 100 μm. (F) Flow cytometric analyzed expression of CD133 in tumors formed by CD133+ cells. (G) F1, and F2 generation cells were inoculated subcutaneously into NSG mice at a density of 5 × 104 cells. We then analyzed tumor formation. (H) CD133+, CD133 MGC803, or AGS cells were co‐incubated with NK‐92 for 6 h. Cell apoptosis was determined using flow cytometry. (A–D) n = 3 independent experiments. Two‐tailed Student's t‐test (H) or one‐way analysis of variance (ANOVA) followed by Bonferroni's test (A–D). The data are presented as the mean ± SD, *** represents P < 0.001.
Fig. 2
Fig. 2
Cells resistant to NK cell‐mediated killing exhibit cholesterol accumulation. (A) Relative membrane cholesterol levels of MGC803 and AGS cells before (n = 3) or after (n = 3) co‐incubation were determined using a cholesterol assay kit. (B) CD133high or CD133 tumor cells were sorted by flow cytometry. The relative membrane cholesterol levels were also measured. (C) SREBP2 expression in MGC803 and AGS cells before or after co‐incubation was determined by immunofluorescence, Bar 20 μm. (D) CD133high or CD133 tumor cells were sorted by flow cytometry. SREBP2 levels were also measured, Bar 20 μm. (E) Gene expression in the cholesterol metabolism of MGC803 or AGS cells before or after co‐incubation was determined by qPCR. (F) CD133high or CD133 tumor cells were sorted by flow cytometry. Gene expression was detected during cholesterol metabolism. Two‐tailed Student's t‐test (A–D) or one‐way analysis of variance (ANOVA) followed by Bonferroni's test (E, F). The data are presented as the mean ± SD, *** represents P < 0.001.
Fig. 3
Fig. 3
Cholesterol accumulation suppresses NK cell attack on gastric cancer stem cells. (A) Relative SREBP2 expression in MGC803 (left) and AGS (right) cells transfected with siNC and siSREBP2 was determined by qPCR. (B) NK92 cells were inoculated with siNC or siSREBP2‐MGC803/AGS cells, and an apoptosis assay was performed. (C) NK92 cells were inoculated with siNC or si SREBP2‐MGC803 or AGS cells, followed by cholesterol treatment (10 μm), and apoptosis assays were performed. (D) CD133 levels in MGC803 and AGS cells treated with cholesterol (10 μm) were detected by flow cytometry. (A–D) n = 3 independent experiments. Two‐tailed Student's t‐test (D) or one‐way analysis of variance (ANOVA) followed by Bonferroni's test (A–C). The data are presented as the mean ± SD. n.s no significant difference, *** represents P < 0.001, ns represents no significant difference.
Fig. 4
Fig. 4
Cholesterol decreases cancer cell rigidity and inhibits NK cell‐mediated cytotoxicity against gastric cancer. (A) Relative cell membrane stiffness of CD133high or CD133 tumor cells sorted by flow cytometry. (B) Relative cell membrane stiffness of MGC803 and AGS cells before or after co‐incubation was determined by AFM. (C) Apoptosis levels of MGC803 (left) or AGS (right) cells treated with PBS, Simvastatin (10 μm), followed by co‐culture with NK92. (D) Relative cell membrane stiffness of MGC803 and AGS cells treated with PBS, Simvastatin (10 μm). (E) Relative cell membrane stiffness of MGC803 (left) or AGS (right) cells transfected with siNC and siSREBP2 determined by AFM. (A–E) n = 3 independent experiments. Two‐tailed Student's t‐test (A–D) or one‐way analysis of variance (ANOVA), followed by Bonferroni's test (E). The data are presented as the mean ± SD, ** represents P < 0.01, *** represents P < 0.001.
Fig. 5
Fig. 5
Cholesterol reduces the binding of perforin secreted by NK cells to target cells. (A) Relative Perforin levels of CD133high or CD133 tumor cells treated with PBS or recombinant human perforin protein. After washing with PBS three times, the tumor cells were extracted with membrane proteins, and perforin bound to the cell membrane was determined by western blotting. (B) Flow cytometric analysis of biotinylation in NK cells incubated with CD133+ or CD133 cells. (C) Co‐culturing NK cells with CD133+ or CD133 cells for 6 h. Perforin and CD107a of NK cells were analyzed by flow cytometry. (D) Relative PI levels of MGC803 (left) or AGS (right) cells transfected with siNC and siSREBP2, followed by treatment with PBS or recombinant human perforin protein were determined by flow cytometry. (E) Relative PI levels of MGC803 (left) or AGS (right) cells pretreated with PBS or Simvastatin, followed by treatment with PBS or recombinant human perforin protein were determined by flow cytometry. (B–E) n = 3 independent experiments. Two‐tailed Student's t‐test (B, C, E) or one‐way analysis of variance (ANOVA), followed by Bonferroni's test (D). The data are presented as the mean ± SD. n.s no significant difference, ** represents P < 0.01, *** represents P < 0.001, ns represents no significant difference.
Fig. 6
Fig. 6
Cholesterol reduces NK cell‐mediated cytotoxicity in vivo. (A) NSG mice were inoculated with siNC‐ or siSREBP2‐MGC803 or AGS cells. Mice with 5 × 5 mm tumors were adoptively transferred with or without NK‐92 cells (1 × 106 cells) once every 3 days for three times. Tumor growth and survival analyses were performed (n = 6). (B) NSG mice were inoculated with MGC803 or AGS cells. Mice with 5 × 5 mm tumor size were adoptively transferred with NK cells (1 × 106 cells) once every 3 days three times, followed by treatment with PBS or Simvastatin once every 3 days. Tumor growth and survival analyses were performed (n = 6). (C) The experiment was the same as in (B), except that transferred NK cells were isolated from the tumors for flow cytometric analysis of the expression of CD107a. (D) Overall survival compared with SREBP2 levels in patients with gastric cancer. (C) or (F) n = 3 independent experiments. In (A), (B), n = 6 mice. Two‐tailed Student's t‐test (C) or one‐way analysis of variance (ANOVA), followed by Bonferroni's test (A, B) and log‐RANK (A, B, D). The data are presented as the mean ± SD. n.s no significant difference, *** represents P < 0.001, ns represents no significant difference.

Similar articles

Cited by

References

    1. Smyth EC, Nilsson M, Grabsch H, Ivan Grieken NC and Lordick F (2020) Gastric cancer. Lancet 396, 635–648. - PubMed
    1. Joshi SS and Badgwell BD (2021) Current treatment and recent progress in gastric cancer. CA Cancer J Clin 71, 264–279. - PMC - PubMed
    1. Johnston FM and Beckman M (2019) Updates on management of gastric cancer. Curr Oncol Rep 21, 67. - PubMed
    1. Badgwell B (2016) Multimodality therapy of localized gastric adenocarcinoma. J Natl Compr Cancer Netw 14, 1321–1327. - PubMed
    1. Paoletti X, Oba K, Burzykowski T, Michiels S, Ohashi Y, Pignon JP, Rougier P, Sakamoto J, Sargent D, Sasako M et al. (2010) Benefit of adjuvant chemotherapy for resectable gastric cancer: a meta‐analysis. JAMA 303, 1729–1737. - PubMed

Publication types

MeSH terms