Meta-Analysis
. 2024 Mar 18;15(1):2407.
doi: 10.1038/s41467-024-46639-4.

Integrative genomic analyses identify candidate causal genes for calcific aortic valve stenosis involving tissue-specific regulation

Affiliations
Meta-Analysis

Integrative genomic analyses identify candidate causal genes for calcific aortic valve stenosis involving tissue-specific regulation

Sébastien Thériault et al. Nat Commun. .

Abstract

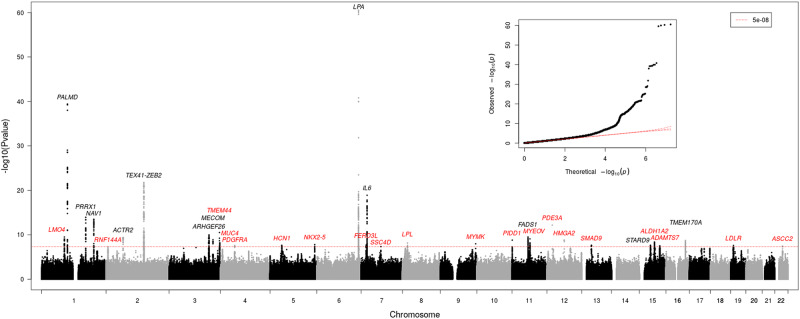
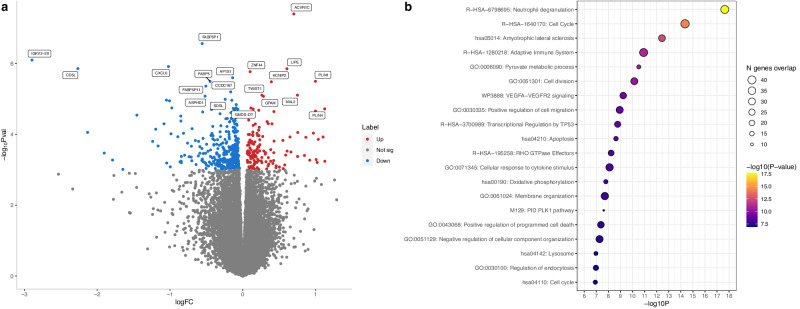
There is currently no medical therapy to prevent calcific aortic valve stenosis (CAVS). Multi-omics approaches could lead to the identification of novel molecular targets. Here, we perform a genome-wide association study (GWAS) meta-analysis including 14,819 cases among 941,863 participants of European ancestry. We report 32 genomic loci, among which 20 are novel. RNA sequencing of 500 human aortic valves highlights an enrichment in expression regulation at these loci and prioritizes candidate causal genes. Homozygous genotype for a risk variant near TWIST1, a gene involved in endothelial-mesenchymal transition, has a profound impact on aortic valve transcriptomics. We identify five genes outside of GWAS loci by combining a transcriptome-wide association study, colocalization, and Mendelian randomization analyses. Using cross-phenotype and phenome-wide approaches, we highlight the role of circulating lipoproteins, blood pressure and inflammation in the disease process. Our findings pave the way for the development of novel therapies for CAVS.


Conflict of interest statement

The authors declare no competing interests.

Figures

Fig. 1
Fig. 1. Manhattan plot of the genome-wide association studies meta-analysis for CAVS.
The nearest gene at each genome-wide significant locus is indicated, in black for known loci and in red for novel loci. The association of each variant with calcific aortic valve stenosis was obtained from an inverse-variance weighted fixed-effect meta-analysis combining the effect per allele in the cohorts with available data. A p-value below 5 × 10−8 was considered significant (genome-wide threshold). The genomic inflation factor was 1.099 and the LD score regression intercept was 1.020. The quantile-quantile plot (inset) illustrates the distribution of p-values for each variant tested.
Fig. 2
Fig. 2. Transcriptome-wide association study in human aortic valve and Mendelian randomization identify novel candidate causal genes at genome-wide significant loci.
a, d, g LocusCompare plots at the PRRX1, ATP13A3, and TWIST1 loci. P for calcific aortic valve stenosis was obtained from the inverse-variance weighted fixed-effect GWAS meta-analysis. P for valve eQTL was obtained from the nominal association between genotype and normalized gene expression. b, e, h Boxplots showing normalized gene expression in human aortic valves according to the genotype at the lead SNP at the PRRX1, ATP13A3, and TWIST1 loci. The center mark in the box represents the median, the bounds of the box represent the 25th and 75th percentiles and the whiskers are the most extreme data point, which is no more than 1.5 times the interquartile range. P GWAS was obtained from the inverse-variance weighted fixed-effect GWAS meta-analysis. P eQTL was obtained from the nominal association between genotype and normalized gene expression. The allele in red is the risk allele. c, f, i Scatterplot representing the effect of each SNP selected in the instrument for the Mendelian randomization (MR) analysis on gene expression in human aortic valves (n = 484) and risk of calcific aortic valve stenosis (n = 14,819 cases and 927,044 controls) at the PRRX1, ATP13A3, and TWIST1 loci. Data are presented as the effect and 95% confidence interval (+/−1.96*standard error). Red line: inverse-variant weighted (IVW) MR; Dotted red lines: 95% confidence interval for IVW MR; Green line: Weighted median MR; Pink line: Egger MR.
Fig. 3
Fig. 3. Impact of homozygous risk genotype near TWIST1 on aortic valve gene expression.
a Volcano plot representing the differentially expressed genes between individuals homozygous for rs7804522-C and individuals homozygous for rs7804522-G. Red points represent up-regulated genes (n = 148). Blue points represent down-regulated genes (n = 361). Statistical significance was set at P ≤ 0.001 corresponding to false-discovery rate <5% in the differential expression analysis. The top 10 up and down-regulated genes are labeled. b Lead independent enriched terms for the dysregulated genes. The statistical significance of the association for each term was obtained from a hypergeometric test and is illustrated by the color (p-value). The number of overlapping genes is illustrated by the size of the bubble.
Fig. 4
Fig. 4. Genes with multiple features suggesting their implication in CAVS.
Nearest gene: gene closest to a lead SNP in the GWAS meta-analysis; Intronic: annotation of the lead SNP in the meta-analysis; Missense or nonsense: lead GWAS SNP is in linkage disequilibrium (r2 ≥ 0.8) with a missense or nonsense variant for the gene; MAGMA: significant in MAGMA analysis at P < 0.00039 corresponding to false discovery rate <5%; High expression in valve: above the 90th percentile of all protein-coding genes; Valve-specific expression: expression specificity score >0.1; COLOC: colocalization PP4 > 0.75; Valve eQTL: significant eQTL; TWAS: significant in transcriptome-wide association study at P < 0.00017 corresponding to false discovery rate <5%; MR: significant in Mendelian randomization analyses (P < 0.05). Gold squares indicate a significant positive association; Blue squares indicate a significant negative association.
Fig. 5
Fig. 5. Lead SNPs at GWAS and TWAS loci are associated with cardiovascular traits in UK Biobank.
The nearest gene is indicated on the x-axis; * denotes TWAS loci. The traits are from the following categories: blood lipids (orange), blood pressure (brown), anthropometric traits (gray), cardiovascular diseases (red), diabetes (blue) and others (green). The effect size and statistical significance of the genetic association with the phenotype in UK Biobank are illustrated by the color (Z-score) and the size of the bubble (p-value).
Fig. 6
Fig. 6. Genetic correlation between CAVS and cardiovascular traits.
Data are presented as genetic correlation (rg) and 95% confidence interval (+/−1.96*standard error). The traits are from the following categories: blood lipids (orange), blood pressure (brown), anthropometric traits (gray), cardiovascular diseases (red), diabetes (blue) and others (green). LDL low-density lipoprotein, HDL high-density lipoprotein, BMI body mass index, WHR waist-to-hip ratio, WHRadjBMI waist-to-hip ratio adjusted for body mass index.

References

    1. Lindman BR, et al. Calcific aortic stenosis. Nat. Rev. Dis. Prim. 2016;2:16006. doi: 10.1038/nrdp.2016.6. - DOI - PMC - PubMed
    1. Nkomo VT, et al. Burden of valvular heart diseases: a population-based study. Lancet. 2006;368:1005–1011. doi: 10.1016/S0140-6736(06)69208-8. - DOI - PubMed
    1. Otto CM, Prendergast B. Aortic-valve stenosis–from patients at risk to severe valve obstruction. N. Engl. J. Med. 2014;371:744–756. doi: 10.1056/NEJMra1313875. - DOI - PubMed
    1. Moncla LHM, Briend M, Bossé Y, Mathieu P. Calcific aortic valve disease: mechanisms, prevention and treatment. Nat. Rev. Cardiol. 2023;20:546–559. doi: 10.1038/s41569-023-00845-7. - DOI - PubMed
    1. Bossé Y, Mathieu P, Thériault S. PALMD as a novel target for calcific aortic valve stenosis. Curr. Opin. Cardiol. 2019;34:105–111. doi: 10.1097/HCO.0000000000000605. - DOI - PubMed

Publication types

Supplementary concepts