. 2024 Mar 18;15(3):224.
doi: 10.1038/s41419-024-06602-z.

Disrupting pro-survival and inflammatory pathways with dimethyl fumarate sensitizes chronic lymphocytic leukemia to cell death

Affiliations

Disrupting pro-survival and inflammatory pathways with dimethyl fumarate sensitizes chronic lymphocytic leukemia to cell death

Maria Elena Mantione et al. Cell Death Dis. .

Abstract

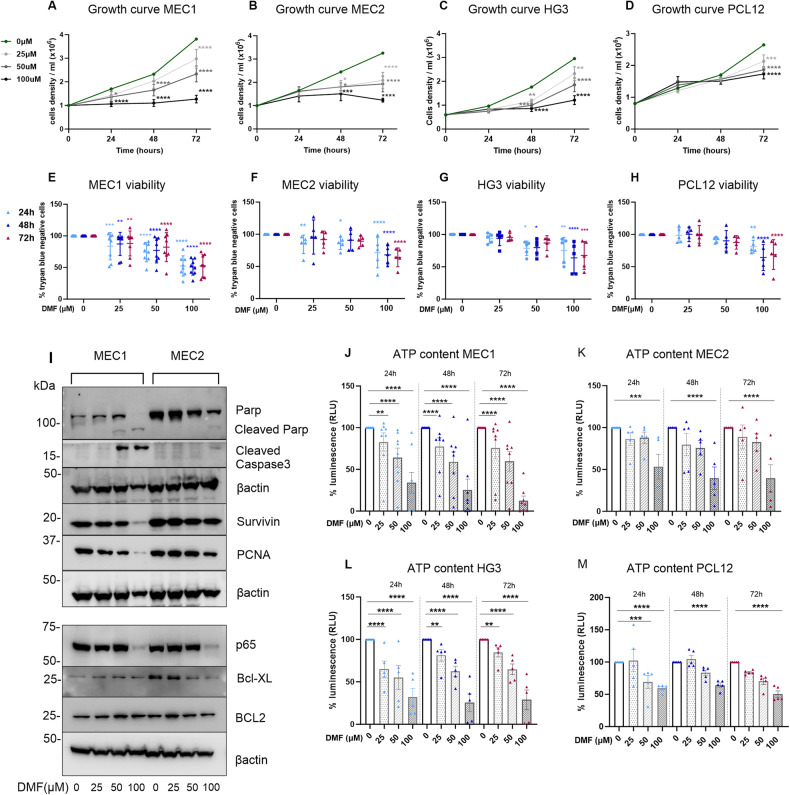
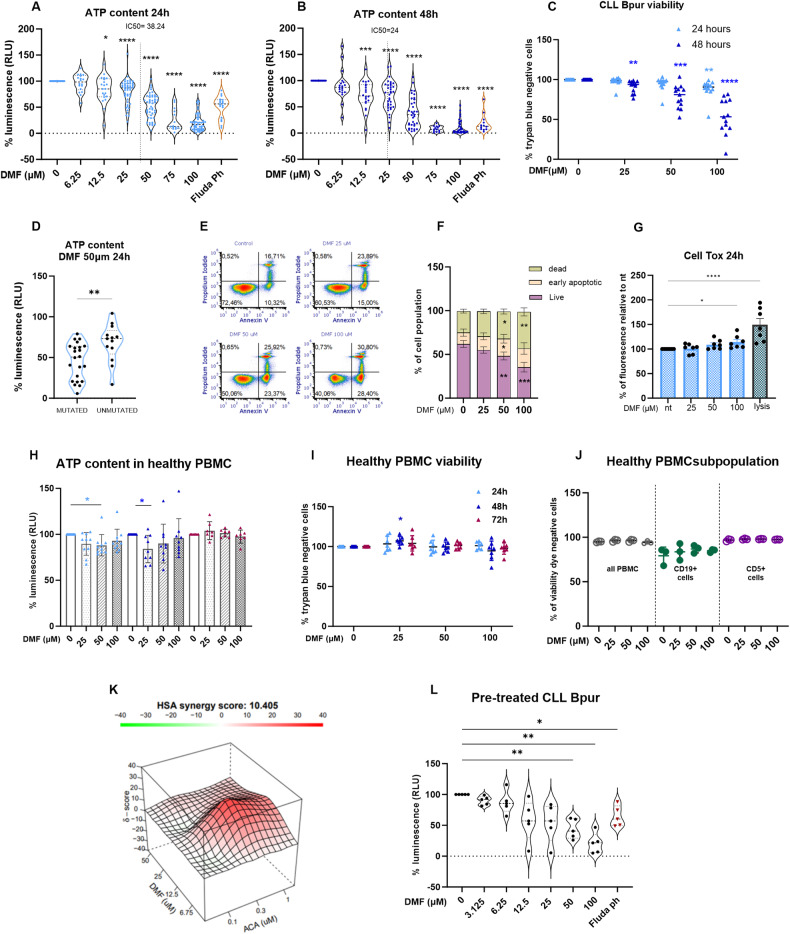
Microenvironmental signals strongly influence chronic lymphocytic leukemia (CLL) cells through the activation of distinct membrane receptors, such as B-cell receptors, and inflammatory receptors, such as Toll-like receptors (TLRs). Inflammatory pathways downstream of these receptors lead to NF-κB activation, thus protecting leukemic cells from apoptosis. Dimethyl fumarate (DMF) is an anti-inflammatory and immunoregulatory drug used to treat patients with multiple sclerosis and psoriasis in which it blocks aberrant NF-κB pathways and impacts the NRF2 antioxidant circuit. Our in vitro analysis demonstrated that increasing concentrations of DMF reduce ATP levels and lead to the apoptosis of CLL cells, including cell lines, splenocytes from Eµ-TCL1-transgenic mice, and primary leukemic cells isolated from the peripheral blood of patients. DMF showed a synergistic effect in association with BTK inhibitors in CLL cells. DMF reduced glutathione levels and activated the NRF2 pathway; gene expression analysis suggested that DMF downregulated pathways related to NFKB and inflammation. In primary leukemic cells, DMF disrupted the TLR signaling pathways induced by CpG by reducing the mRNA expression of NFKBIZ, IL6, IL10 and TNFα. Our data suggest that DMF targets a vulnerability of CLL cells linked to their inflammatory pathways, without impacting healthy donor peripheral blood mononuclear cells.


Conflict of interest statement

LS received honoraria from AbbVie, AstraZeneca, BeiGene, Janssen, Lilly, OctaPharma. PG received honoraria from AbbVie, AstraZeneca, ArQule/MSD, Celgene/Juno/BMS, Janssen, Lilly/loxo, Roche; Research support from AbbVie, AstraZeneca, Janssen. All other authors declare no conflicts of interest.

Figures

Fig. 1
Fig. 1. DMF inhibits CLL cell lines proliferation and induces cell death.
A–D Growth curves of the indicated cell lines treated with increasing concentrations of DMF for 24 h, 48 h and 72 h, expressed as cell number per milliliter. EH Cell viability was assessed with trypan blue exclusion method and automatic counting before and after 24 h, 48 h and 72 h of treatment with DMF; data are expressed as percentage of viable cells compared to that of untreated cells. n = 8 biological replicates for MEC1; n = 5 for the other cell lines for panels A-H. I Western blot analysis of proapoptotic and antiapoptotic proteins expression after DMF treatment (25, 50 and 100 µM); images representative of two independent experiments performed with MEC1 and MEC2 total cellular extracts. Beta-actin was used as internal control. JM Metabolic activation in CLL cell lines exposed to increasing doses of DMF (25–100 µM) after 24 h, 48 h and 72 h; ATP content is expressed as percentage of relative luminescence units, RLU, versus untreated (MEC1, n = 8; MEC2, n = 5; HG3, n = 5; PCL12, n = 5). All the data are shown as the mean ± SD. Two-way ANOVA with Dunnett’s post hoc test was performed for multiple comparisons. *p < 0.05; **p < 0.01; ***p < 0.001; ****p < 0.0001.
Fig. 2
Fig. 2. DMF reduces the viability and metabolic activation of primary CLL cells.
Increasing concentrations of DMF from 6.25 to 100 µM were applied to CLL cells for 24 h (A n = 51) and 48 h (B n = 35); following, cell titer assay was performed, and data are expressed as the percentage of metabolic activation compared to untreated. Two-way ANOVA was performed, followed by Dunnett’s post hoc test for multiple comparisons. *p < 0.05; **p < 0.01; ***p < 0.001, ****p < 0.0001. The calculated IC50 values at 24 h (A) and 48 h (B) are reported. C Viability of CLL patients’ leukemic cells at 24 h and 48 h after in vitro culture with or without DMF (25, 50 and 100 µM); cell viability was assessed with the trypan blue exclusion method and automatic counting, and the results are shown as the percentage of viable cells compared to that of untreated cells (n = 14, mean ± SD). D DMF-mediated effects in terms of reduced ATP levels are reported in IGHV-mutated versus IGHV-unmutated CLL samples. E Representative plot of Annexin V and propidium iodide (PI) flow cytometry analysis of CLL primary samples treated with DMF. F Bar graph showing the percentage of alive, early apoptotic, and dead CLL cells after 24 h of DMF treatment (n = 8). The means ± SEMs are shown, and one-way ANOVA was applied. G Relative toxicity was evaluated by Cell Tox Green in CLL cells treated with DMF for 24 h. Evaluation of the ATP content (H) and relative cell viability (I) of PBMCs isolated from healthy donors at 24 h (n = 10), 48 h (n = 9) and 72 h (n = 7) after treatment with DMF at 25, 50, or 100 µM (mean ± SD). J Flow cytometry analysis of cell viability in PBMCs or B- or T-cell compartments as assessed by staining with CD5, CD19 and viability dye; PBMCs were exposed to DMF for 24 h before analysis (n = 3). K CLL cells were treated in vitro with increasing concentrations of DMF plus acalabrutinib (n = 8). Metabolic activation was measured by cell titer, and relative ATP values were used to calculate the combination index. L CLL cells were isolated from the peripheral blood of patients undergoing treatment with a BTK inhibitor; the percentage of relative ATP content in samples treated in vitro for 24 h with the indicated concentrations of DMF is reported. The Friedman test was performed (n = 5). *p < 0.05, **p < 0.01, ***p < 0.001.
Fig. 3
Fig. 3. DMF depletes the GSH pool and induces NRF2 activation.
A Relative level of reduced glutathione (GSH) in purified CLL cells (Bpur) or PBMCs isolated from healthy donors before and after DMF treatment for 4 h (n = 3) or 24 h (n = 6 for CLL Bpur and n = 4 for PBMCs) as indicated. The data are presented as the percentage of relative luminescence units normalized to the untreated. The data are presented as the means ± SDs, and Student’s t test was applied. B, C, G GPX4 (n = 9), LPCAT3 (n = 8) and NRF2 (n = 5) mRNA expression levels relative to those of beta-actin were evaluated by qRT‒PCR in CLL samples treated for 4 h with DMF. The bar graph shows the mean ± SD, and Student’s t test was used to compare two groups. Representative histograms of flow cytometry analysis (D) and quantification of lipid peroxidation by flow cytometry using Bodypi C11 at 24 h (n = 10, E) and 48 h (n = 8, F) (mean ± SD). H Immunoblotting for GPX4, NRF2 and its target HO-1 in whole-cell lysates of CLL samples (n = 5) and MEC2 cells with or without 100 µM DMF for 4 h. I Immunoblot analysis of NRF2 and HO-1 proteins in the MEC1 and MEC2 cell lines. The expression in nuclear, cytoplasmic or total fractions was analyzed. Bactin and lamin B1 were used as internal controls. J Ros production detected by flow cytometry in DMF-treated cells compared to untreated cells (4 h). K Ros positivity in dead or alive CLL cells treated for 24 h with DMF alone or in combination with NAC. NAC restored viability (L) and ATP levels (M) of CLL cells treated with DMF for 24 h.
Fig. 4
Fig. 4. DMF triggers a specific transcriptional program in CLL cells.
A–D RNA-sequencing data of 5 CLL samples treated with DMF and untreated cells were analyzed. A Volcano plot of DMF-treated compared to untreated CLL cells; the X-axis denotes the values of Log2FC, and the Y-axis denotes the values of Log10pValue. Significant genes are defined by |Log2FC| ≥ 1 and different pValues: pValue between ≤ 0.05 and >0.01 (green); pValue between ≤0.01 and >0.001; (blue); pValue ≤ 0.001 (violet). Unchanged genes are represented in yellow. B Heatmap showing the clustered expression values of the top 100 DEGs between CLL cells treated with 100 µM DMF for 4 h and untreated. Genes are flagged as “differentially expressed” if they satisfy both the following conditions: nominal p value < 0.01 and LogFC ≥1. A three-color scheme was used, with blue indicating downregulated and red upregulated. Values have been scaled in rows. The color key is displayed at the top of the heatmap. C Enrichment map. Enrichment analysis was performed with Metascape, and the top 20 enriched pathways among all the lists are shown. D Specific analysis of the transcription factor TRRUST was performed with Metascape, and the top 20 enriched factors (downregulated or upregulated) are shown. E, F Gene‒metabolite integrative analysis performed with Omics.net. Metabolites are represented in green, and genes are represented in red for upregulated and in blue for downregulated DEGs.
Fig. 5
Fig. 5. DMF reduces inflammatory stimuli due to TLR9 stimulation with CpG.
Time schedule of treatments. Cells were treated with DMF and immediately afterwards with 2.5 μg/ml CpG (A) and/or were stimulated for 4 h with CpG, after which increasing concentrations of DMF were applied (B). C ATP content, a measure of metabolic activation, was addressed by a cell titer assay in CLL cells (n = 23) cotreated with DMF and CpG (green bars; 24 h) or pretreated with CpG followed by DMF (blue bars; 24 h). Cell viability was measured in CLL cells cotreated with DMF and CpG (D n = 10) or pretreated with CpG followed by DMF (E n = 12). The data are expressed as the mean ± SEM. **p < 0.01, ***p < 0.001. FI NFKBIZ (n = 6), IL6 (n = 6), IL10 and TNFα (n = 5) mRNA expression relative to that of 18S, β-actin and TBP was measured by qRT-PCR after 4 h of treatment with 100 µM DMF and/or CpG. The data are expressed as the mean ± SEM. *p < 0.05. J PARP cleavage and PCNA protein levels in CLL cell extracts after exposure to DMF and CpG for 24 h were analyzed by western blotting. One representative experiment out of 3. IkBz, BCL-xl, BCL2 and p65 were also analyzed; one representative blot out of 2 is shown. β-Actin was used as a loading control. K, L ATP quantification and protein expression were evaluated in murine leukemic cells incubated with increasing concentrations of DMF alone or in combination with CpG. K Relative ATP content was measured by a cell titer assay in TCL1-transgenic splenocytes (n = 8) cotreated with DMF and CpG for 24 h in vitro. L IkBz, BCL-xl, BCL2, total and cleaved PARP were analyzed by western blot in leukemic TCL1-transgenic mouse-derived splenocytes cotreated with DMF and CpG for 24 h. One representative experiment out of 2.

References

    1. Bosch F, Dalla-Favera R. Chronic lymphocytic leukaemia: from genetics to treatment. Nat Rev Clin Oncol. 2019;16:684–701. - PubMed
    1. Fabbri G, Dalla-Favera R. The molecular pathogenesis of chronic lymphocytic leukaemia. Nat Rev Cancer. 2016;16:145–62. - PubMed
    1. O’Donnell A, Pepper C, Mitchell S, Pepper A. NF-kB and the CLL microenvironment. Front Oncol. 2023;13:1169397. - PMC - PubMed
    1. Ghia P, Chiorazzi N, Stamatopoulos K. Microenvironmental influences in chronic lymphocytic leukaemia: the role of antigen stimulation. J Intern Med. 2008;264:549–62. - PubMed
    1. Vlachonikola E, Sofou E, Chatzidimitriou A, Stamatopoulos K, Agathangelidis A. The significance of B-cell receptor stereotypy in chronic lymphocytic leukemia: biological and clinical implications. Hematol Oncol Clin N Am. 2021;35:687–702. - PubMed

Publication types