. 2024 Apr;28(7):e18172.
doi: 10.1111/jcmm.18172.

The relationship of ALPK1, hyaluronic acid and M1 macrophage polarization in the temporomandibular joint synovitis

Affiliations

The relationship of ALPK1, hyaluronic acid and M1 macrophage polarization in the temporomandibular joint synovitis

Jie Zhao et al. J Cell Mol Med. 2024 Apr.

Abstract

M1 macrophage polarization and synovitis play an important role in the pathogenesis of temporomandibular joint osteoarthritis (TMJOA). Reduced molecular weight of hyaluronic acid (HA) in synovial fluid of patients with TMJOA. In addition, high molecular weight hyaluronic acid (HMW-HA) is often used clinically to treat TMJ inflammation. As a pattern recognition receptor of the cytoplasm, ALPK1 was found to be pro-inflammatory in a variety of diseases. However, the relationship of ALPK1, HA and M1 macrophage polarization in TMJ synovitis remains unclear. We aimed to investigate the role of ALPK1 and HA in macrophage polarization and TMJ synovitis and the underlying mechanisms. The results demonstrated that ALPK1 was highly upregulated in the synovial macrophages in the inflamed TMJ synovium of patients. Low molecular weight hyaluronic acid (LMW-HA) promoted the expression of ALPK1 and M1 macrophage-associated genes. Besides, rhALPK1 promoted the expression of M1 macrophage-associated factors and the nuclear translocation of PKM2. Furthermore, ALPK1 knockout mice exhibited limited infiltration of macrophages and decreased expression levels of M1 macrophage-associated genes in CFA-induced TMJ synovitis. While HMW-HA inhibited the expression of ALPK1 and M1 macrophage polarization. Our results elucidated that ALPK1 promoted TMJ synovitis by promoting nuclear PKM2-mediated M1 macrophage polarization, whereas HMW-HA inhibited the expression of ALPK1 as well as M1 macrophage polarization.

Keywords: ALPK1; PKM2; hyaluronic acid; macrophage polarization; temporomandibular joint synovitis.


Conflict of interest statement

The authors declared no potential conflicts of interest with respect to the research, authorship and/or publication of this article.

Figures

FIGURE 1
FIGURE 1
ALPK1 is highly expressed in macrophages of TMJ inflamed synovium. (A) Upregulation of ALPK1 in the synovial fluid of patients with TMJ synovitis was discovered by ELISA, as compared with patients with anterior disc displacement with reduction (ADDWR). Mann–Whitney U‐test, minimum to maximum with all points, n = 8–11, p = 0.0328. (B) Haematoxylin and eosin (H&E) staining showed the control synovium and inflamed synovial. (C) The expression of ALPK1 was examined in TMJ synovium. (D) Quantitative analysis of ALPK1 in TMJ synovium. Mann–Whitney U‐test, minimum to maximum with all points, n = 5, p = 0.0159. (E) The expression of ALPK1 was examined in TMJ synovial macrophages and TMJ synovial fibroblasts. (F) Quantitative analysis of ALPK1 in TMJ synovial macrophages and TMJ synovial fibroblasts. Mann–Whitney U‐test, minimum to maximum with all points, n = 5, p = 0.0079. *p < 0.05. **p < 0.01.
FIGURE 2
FIGURE 2
LMW‐HA enhances the expression of ALPK1 and M1 macrophage polarization. (A) Effect of LMW‐HA on the expression of ALPK1, INOS, TNF‐α in RAW264.7 cells by western blot. One‐way analysis of variance, mean ± SEM, n = 5. (B) Effect of LMW‐HA on the expression of ALPK1, INOS, TNF‐α, IL‐6 and IL‐1β in RAW264.7 cells by qPCR. One‐way analysis of variance, mean ± SEM, n = 4. (C) Effect of LMW‐HA on the expression of ALPK1, INOS and TNF‐α in RAW264.7 cells pretreated with LPS (100 ng/mL) and IFN‐γ (20 ng/mL) for 24 h by western blot. One‐way analysis of variance, mean ± SEM, n = 5. (D) Effect of LMW‐HA on the expression of ALPK1, INOS, TNF‐α, IL‐6 and IL‐1β in RAW264.7 cells pretreated with LPS (100 ng/mL) and IFN‐γ (20 ng/mL) for 24 h by qPCR. One‐way analysis of variance, mean ± SEM, n = 4. *p < 0.05. **p < 0.01. ***p < 0.001. ****p < 0.0001. NS, no significance.
FIGURE 3
FIGURE 3
ALPK1 promotes M1 macrophage polarization in vitro. (A) qPCR analysis exhibited that rhALPK1 (20 ng/mL) increased the production of CD86, INOS, TNF‐α, IL‐6 and IL‐1β in RAW264.7cells. Relative levels of CD86: Control group versus LPS + IFN‐γ group, p = 0.0224. LPS + IFN‐γ group versus LPS + IFN‐γ + rhALPK1 group, p = 0.0026. Relative levels of INOS: Control group versus LPS + IFN‐γ group, p < 0.0001. LPS + IFN‐γ group versus LPS + IFN‐γ + rhALPK1 group, p < 0.0001. Relative levels of TNF‐α: Control group versus LPS + IFN‐γ group, p = 0.0342. LPS + IFN‐γ group versus LPS + IFN‐γ + rhALPK1 group, p = 0.0087. Relative levels of IL‐6: Control group versus LPS + IFN‐γ group, p = 0.0003. LPS + IFN‐γ group versus LPS + IFN‐γ + rhALPK1 group, p = 0.0252. Relative levels of IL‐1β: Control group versus LPS + IFN‐γ group, p < 0.0001. LPS + IFN‐γ group versus LPS + IFN‐γ + rhALPK1 group, p < 0.0001. One‐way analysis of variance, mean ± SEM, n = 3. (B) rhALPK1(20 ng/mL) increased protein expression of INOS and IL‐1β in LPS + IFN‐γ‐treated RAW264.7 cells. (C) Quantitative analysis of the relative density of INOS and IL‐1β. Relative density of INOS: Control group versus LPS + IFN‐γ group, p = 0.0115. LPS + IFN‐γ group versus LPS + IFN‐γ + rhALPK1 group, p = 0.0017. Relative density of IL‐1β: Control group versus LPS + IFN‐γ group, p = 0.0004. LPS + IFN‐γ group versus LPS + IFN‐γ + rhALPK1 group, p = 0.0091. One‐way analysis of variance, mean ± SEM, n = 3. (D) ELISA analysis exhibited that rhALPK1 (20 ng/mL) increased the secretion of TNF‐α and IL‐6 in RAW264.7cells. Cytokines of TNF‐α: Control group versus LPS + IFN‐γ group, p < 0.0001. LPS + IFN‐γ group versus LPS + IFN‐γ + rhALPK1 group, p = 0.0002. Cytokines of IL‐6: Control group versus LPS + IFN‐γ group, p = 0.0004. LPS + IFN‐γ group versus LPS + IFN‐γ + rhALPK1 group, p = 0.0071. One‐way analysis of variance, mean ± SEM, n = 3. (E) ALPK1 increases the expression of INOS by Immunofluorescence staining. (F) Quantitative analysis of the relative density of INOS. Student's t‐test, n = 3. *p < .05.**p < .01.***p < 0.001.****p < 0.0001.
FIGURE 4
FIGURE 4
ALPK1 deficiency alleviates CFA‐induced synovial inflammation in TMJ of mice. (A) ALPK1 deficiency alleviated CFA‐induced synovitis of inflamed TMJs in the first and second weeks, with the phenomena of decreased synovial cell layers (red solid box), stromal cell density (yellow solid box) and inflammatory cell infiltration (blue solid box). (B) The expression of F4/80 (macrophage marker) and INOS (M1‐like macrophage marker) was examined in the TMJ synovium of mice by Immunofluorescence. (C) Synovitis score of mice. 1 week: Comparing WT + Saline group versus WT + CFA group, p < 0.0001. Comparing WT + CFA group versus ALPK1−/− + CFA group, p = 0.0106. 2 weeks: Comparing WT + Saline group versus WT + CFA group, p = 0.0001. Comparing WT + CFA group versus ALPK1−/− + CFA group, p = 0.0057. (D) Quantitative analysis of the fluorescence intensity of F4/80 and INOS in TMJ synovium of mice. Fluorescence intensity of F4/80 for 1 week: Comparing WT + Saline group versus WT + CFA group, p = 0.0029. Comparing WT + CFA group versus ALPK1−/− + CFA group, p = 0.0235. Fluorescence intensity of INOS for 1 week: Comparing WT + Saline group versus WT + CFA group, p < 0.0001. Comparing WT + CFA group versus ALPK1−/− + CFA group, p = 0.0008. Fluorescence intensity of F4/80 for 2 weeks: Comparing WT + Saline group versus WT + CFA group, p < 0.0001. Comparing WT + CFA group versus ALPK1−/− + CFA group, p < 0.0001. Fluorescence intensity of INOS for 2 weeks: Comparing WT + Saline group versus WT + CFA group, p = 0.0002. Comparing WT + CFA group versus ALPK1−/− + CFA group, p = 0.0004. One‐way analysis of variance, mean ± SEM, n = 5. *p < 0.05.**p < 0.01. ***p<0.001. ****p < 0.0001.
FIGURE 5
FIGURE 5
ALPK1 deficiency reduces the expression of pro‐inflammatory factors in synovial macrophages in TMJ of mice. (A) ALPK1 deficiency reduces the expression of IL‐6, IL‐1β and TNF‐α in the synovium of TMJ. (B) Average optical density (AOD) of positive staining for IL‐6 in TMJ synovium of mice. 1 week: Comparing WT + Saline group versus WT + CFA group, p = 0.0025. Comparing WT + CFA group versus ALPK1−/− + CFA group, p = 0.0047. 2 weeks: Comparing WT + Saline group versus WT + CFA group, p < 0.0001. Comparing WT + CFA group versus ALPK1−/− + CFA group, p < 0.0001. (C) Average optical density (AOD) of positive staining for IL‐1β in TMJ synovium of mice. 1 week: Comparing WT + Saline group versus WT + CFA group, p = 0.0002. Comparing WT + CFA group versus ALPK1−/− + CFA group, p = 0.0008. 2 weeks: Comparing WT + Saline group versus WT + CFA group, p < 0.0001. Comparing WT + CFA group versus ALPK1−/− + CFA group, p < 0.0001. (D) Average optical density (AOD) of positive TNF‐α staining in TMJ synovium of mice. 1 week: Comparing WT + Saline group versus WT + CFA group, p < 0.0001. Comparing WT + CFA group versus ALPK1−/− + CFA group, p < 0.0001. 2 weeks: Comparing WT + Saline group versus WT + CFA group, p = 0.0011. Comparing WT + CFA group versus ALPK1−/− + CFA group, p = 0.0022. One‐way analysis of variance, mean ± SEM, n = 5. **p < 0.01. ***p < 0.001. ****p < 0.0001.
FIGURE 6
FIGURE 6
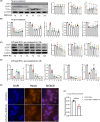
ALPK1 promotes M1 macrophage polarization by increasing the nuclear translocation of PKM2. (A) RAW264.7 cells were treated with rhALPK1 (20 ng/mL) in the presence of LPS and IFN‐γ for 24 h. Cytosolic and nuclear protein fractions were immunoblotted with the indicated antibodies. (B) Quantitative analysis of the relative density of PKM2. PKM2 (Cytosol), p = 0.8088. PKM2(Nucleus), p = 0.0016. (C) RAW264.7 cells were treated with 50 umol/L DASA‐58(B6025, APExBIO) in the presence of LPS, IFN‐γ and rhALPK1 for 24 h. Cytosolic and nuclear protein fractions were immunoblotted with the indicated antibodies. (D) Quantitative analysis of the relative density of INOS, IL‐1β and PKM2. Relative density of INOS in Cytosol, p = 0.0221. Relative density of IL‐1β in Cytosol, p = 0.0105. Relative density of PKM2 in Cytosol, p = 0.9317. Relative density of PKM2 in Nucleus, p = 0.0226. (E) QPCR analysis showed that 50 umol/L DASA‐58 inhibits the expression of CD86, INOS, TNF‐α, IL‐1β and IL‐6 in RAW264.7 cells. CD86, p = 0.0126. INOS, p = 0.0079. TNF‐α, p = 0.0315. IL‐1β, p = 0.0007. IL‐6, p = 0.0244. (F) DASA‐58 inhibits the secretion of TNF‐α and IL‐6 in RAW264.7 cells. TNF‐α, p = 0.0048. IL‐6, p = 0.0042. Student's t‐test, mean ± SEM, n = 3. *p < 0.05. **p < 0.01. ***p < 0.001. NS, No Significance.
FIGURE 7
FIGURE 7
HMW‐HA inhibits the expression of ALPK1 and M1 macrophage polarization. (A) Effect of HMW‐HA on the expression of ALPK1, INOS, TNF‐α in RAW264.7 cells by western blot. One‐way analysis of variance, mean ± SEM, n = 5. (B) Effect of HMW‐HA on the expression of ALPK1, INOS, TNF‐α, IL‐6 and IL‐1β in RAW264.7 cells by qPCR. One‐way analysis of variance, mean ± SEM, n = 4. (C) Effect of HMW‐HA on the expression of ALPK1, INOS and TNF‐α in RAW264.7 cells pretreated with LPS (100 ng/mL) and IFN‐γ (20 ng/mL) for 24 h by western blot. One‐way analysis of variance, mean ± SEM, n = 5. (D) Effect of HMW‐HA on the expression of ALPK1, INOS, TNF‐α, IL‐6 and IL‐1β in RAW264.7 cells pretreated with LPS (100 ng/mL) and IFN‐γ (20 ng/mL) for 24 h by qPCR. One‐way analysis of variance, mean ± SEM, n = 4. (E) HMW‐HA inhibited the nuclear translocation of PKM2 in the absence of LPS and IFN‐γ pretreatment. (F) Quantitative analysis of the relative density of PKM2. Student's t‐test, n = 3. *p < 0.05. **p < 0.01. ***p < 0.001. ****p < 0.0001. NS, no significance.

Similar articles

Cited by

References

    1. Wang XD, Zhang JN, Gan YH, Zhou YH. Current understanding of pathogenesis and treatment of TMJ osteoarthritis. J Dent Res. 2015;94:666‐673. doi:10.1177/0022034515574770 - DOI - PubMed
    1. Berenbaum F. Osteoarthritis as an inflammatory disease (osteoarthritis is not osteoarthrosis!). Osteoarthr Cartil. 2013;21:16‐21. - PubMed
    1. Nozawa‐Inoue K, Harada F, Magara J, Ohazama A, Maeda T. Contribution of synovial lining cells to synovial vascularization of the rat temporomandibular joint. J Anat. 2016;228:520‐529. doi:10.1111/joa.12426 - DOI - PMC - PubMed
    1. Zhang H, Lin C, Zeng C, et al. Synovial macrophage M1 polarisation exacerbates experimental osteoarthritis partially through R‐spondin‐2. Ann Rheum Dis. 2018;77:1524‐1534. doi:10.1136/annrheumdis-2018-213450 - DOI - PubMed
    1. Chen M, Fu W, Xu H, Liu C‐J. Tau deficiency inhibits classically activated macrophage polarization and protects against collagen‐induced arthritis in mice. Arthritis Res Ther. 2023;25:146. doi:10.1186/s13075-023-03133-4 - DOI - PMC - PubMed

Publication types