. 2024 Mar 3;10(5):e26998.
doi: 10.1016/j.heliyon.2024.e26998. eCollection 2024 Mar 15.

Behavioral game of quarantine during the monkeypox epidemic: Analysis of deterministic and fractional order approach

Affiliations

Behavioral game of quarantine during the monkeypox epidemic: Analysis of deterministic and fractional order approach

Mohammad Sharif Ullah et al. Heliyon. .

Abstract

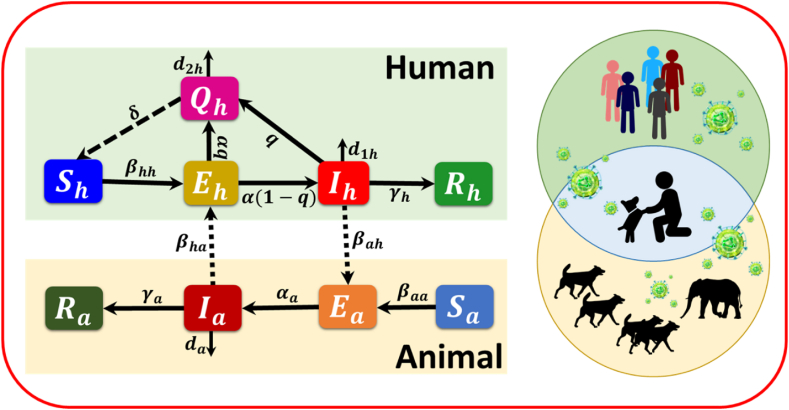
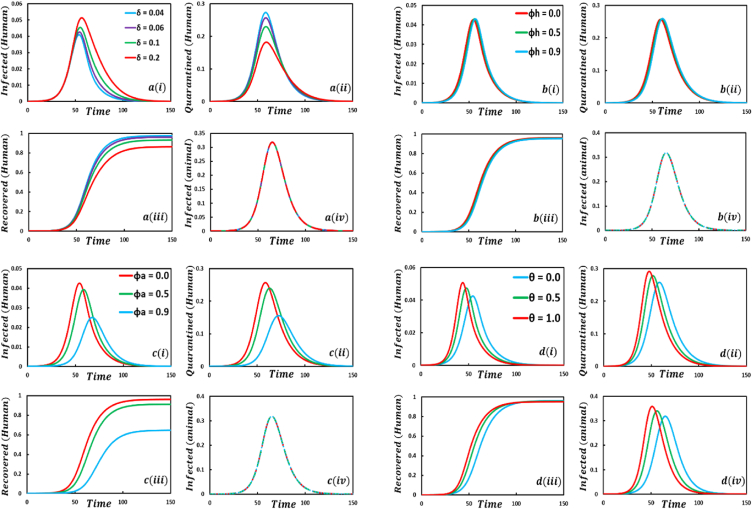
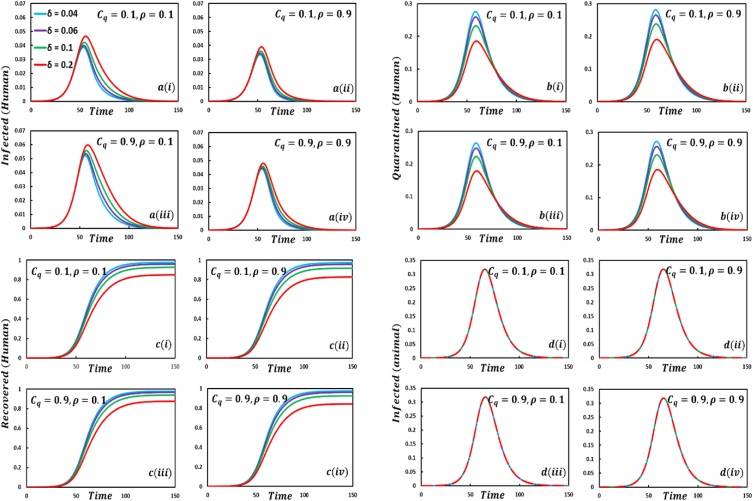
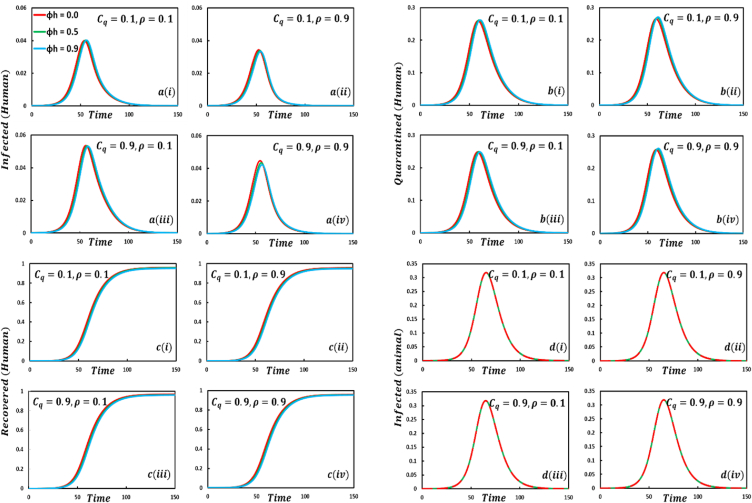
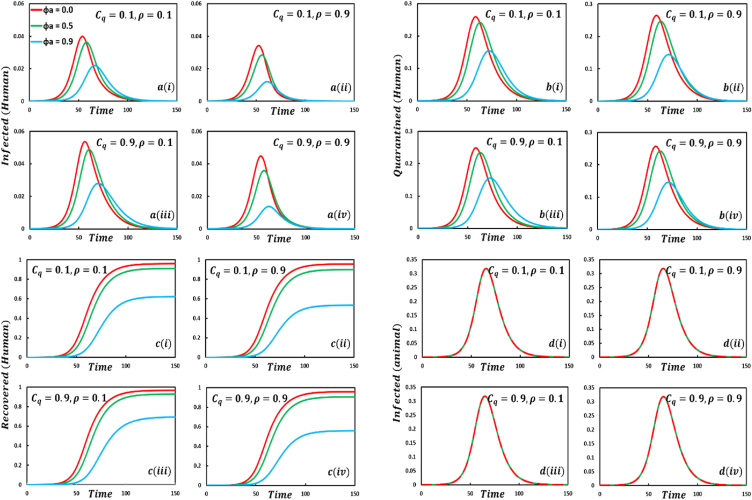
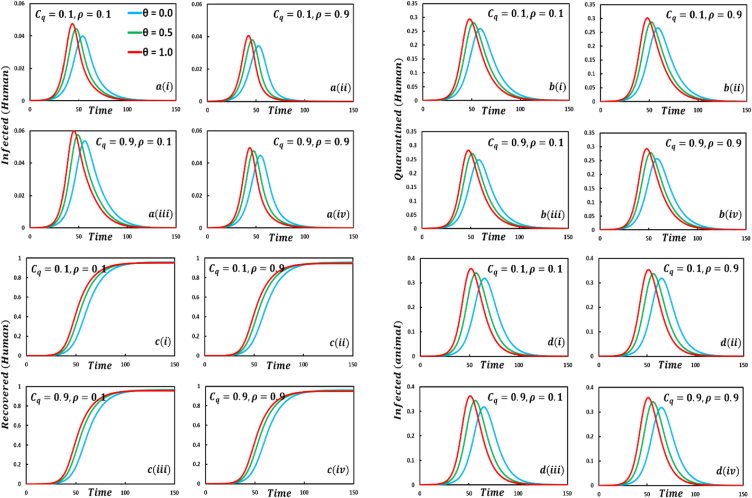
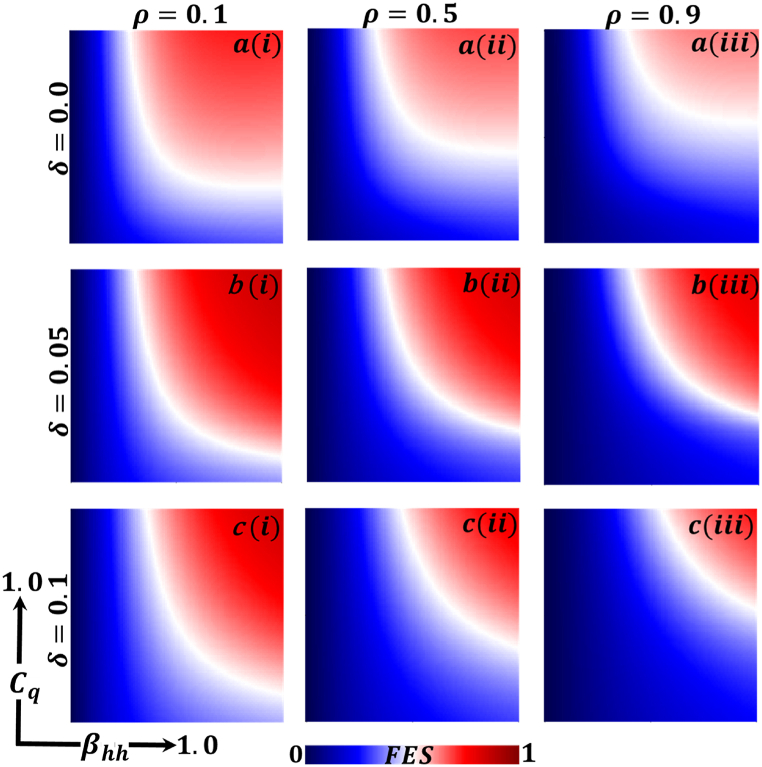
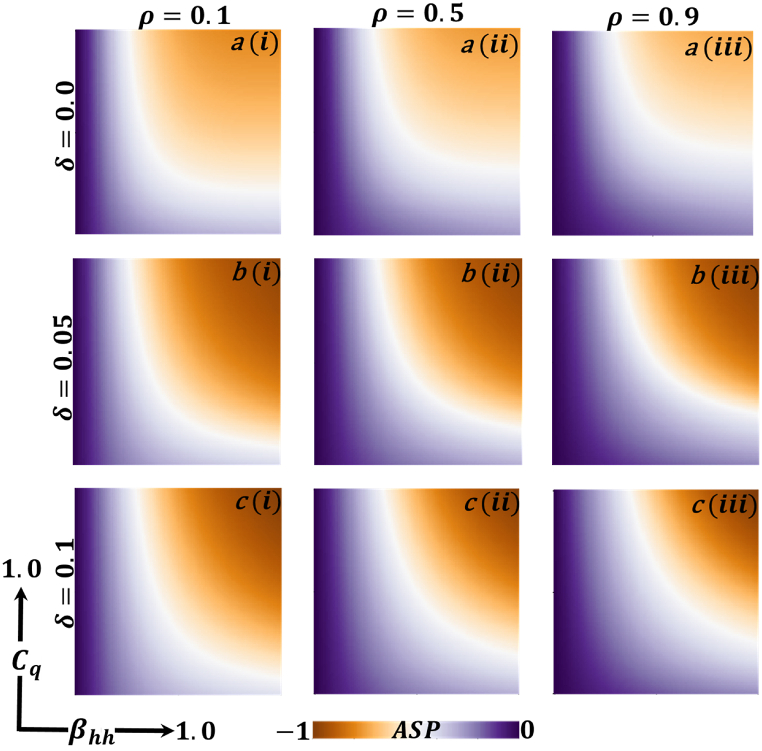
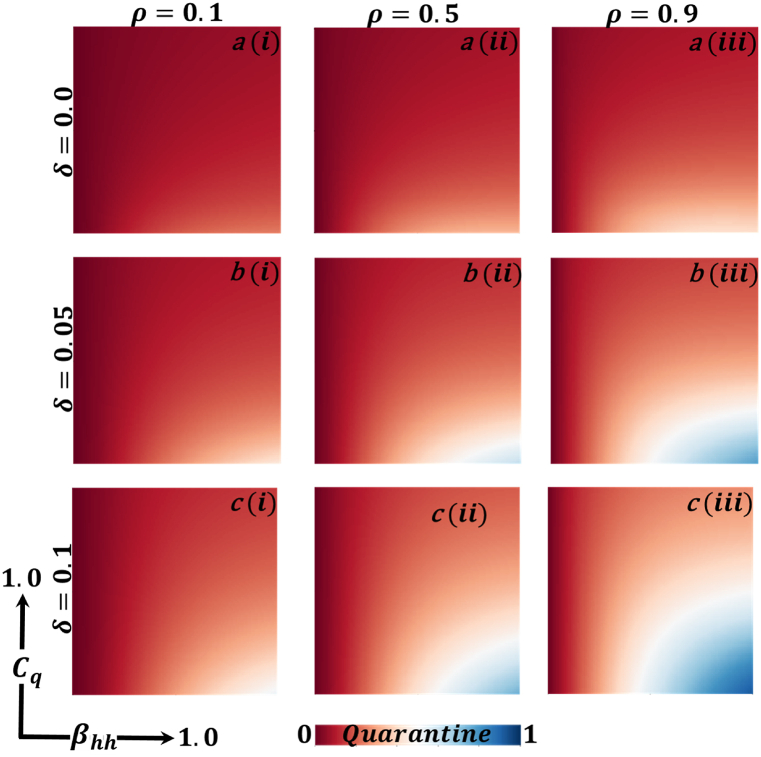
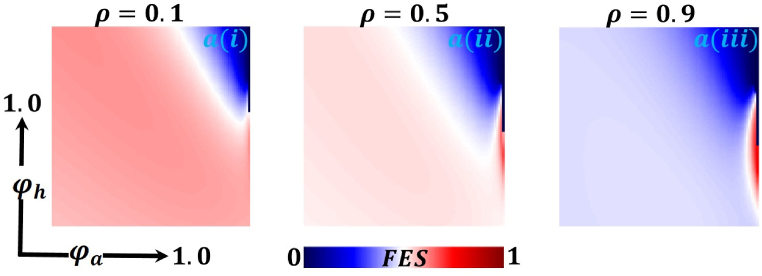
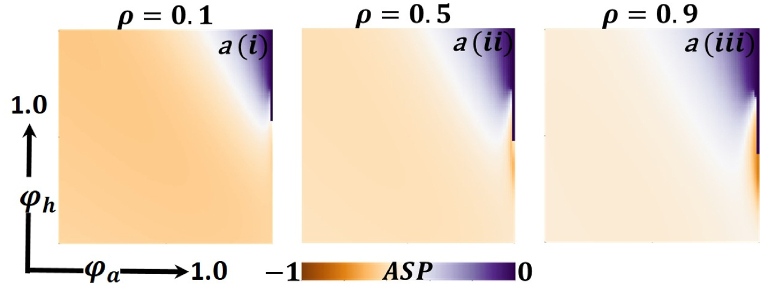
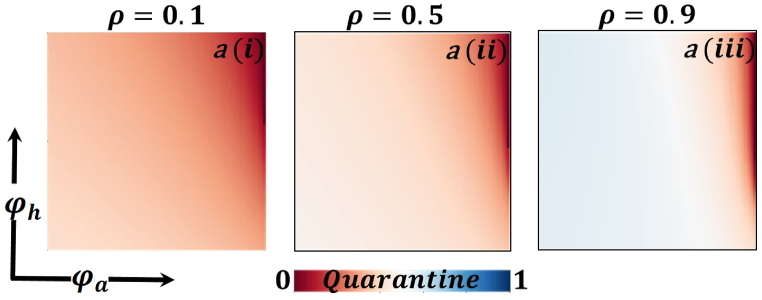
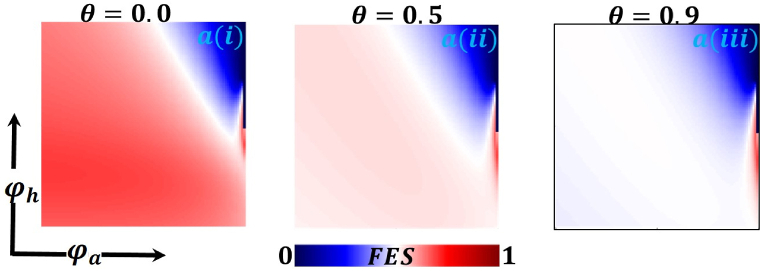
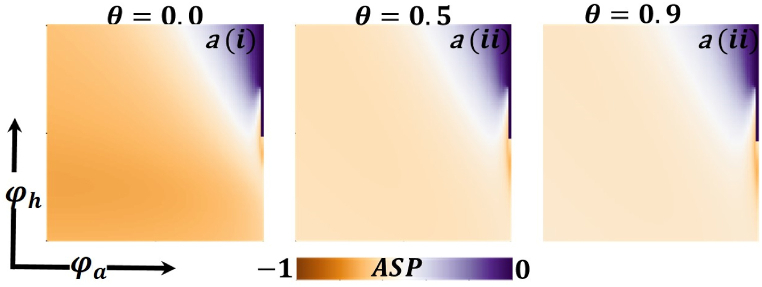
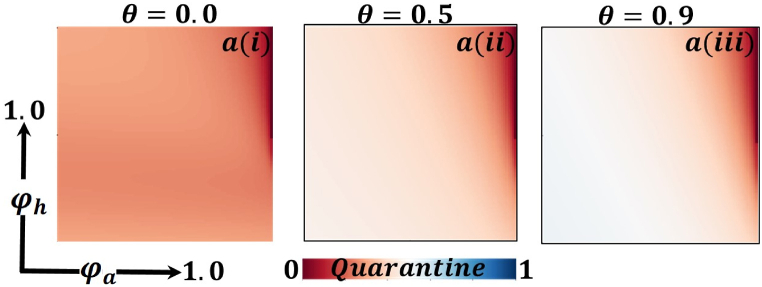
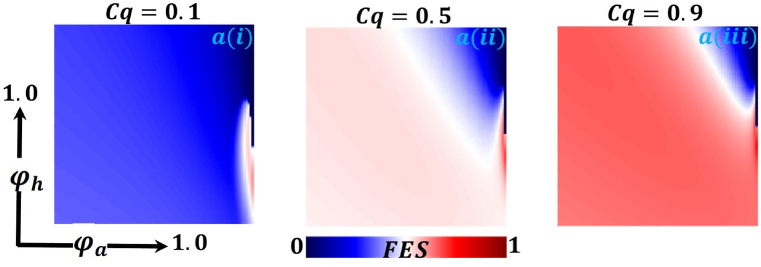
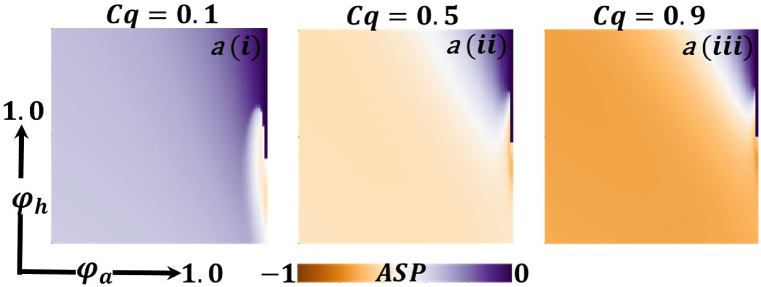
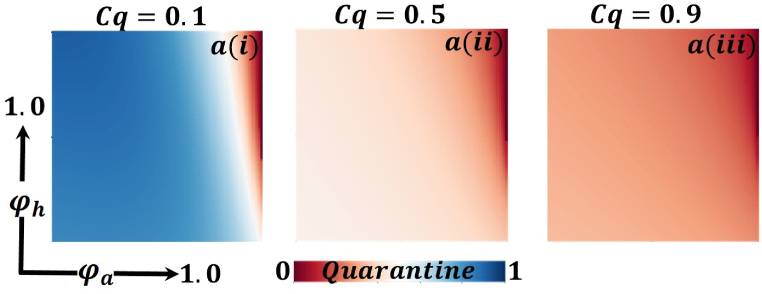
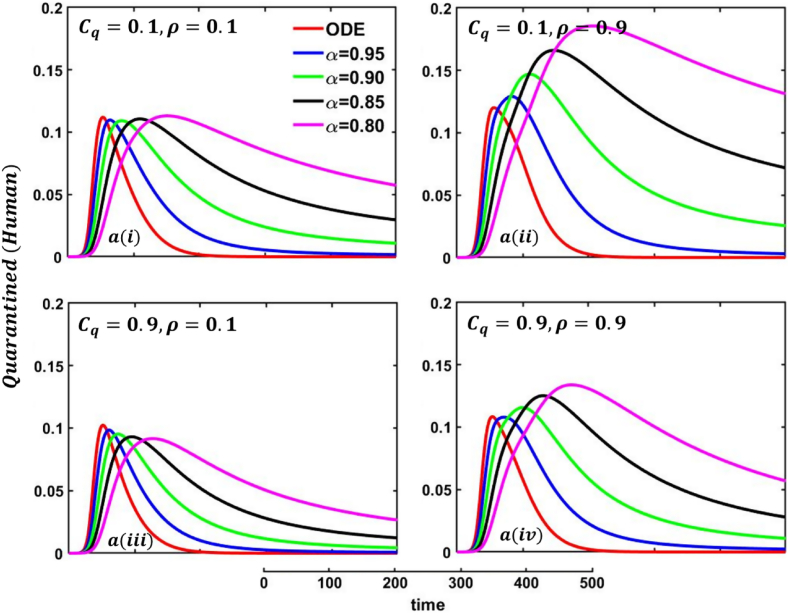
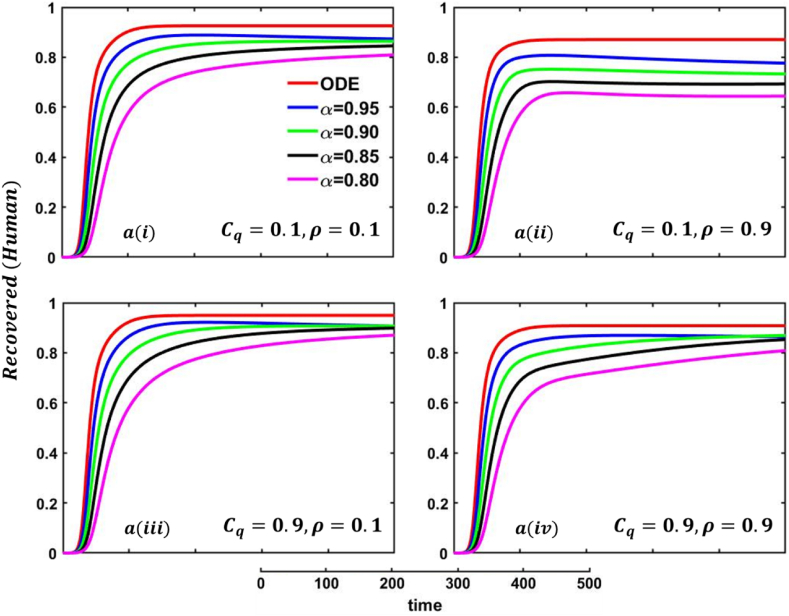
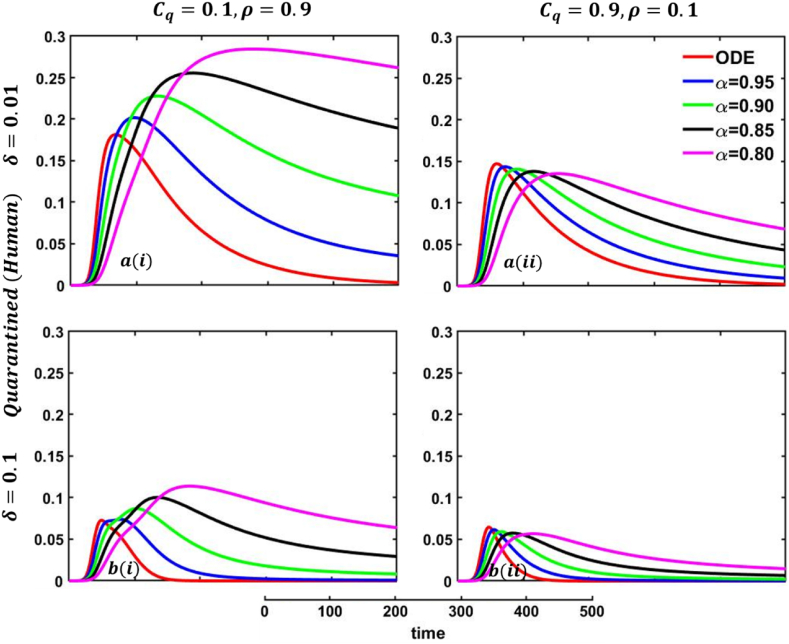
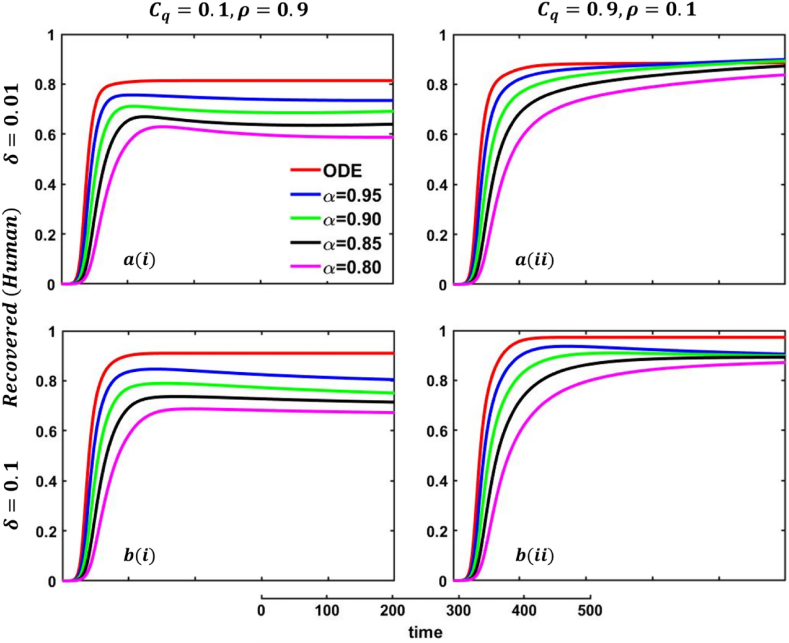
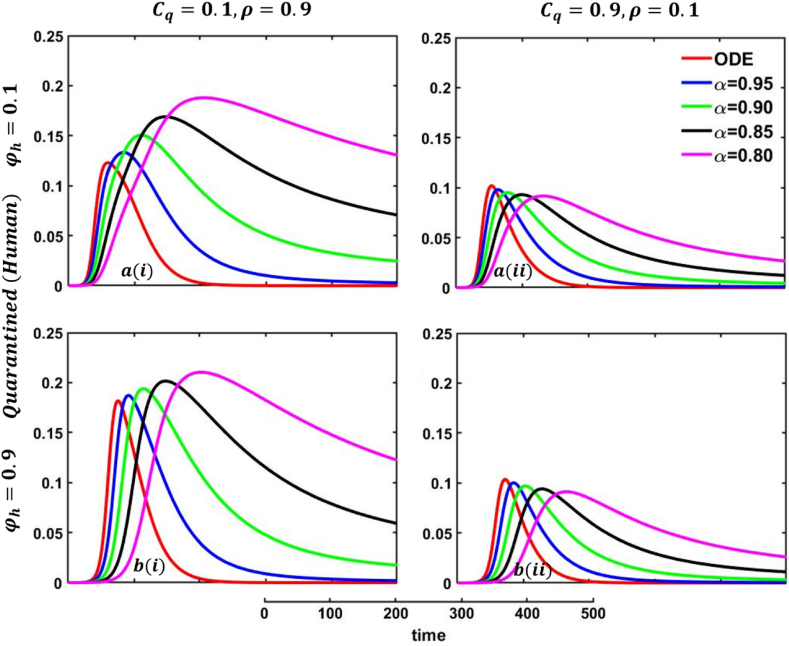
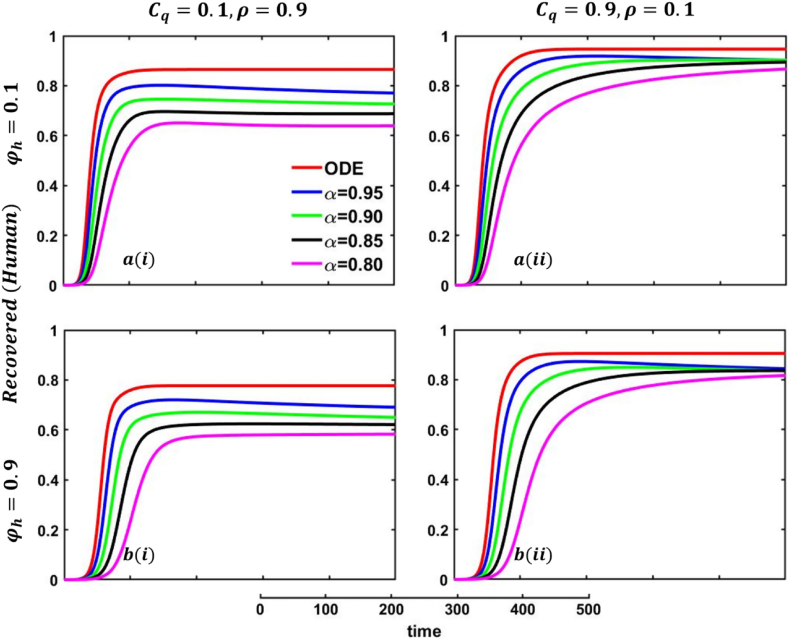
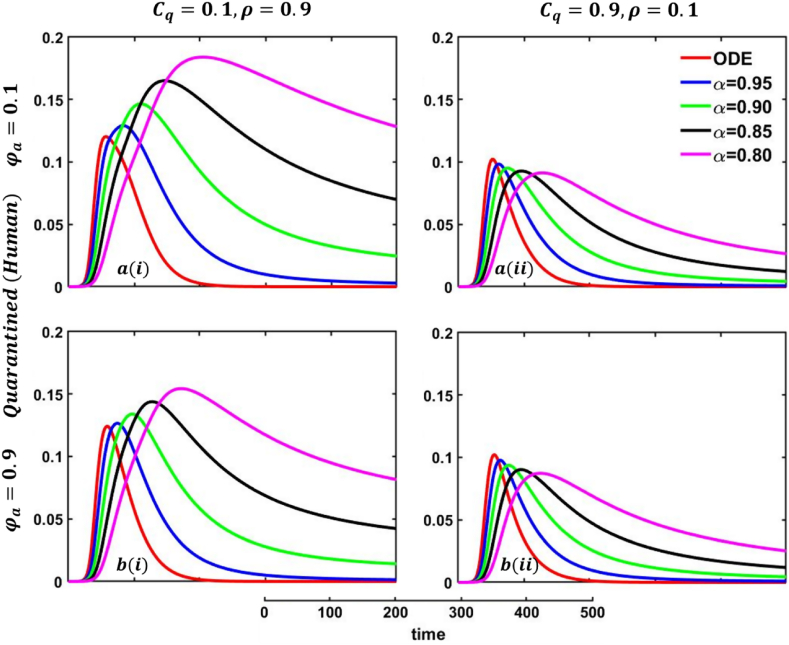
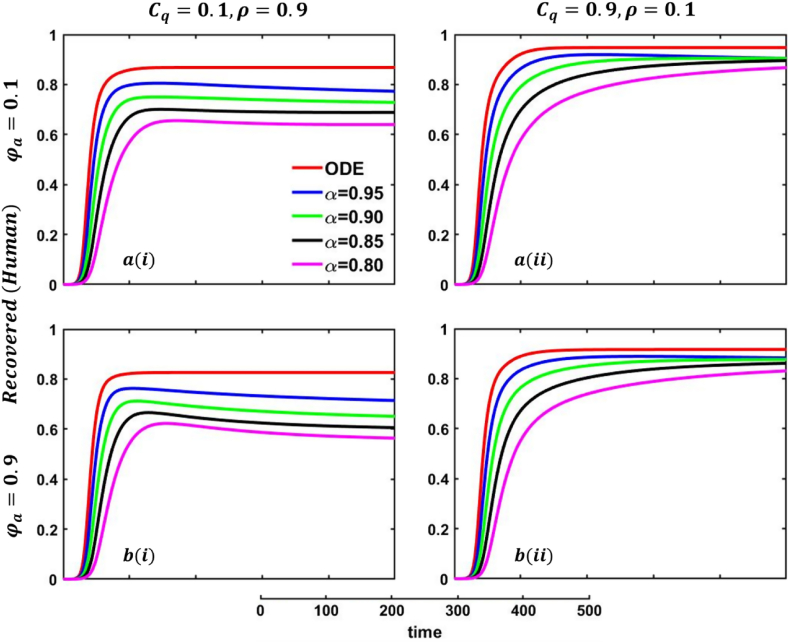
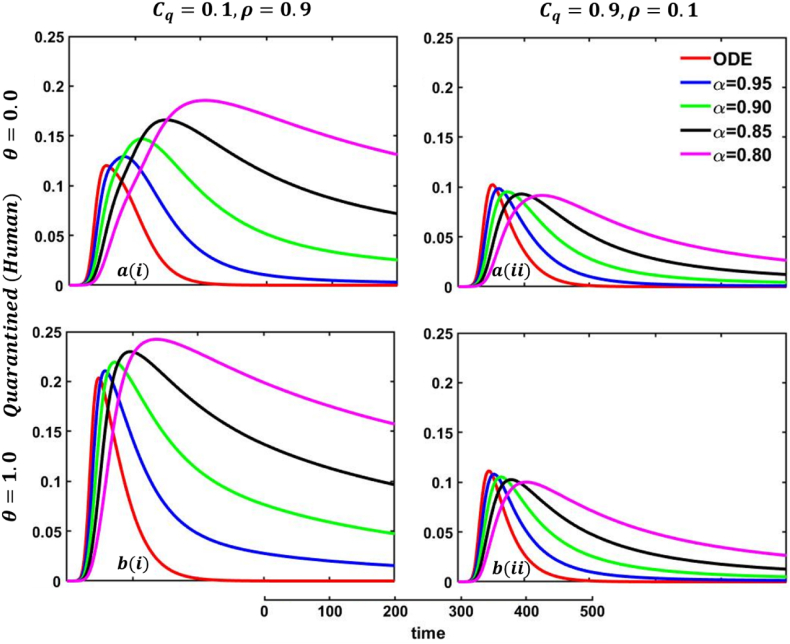
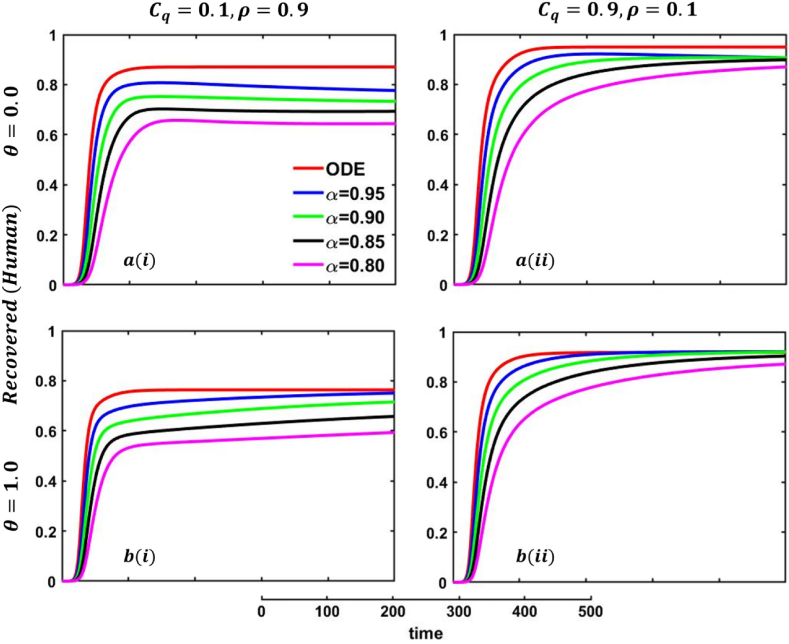
This work concerns the epidemiology of infectious diseases like monkeypox (mpox) in humans and animals. Our models examine transmission scenarios, including transmission dynamics between humans, animals, and both. We approach this using evolutionary game theory, specifically the intervention game-theoretical (IGT) framework, to study how human behavior can mitigate disease transmission without perfect vaccines and treatments. To do this, we use non-pharmaceutical intervention, namely the quarantine policy, which demonstrates the delayed effect of the epidemic. Additionally, we contemplate quarantine-based behavioral intervention policies in deterministic and fractional-order models to show behavioral impact in the context of the memory effect. Firstly, we extensively analyzed the model's positivity and boundness of the solution, reproduction number, disease-free and endemic equilibrium, possible stability, existence, concavity, and Ulam-Hyers stability for the fractional order. Subsequently, we proceeded to present a numerical analysis that effectively illustrates the repercussions of varying quarantine-related factors, information probability, and protection probability. We aimed to comprehensively examine the effects of non-pharmaceutical interventions on disease control, which we conveyed through line graphs and 2D heat maps. Our findings underscored the significant influence of strict quarantine measures and the protection of both humans and animals in mitigating disease outbreaks. These measures not only significantly curtailed the spread of the disease but also delayed the occurrence of the epidemic's peak. Conversely, when quarantine maintenance policies were implemented at lower rates and protection levels diminished, we observed contrasting outcomes that exacerbated the situation. Eventually, our analysis revealed the emergence of animal reservoirs in cases involving disease transmission between humans and animals.

Keywords: Fractional order; Information; Monkeypox; Protection; Quarantine game.


Conflict of interest statement

The authors declare that they have no known competing financial interests or personal relationships that could have appeared to influence the work reported in this paper.

Figures

Fig. 1
Fig. 1
Illustration depicting the suggested epidemic model: In our suggested model, denoted as ShEhI_hQhRhSaEaIaRa, susceptible humans (Sh) are infected with a disease transmission rate βhh. The black arrows represent the transmission of the state from susceptible (Sh) to exposed humans (Eh) due to interaction with sick persons. Once individuals are exposed (Eh) after being susceptible (Sh), a portion of them get infected with a progression rate of α(1q) and instantly transition to an infected state (Ih). The proportion of persons still asymptomatic and have not been identified is captured by the quarantine rate αq and, after that, put in the compartment (Qh). Persons who carry diseases are classified as infected humans (Ih). Some infected persons may be forcibly transferred to the compartment (Qh) at a q rate. The susceptibility of persons brought to the compartment (Qh) implementing quarantine or self-isolation regulations is determined by the rate δ. Once an individual has recovered (Rh), they are excluded from further consideration within the local timeline of the progressing pandemic. The situation for animal patches is similar, except for the quarantine policy.
Fig. 2
Fig. 2
Presented the effect of (a*) Quarantine or self-isolation period, δ=0.04,0.06,0.1,0.2,(b*) protection rate against infected humans, φh=0.0,0.5,0.9,(c*) protection rate against infected animals, φa=0.0,0.5,0.9,(d*) the transmission rate of human to animal, θ=0.0,0.5,1.0 on the infected (human), quarantined (human), recovered (human) individuals, and infected animals. In the general case, the parameter setting is βhh=1.0,βaa=0.5,φh=φa=0.0,αh=αa=0.2,γh=γa=0.1,δ=0.06,θ=0.0..
Fig. 3
Fig. 3
Presented the effect of δ=0.04,0.06,0.1,0.2 on the infected (human), quarantined (human), recovered (human) individuals, and infected animals. Subpanels a(i),a(ii),a(iii), and a(iv) show the results under the quarantine cost and disease information probability (Cq,ρ)=(0.1,0.1)(0.1,0.9),(0.9,0.1) and (0.9,0.9), respectively, whereas the remaining parameter settings are βhh=1.0,βaa=0.5,φh=φa=0.0,αh=αa=0.2,γh=γa=0.1,θ=0.0..
Fig. 4
Fig. 4
Presented the effect of φh=0.0,0.5,0.9 on the infected (human), quarantined (human), recovered (human) individuals, and infected animals. Subpanels b(i),b(ii),b(iii), and b(iv) show the results under the quarantine cost and disease information probability (Cq,ρ)=(0.1,0.1)(0.1,0.9),(0.9,0.1) and (0.9,0.9), respectively, whereas the remaining parameter settings are βhh=1.0,βaa=0.5,φa=0.0,αh=αa=0.2,γh=γa=0.1,θ=0.0,δ=0.06..
Fig. 5
Fig. 5
Presented the effect of φa=0.0,0.5,0.9 on the infected (human), quarantined (human), recovered (human) individuals, and infected animals. Subpanels c(i),c(ii),c(iii), and c(iv) show the results under the quarantine cost and disease information probability (Cq,ρ)=(0.1,0.1)(0.1,0.9),(0.9,0.1) and (0.9,0.9), respectively, whereas the remaining parameters setting are βhh=1.0,βaa=0.5,φh=0.0,αh=αa=0.2,γh=γa=0.1,θ=0.0,δ=0.06..
Fig. 6
Fig. 6
Presented the effect of θ=0.0,0.5,1.0 on the infected (human), quarantined (human), recovered (human) individuals, and infected animals. Subpanels d(i),d(ii),d(iii), and d(iv) show the results under the quarantine cost and disease information probability (Cq,ρ)=(0.1,0.1)(0.1,0.9),(0.9,0.1) and (0.9,0.9), respectively, whereas the remaining parameter settings are βhh=1.0,βaa=0.5,φh=φa=0.0,αh=αa=0.2,γh=γa=0.1,δ=0.06..
Fig. 7
Fig. 7
Presented the 2D heat maps of final epidemic size (FES) concerning the quarantine or self-isolation cost (Cq) and human-to-human-transmission rate (βhh). Subpanels (a*), (b*), and (c*) show the effect of quarantine or self-isolation period (δ=0.0,0.05and0.1), whereas (*-i), (*-ii), (*-iii) represents the information probability of the infected animal (ρ=0.1,0.5and0.9), respectively. The remaining parameter settings are βaa=0.5,φh=φa=0.5,αh=0.2,αa=0.1,γh=γa=0.2,θ=0.5.
Fig. 8
Fig. 8
Presented the 2D heat maps of the average social payoff (ASP) concerning the quarantine or self-isolation cost (Cq) and human-to-human-transmission rate (βhh). Subpanels (a*), (b*), and (c*) show the effect of quarantine or self-isolation period (δ=0.0,0.05and0.1), whereas (*-i), (*-ii), (*-iii) represents the information probability of the infected animal (ρ=0.1,0.5and0.9), respectively. The remaining parameter settings are βaa=0.5,φh=φa=0.5,αh=0.2,αa=0.1,γh=γa=0.2,θ=0.5.
Fig. 9
Fig. 9
Presented the 2D heat maps of quarantine effect concerning the quarantine or self-isolation cost (Cq) and human-to-human-transmission rate (βhh). Subpanels (a*), (b*), and (c*) show the effect of quarantine or self-isolation period (δ=0.0,0.05and0.1), whereas (*-i), (*-ii), (*-iii) represents the information probability of the infected animal (ρ=0.1,0.5and0.9), respectively. The remaining parameter settings are βaa=0.5,φh=φa=0.5,αh=0.2,αa=0.1,γh=γa=0.2,θ=0.5.
Fig. 10
Fig. 10
Presented the 2D heat maps of final epidemic size (FES) concerning the protection rate of infected animals (φa) and the protection rate of infected humans (φh). Subpanels a* show show the effect of the information probability of the infected animal (ρ=0.1,0.5and0.9), respectively. The remaining parameter settings are βhh=0.8333,βaa=0.5,Cq=0.5,αh=0.2,αa=0.1,γh=γa=0.2,θ=0.5.
Fig. 11
Fig. 11
Presented the 2D heat maps of the average social payoff (ASP) concerning the protection rate of infected animals (φa) and the protection rate of infected humans (φh). Subpanels a* show the effect of the information probability of the infected animal (ρ=0.1,0.5and0.9), respectively. The remaining parameter settings are βhh=0.8333,βaa=0.5,Cq=0.5,αh=0.2,αa=0.1,γh=γa=0.2,θ=0.5.
Fig. 12
Fig. 12
Presented the 2D heat maps of the quarantine effect concerning the protection rate of infected animals (φa) and the protection rate of infected humans (φh). Subpanels a* show the effect of information probability of the infected animal (ρ=0.1,0.5and0.9), respectively. The remaining parameter settings are βhh=0.8333,βaa=0.5,Cq=0.5,αh=0.2,αa=0.1,γh=γa=0.2,θ=0.5.
Fig. 13
Fig. 13
Presented the 2D heat maps of final epidemic size (FES) concerning the protection rate of infected animals (φa) and the protection rate of infected humans (φh). Subpanels a* show the effect of the human-to-animal transmission rate (θ=0.0,0.5and0.9), respectively. The remaining parameter settings are βhh=0.8333,βaa=0.5,Cq=0.5,αh=0.2,αa=0.1,γh=γa=0.2,ρ=0.9.
Fig. 14
Fig. 14
Presented the 2D heat maps of the average social payoff (ASP) concerning the protection rate of infected animals (φa) and the protection rate of infected humans (φh). Subpanels a* show the effect of the human-to-animal transmission rate (θ=0.0,0.5and0.9), respectively. The remaining parameters setting are βhh=0.8333,βaa=0.5,Cq=0.5,αh=0.2,αa=0.1,γh=γa=0.2,ρ=0.9.
Fig. 15
Fig. 15
Presented the 2D heat maps of the quarantine effect concerning the protection rate of infected animals (φa) and the protection rate of infected humans (φh). Subpanels a* show the effect of the human-to-animal transmission rate (θ=0.0,0.5and0.9), respectively. The remaining parameter settings are βhh=0.8333,βaa=0.5,Cq=0.5,αh=0.2,αa=0.1,γh=γa=0.2,ρ=0.9.
Fig. 16
Fig. 16
Presented the 2D heat maps of final epidemic size (FES) concerning the protection rate of infected animals (φa) and the protection rate of infected humans (φh). Subpanels a* show the effect of quarantine cost (Cq=0.1,0.5and0.9), respectively. The remaining parameter settings are βhh=0.8333,βaa=0.5,θ=0.5,αh=0.2,αa=0.1,γh=γa=0.2,ρ=0.9.
Fig. 17
Fig. 17
Presented the 2D heat maps of average social payoff (ASP) concerning the protection rate of infected animals (φa) and the protection rate of infected humans (φh). Subpanels a* show the effect of quarantine cost (Cq=0.1,0.5and0.9), respectively. The remaining parameter settings are βhh=0.8333,βaa=0.5,θ=0.5,αh=0.2,αa=0.1,γh=γa=0.2,ρ=0.9.
Fig. 18
Fig. 18
Presented the 2D heat maps of the quarantine effect concerning the protection rate of infected animals (φa) and the protection rate of infected humans (φh). Subpanels a* show the effect of quarantine cost (Cq=0.1,0.5and0.9), respectively. The remaining parameter settings are βhh=0.8333,βaa=0.5,θ=0.5,αh=0.2,αa=0.1,γh=γa=0.2,ρ=0.9.
Fig. 19
Fig. 19
Explored the impact of altering the fractional-order α=1.0,0.95,0.9,0.85,0.8 on the quarantined (human) individuals. Subpanels a(i),a(ii),a(iii), and a(iv) show the results under the quarantine cost and disease information probability (Cq,ρ)=(0.1,0.1)(0.1,0.9),(0.9,0.1) and (0.9,0.9), respectively, whereas the remaining parameter settings are βhh=1.0,βaa=0.5,φh=φa=0.0,αh=αa=0.2,γh=γa=0.1,δ=0.04,θ=0.0.
Fig. 20
Fig. 20
Explored the impact of altering the fractional-order α=1.0,0.95,0.9,0.85,0.8 on the recovered (human) individuals. Subpanels a(i),a(ii),a(iii), and a(iv) show the results under the quarantine cost and disease information probability (Cq,ρ)=(0.1,0.1)(0.1,0.9),(0.9,0.1) and (0.9,0.9), respectively, whereas the remaining parameter settings are βhh=1.0,βaa=0.5,φh=φa=0.0,αh=αa=0.2,γh=γa=0.1,δ=0.04,θ=0.0.
Fig. 21
Fig. 21
Explored the impact of altering the fractional-order α=1.0,0.95,0.9,0.85,0.8 on the quarantined (human) individuals. Subpanels (*-i) and (*-ii) show the results under the quarantine cost and disease information probability (Cq,ρ)=(0.1,0.9) and (0.9,0.1). Subpanels (a*) and (b*) show the results under the quarantine period δ=0.01 and 0.1, respectively, whereas the remaining parameters settings are βhh=1.0,βaa=0.5,φa=φh=0.0,αh=αa=0.2,γh=γa=0.1,θ=0.0.
Fig. 22
Fig. 22
Explored the impact of altering the fractional-order α=1.0,0.95,0.9,0.85,0.8 on the recovered (human) individuals. Subpanels (*-i) and (*-ii) show the results under the quarantine cost and disease information probability (Cq,ρ)=(0.1,0.9) and (0.9,0.1). Subpanels (a*) and (b*) show the results under the quarantine period δ=0.01 and 0.1, respectively, whereas the remaining parameters settings are βhh=1.0,βaa=0.5,φa=φh=0.0,αh=αa=0.2,γh=γa=0.1,θ=0.0.
Fig. 23
Fig. 23
Explored the impact of altering the fractional-order α=1.0,0.95,0.9,0.85,0.8 on the quarantined (human) individuals. Subpanels (*-i) and (*-ii) show the results under the quarantine cost and disease information probability (Cq,ρ)=(0.1,0.9) and (0.9,0.1). Subpanels (a*) and (b*) show the results under the protection rate against infected human φh=0.1 and 0.9, respectively, whereas the remaining parameter settings are βhh=1.0,βaa=0.5,φa=0.0,αh=αa=0.2,γh=γa=0.1,δ=0.04,θ=0.0.
Fig. 24
Fig. 24
Explored the impact of altering the fractional-order α=1.0,0.95,0.9,0.85,0.8 on the recovered (human) individuals. Subpanels (*-i) and (*-ii) show the results under the quarantine cost and disease information probability (Cq,ρ)=(0.1,0.9) and (0.9,0.1). Subpanels (a*) and (b*) show the results under the protection rate against infected human φh=0.1 and 0.9, respectively, whereas the remaining parameter settings are βhh=1.0,βaa=0.5,φa=0.0,αh=αa=0.2,γh=γa=0.1,δ=0.04,θ=0.0.
Fig. 25
Fig. 25
Explored the impact of altering the fractional-order α=1.0,0.95,0.9,0.85,0.8 on the quarantined (human) individuals. Subpanels (*-i) and (*-ii) show the results under the quarantine cost and disease information probability (Cq,ρ)=(0.1,0.9) and (0.9,0.1). Subpanels (a*) and (b*) show the results under the protection rate against infected animal φa=0.1 and 0.9, respectively, whereas the remaining parameter settings are βhh=1.0,βaa=0.5,φh=0.0,αh=αa=0.2,γh=γa=0.1,δ=0.04,θ=0.0.
Fig. 26
Fig. 26
Explored the impact of altering the fractional-order α=1.0,0.95,0.9,0.85,0.8 on the recovered (human) individuals. Subpanels (*-i) and (*-ii) show the results under the quarantine cost and disease information probability (Cq,ρ)=(0.1,0.9) and (0.9,0.1). Subpanels (a*) and (b*) show the results under the protection rate against infected animal φa=0.1 and 0.9, respectively, whereas the remaining parameter settings are βhh=1.0,βaa=0.5,φh=0.0,αh=αa=0.2,γh=γa=0.1,δ=0.04,θ=0.0.
Fig. 27
Fig. 27
Explored the impact of altering the fractional-order α=1.0,0.95,0.9,0.85,0.8 on the quarantined (human) individuals. Subpanels (*-i) and (*-ii) show the results under the quarantine cost and disease information probability (Cq,ρ)=(0.1,0.9) and (0.9,0.1). Subpanels (a*) and (b*) show the results under the human-to-animal transmission rate θ=0.0 and 1.0, respectively, whereas the remaining parameter settings are βhh=1.0,βaa=0.5,φh=φa=0.0,αh=αa=0.2,γh=γa=0.1,δ=0.04.
Fig. 28
Fig. 28
Explored the impact of altering the fractional-order α=1.0,0.95,0.9,0.85,0.8 on the recovered (human) individuals. Subpanels (*-i) and (*-ii) show the results under the quarantine cost and disease information probability (Cq,ρ)=(0.1,0.9) and (0.9,0.1). Subpanels (a*) and (b*) show the results under the human-to-animal transmission rate θ=0.0 and 1.0, respectively, whereas the remaining parameter settings are βhh=1.0,βaa=0.5,φh=φa=0.0,αh=αa=0.2,γh=γa=0.1,δ=0.04.

Similar articles

Cited by

References

    1. Monkeypox, https://www.cdc.gov/poxvirus/monkeypox/about/index.html.
    1. Monkeypox, https://www.who.int/health-topics/monkeypox#tab=tab_1.
    1. Centers for Disease Control and Prevention . Division of High-Consequence Pathogens and Pathology (DHCPP) 2021. National center for emerging and zoonotic infectious diseases(NCEZID)https://www.cdc.gov/poxvirus/monkeypox/index.html Monkeypox.
    1. Durski K.N., McCollum A.M., Nakazawa Y., Petersen B.W., Reynolds M.G., Briand S., Djingarey M.H., Olson V., Damon I.K., Khalakdina A. 2018. Emergence of Monkeypox West and Central Africa, 1970-2017 Morbidity and Mortality Weekly Report 67 306. - PMC - PubMed
    1. Jeźek Z., Szczeniowski M., Paluku K.M., Mutombo M., Grab B. Human monkeypox: confusion with chickenpox. PubMed. 1988;45(4):297–307. https://pubmed.ncbi.nlm.nih.gov/2907258 - PubMed

LinkOut - more resources