

Models and data used to predict the abundance and distribution of Ixodes scapularis (blacklegged tick) in North America: a scoping review
- PMID: 38495312
- PMCID: PMC10943480
- DOI: 10.1016/j.lana.2024.100706
Models and data used to predict the abundance and distribution of Ixodes scapularis (blacklegged tick) in North America: a scoping review
Abstract
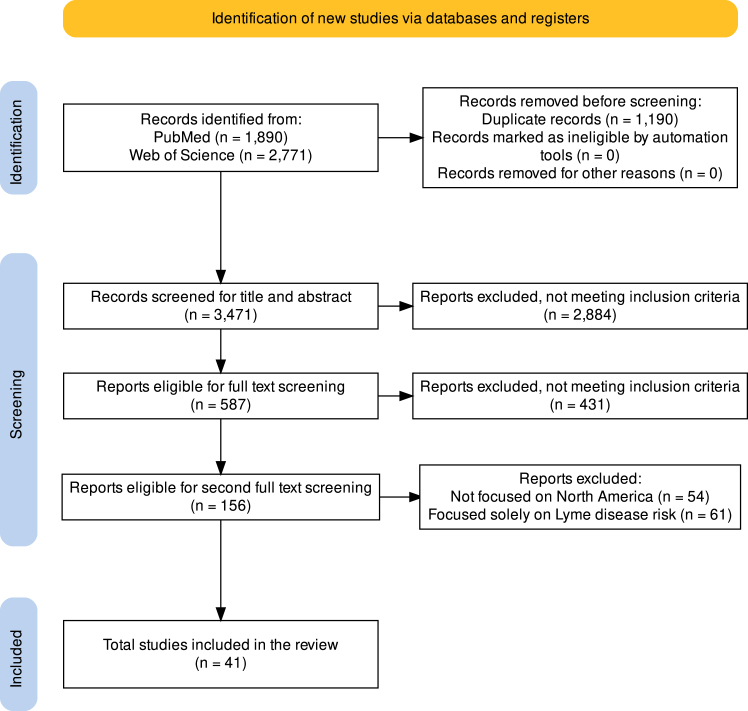
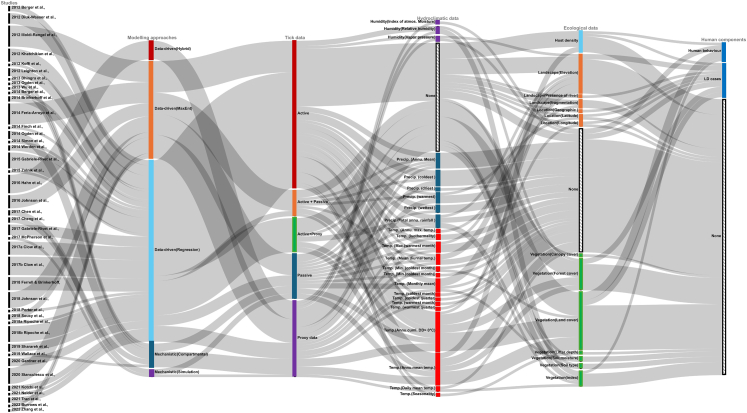
Tick-borne diseases (TBD) remain prevalent worldwide, and risk assessment of tick habitat suitability is crucial to prevent or reduce their burden. This scoping review provides a comprehensive survey of models and data used to predict I. scapularis distribution and abundance in North America. We identified 4661 relevant primary research articles published in English between January 1st, 2012, and July 18th, 2022, and selected 41 articles following full-text review. Models used data-driven and mechanistic modelling frameworks informed by diverse tick, hydroclimatic, and ecological variables. Predictions captured tick abundance (n = 14, 34.1%), distribution (n = 22, 53.6%) and both (n = 5, 12.1%). All studies used tick data, and many incorporated both hydroclimatic and ecological variables. Minimal host- and human-specific data were utilized. Biases related to data collection, protocols, and tick data quality affect completeness and representativeness of prediction models. Further research and collaboration are needed to improve prediction accuracy and develop effective strategies to reduce TBD.
Keywords: Data-driven; Ixodes scapularis; Mathematical; Mechanistic; Models; North America; Ticks.
© 2024 The Author(s).
Conflict of interest statement
The authors declare no competing interests.
Figures


Similar articles
-
Mechanistic movement models to predict geographic range expansions of ticks and tick-borne pathogens: Case studies with Ixodes scapularis and Amblyomma americanum in eastern North America.Ticks Tick Borne Dis. 2023 Jul;14(4):102161. doi: 10.1016/j.ttbdis.2023.102161. Epub 2023 Mar 28. Ticks Tick Borne Dis. 2023. PMID: 36996508
-
Species distribution models for the eastern blacklegged tick, Ixodes scapularis, and the Lyme disease pathogen, Borrelia burgdorferi, in Ontario, Canada.PLoS One. 2020 Sep 11;15(9):e0238126. doi: 10.1371/journal.pone.0238126. eCollection 2020. PLoS One. 2020. PMID: 32915794 Free PMC article.
-
Phylogeographic dynamics of the arthropod vector, the blacklegged tick (Ixodes scapularis).Parasit Vectors. 2022 Jun 28;15(1):238. doi: 10.1186/s13071-022-05304-9. Parasit Vectors. 2022. PMID: 35765050 Free PMC article.
-
Detection, characterization, and prediction of tick-borne disease foci.Int J Med Microbiol. 2002 Jun;291 Suppl 33:11-20. doi: 10.1016/s1438-4221(02)80003-0. Int J Med Microbiol. 2002. PMID: 12141734 Review.
-
Borrelia burgdorferi sensu lato prevalence in Ixodes scapularis from Canada: A thirty-year summary and meta-analysis (1990-2020).Acta Trop. 2024 Aug;256:107268. doi: 10.1016/j.actatropica.2024.107268. Epub 2024 May 22. Acta Trop. 2024. PMID: 38782109 Review.
Cited by
-
Estimating the density of questing Ixodes scapularis nymphs in the eastern United States using climate and land cover data.Ticks Tick Borne Dis. 2025 Mar;16(2):102446. doi: 10.1016/j.ttbdis.2025.102446. Epub 2025 Mar 8. Ticks Tick Borne Dis. 2025. PMID: 40057413
-
Understanding climate-sensitive tick development and diapause with a structured population model.Front Vet Sci. 2025 Apr 2;12:1553557. doi: 10.3389/fvets.2025.1553557. eCollection 2025. Front Vet Sci. 2025. PMID: 40241804 Free PMC article.
References
-
- Kim D., Maxwell S., Le Q. Spatial and temporal comparison of perceived risks and confirmed cases of lyme disease: an exploratory study of google trends. Front Public Health. 2020;8:395. https://www.ncbi.nlm.nih.gov/pmc/articles/PMC7456861/ [cited 2022 Aug 22] Available from: - PMC - PubMed
-
- Ogden N.H., Pang G., Ginsberg H.S., et al. Evidence for geographic variation in life-cycle processes affecting phenology of the lyme disease vector Ixodes scapularis (Acari: Ixodidae) in the United States. J Med Entomol. 2018;55(6):1386–1401. - PubMed
Publication types
LinkOut - more resources
Full Text Sources
