

Establishment and analysis of artificial neural network diagnosis model for coagulation-related molecular subgroups in coronary artery disease
- PMID: 38495669
- PMCID: PMC10941628
- DOI: 10.3389/fgene.2024.1351774
Establishment and analysis of artificial neural network diagnosis model for coagulation-related molecular subgroups in coronary artery disease
Abstract
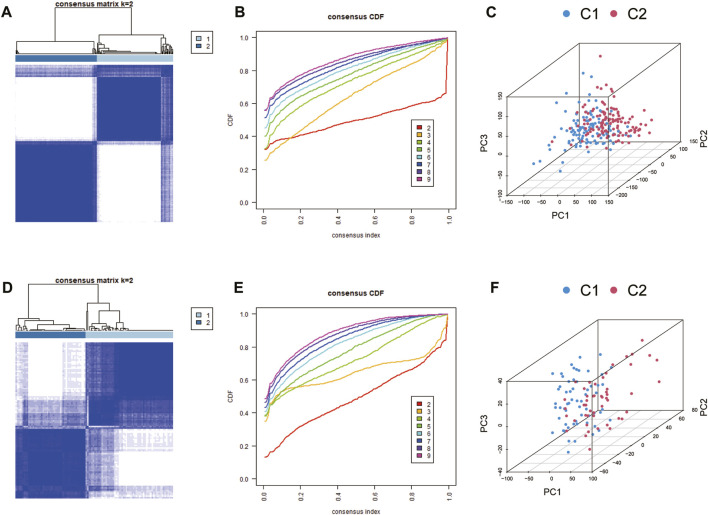
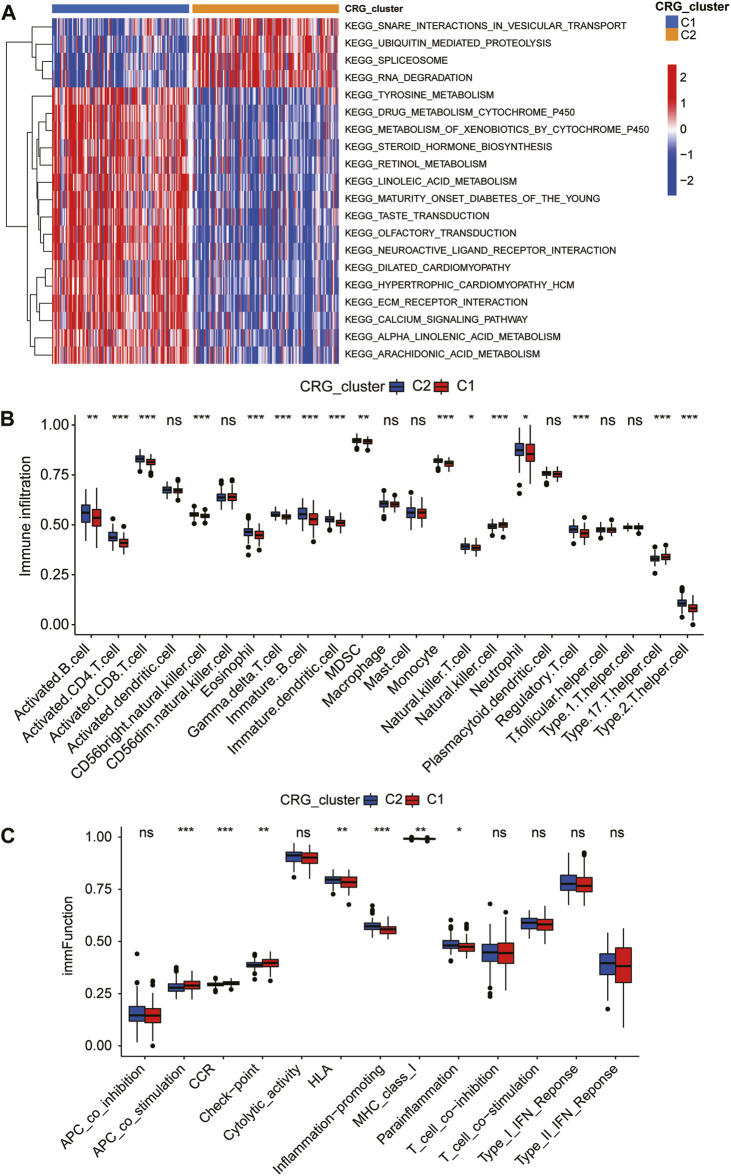
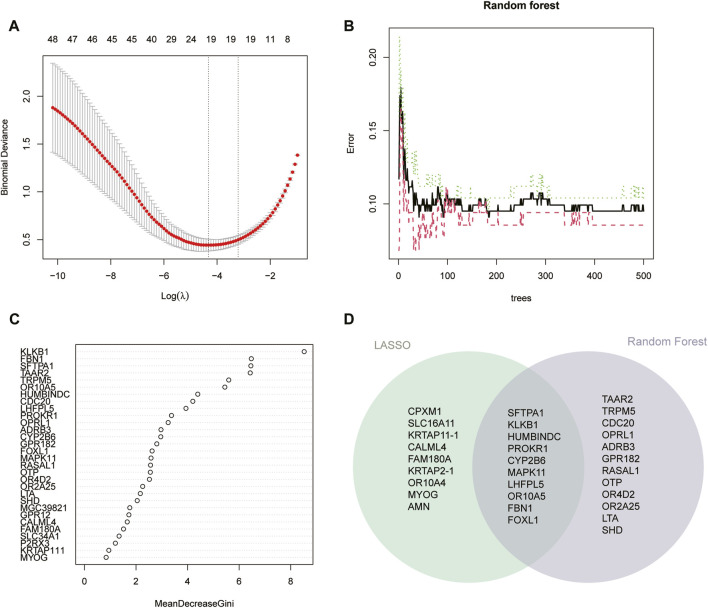
Background: Coronary artery disease (CAD) is the most common type of cardiovascular disease and cause significant morbidity and mortality. Abnormal coagulation cascade is one of the high-risk factors in CAD patients, but the molecular mechanism of coagulation in CAD is still limited. Methods: We clustered and categorized 352 CAD paitents based on the expression patterns of coagulation-related genes (CRGs), and then we explored the molecular and immunological variations across the subgroups to reveal the underlying biological characteristics of CAD patients. The feature genes between CRG-subgroups were further identified using a random forest model (RF) and least absolute shrinkage and selection operator (LASSO) regression, and an artificial neural network prediction model was constructed. Results: CAD patients could be divided into the C1 and C2 CRG-subgroups, with the C1 subgroup highly enriched in immune-related signaling pathways. The differential expressed genes between the two CRG-subgroups (DE-CRGs) were primarily enriched in signaling pathways connected to signal transduction and energy metabolism. Subsequently, 10 feature DE-CRGs were identified by RF and LASSO. We constructed a novel artificial neural network model using these 10 genes and evaluated and validated its diagnostic performance on a public dataset. Conclusion: Diverse molecular subgroups of CAD patients may each have a unique gene expression pattern. We may identify subgroups using a few feature genes, providing a theoretical basis for the precise treatment of CAD patients with different molecular subgroups.
Keywords: LASSO; artificial neural networks; coagulation; coronary artery disease; random forest.
Copyright © 2024 Zheng, Li and Xiong.
Conflict of interest statement
The authors declare that the research was conducted in the absence of any commercial or financial relationships that could be construed as a potential conflict of interest.
Figures


Similar articles
-
Identification of cuproptosis-related subtypes, construction of a prognosis model, and tumor microenvironment landscape in gastric cancer.Front Immunol. 2022 Nov 21;13:1056932. doi: 10.3389/fimmu.2022.1056932. eCollection 2022. Front Immunol. 2022. PMID: 36479114 Free PMC article.
-
Cuproptosis-related risk score predicts prognosis and characterizes the tumor microenvironment in colon adenocarcinoma.Front Oncol. 2023 Jun 2;13:1152681. doi: 10.3389/fonc.2023.1152681. eCollection 2023. Front Oncol. 2023. PMID: 37333810 Free PMC article.
-
Immune-related potential biomarkers and therapeutic targets in coronary artery disease.Front Cardiovasc Med. 2023 Jan 6;9:1055422. doi: 10.3389/fcvm.2022.1055422. eCollection 2022. Front Cardiovasc Med. 2023. PMID: 36684561 Free PMC article.
-
Identification of Potential Biomarkers for Coronary Artery Disease Based on Cuproptosis.Cardiovasc Ther. 2023 Jan 25;2023:5996144. doi: 10.1155/2023/5996144. eCollection 2023. Cardiovasc Ther. 2023. PMID: 36743388 Free PMC article.
-
Identification of a novel cuproptosis-related gene signature and integrative analyses in patients with lower-grade gliomas.Front Immunol. 2022 Aug 15;13:933973. doi: 10.3389/fimmu.2022.933973. eCollection 2022. Front Immunol. 2022. PMID: 36045691 Free PMC article. Review.
References
-
- Agosti P., Mancini I., Sadeghian S., Pagliari M. T., Abbasi S. H., Pourhosseini H., et al. (2023). Factor V Leiden but not the factor II 20210G>A mutation is a risk factor for premature coronary artery disease: a case-control study in Iran. Res. Pract. thrombosis haemostasis 7, 100048. 10.1016/j.rpth.2023.100048 - DOI - PMC - PubMed
LinkOut - more resources
Full Text Sources
Miscellaneous