. 2024 Feb 28;15(3):1943-1958.
doi: 10.1364/BOE.515469. eCollection 2024 Mar 1.

Next-generation endoscopic probe for detection of esophageal dysplasia using combined OCT and angle-resolved low-coherence interferometry

Affiliations

Next-generation endoscopic probe for detection of esophageal dysplasia using combined OCT and angle-resolved low-coherence interferometry

Evan T Jelly et al. Biomed Opt Express. .

Abstract

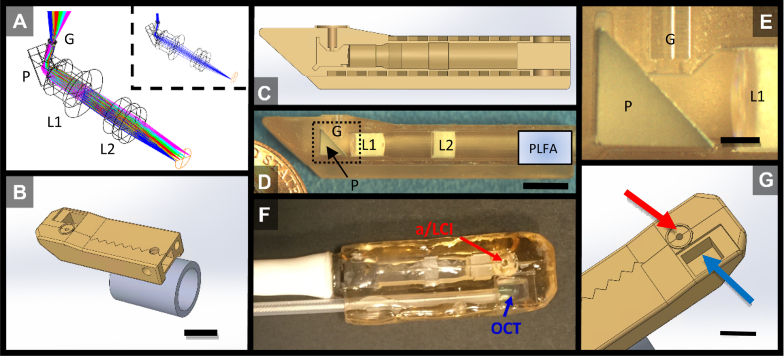
Angle-resolved low-coherence interferometry (a/LCI) is an optical technique that enables depth-specific measurements of nuclear morphology, with applications to detecting epithelial cancers in various organs. Previous a/LCI setups have been limited by costly fiber-optic components and large footprints. Here, we present a novel a/LCI instrument incorporating a channel for optical coherence tomography (OCT) to provide real-time image guidance. We showcase the system's capabilities by acquiring imaging data from in vivo Barrett's esophagus patients. The main innovation in this geometry lies in implementing a pathlength-matched single-mode fiber array, offering substantial cost savings while preserving signal fidelity. A further innovation is the introduction of a specialized side-viewing probe tailored for esophageal imaging, featuring miniature optics housed in a custom 3D-printed enclosure attached to the tip of the endoscope. The integration of OCT guidance enhances the precision of tissue targeting by providing real-time morphology imaging. This novel device represents a significant advancement in clinical translation of an enhanced screening approach for esophageal precancer, paving the way for more effective early-stage detection and intervention strategies.


Conflict of interest statement

A.W. is founder and president of Lumedica Vision.

Figures

Fig. 1.
Fig. 1.
Construction of the PLFA. (A) Ferrule and associated fibers before application of UV epoxy. Scale bar = 10 mm(b) Closeup of the ferrule showing insertion of the fibers. (c) En face image of the ferrule, showing fiber packing. Scale bar = 5 mm The two distal elements are polarization-maintaining (PM) fibers, oriented so that the slow axis is aligned with with the fiber axis. Scale bar = 0.5 mm
Fig. 2.
Fig. 2.
Assembly of the multichannel a/LCI-OCT probe body in a dual-modality paddle housing both a/LCI and rotational OCT components. (A) Lens types and spacings were optimized in Zemax OpticStudio (Zemax, LLC), including prism P, GRIN Lens G, molded aspheric lens L1 and achromatic lens L2, and (B) a housing with slots for the optics was designed in SolidWorks (Dassault Systèmes), with sawtooth mating features for improved bonding and fixed cuff attached to the endoscope. Scale bar = 5 mm (C,D) The internal features are designed to perfectly fit the micro-optics, with no epoxy required. Location of G, L and PLFA are indicated. Scale bar = 5 mm (E) The GRIN lens is the smallest and most sensitive element to misalignment. Tiny ledges are printed to seat the GRIN lens in the correct focal plane. Scale bar = 1 mm(F) The assembled and polished probe is only 4.5 mm in thickness, ramping up to 5.3 mm near the imaging tip and (G) similar in form to a radiofrequency ablation paddle. Red arrow indicates a/LCI probe, blue arrow indicates location of OCT window. Scale bar = 5 mm.
Fig. 3.
Fig. 3.
Flow chart of PLFA Assembly.
Fig. 4.
Fig. 4.
Schematic diagram depicting the combined OCT and a/LCI optical engine with associated probe. OCT: The OCT system employed a spectral-domain fiber-optic Michelson interferometer design with a superluminescent (SLD) diode centered at 1318 nm, utilizing a fiber-optic rotary junction to rotate the distal optics and enable side-viewing. a/LCI: Light from the SLD is split into sample and reference arms in a ratio of 99:1. Sample light was passed through a polarization controller and coupled to the PM fiber in the pathlength matched linear fiber array (PLFA). Scattered light is collected by the path-matched SM fibers and delivered to the slit of a custom imaging spectrometer, along with a collimated reference beam. S1, S2 represent optical shutters, DAQ is a data acquisition module, PC is a polarization controller.
Fig. 5.
Fig. 5.
(Left) a/LCI camera acquisitions showing total, sample, reference, and dark fields, with an inset showing interference from a few fibers. The four frames are used to isolate the interferometric term in the signal, using the formula |ER+ES|2|ES|2|ER|2+|ED|2 (Right) a/LCI scans at various stages of processing, showing scattering intensity as a function of angle and sample depth. Since the sample field is discretized along single fibers, lines containing signal are selected prior to analysis (line selection). The A-line from each fiber must also be manually adjusted to account for pathlength variance (depth correction). In the final processed image, the coverslip is clearly visible. The measured thickness of the coverslip (assuming a refractive index of 1.51) was 149.8 µm, well within the 130-160 µm range characteristic of No. 1 coverglass.
Fig. 6.
Fig. 6.
Representative scans using the miniature a/LCI probe without truncated lenses. a/LCI scans were taken using two very similar scatterers - 7.0 and 8.0 µm polystyrene microspheres in PDMS – to demonstrate sizing precision. The paddle accurately characterized the 7 µm spheres as 7.0 µm and the 8 µm spheres as 8.0 µm. All Mie oscillations are clearly visible and match their expected locations. The miniature probe exhibits an angular range of 2°-38°.
Fig. 7.
Fig. 7.
(Left) Calibration curve demonstrating sizing of microspheres in a/LCI. 6, 7, 8, and 10 µm microspheres were accurately identified as 6.03 ± 0.11 µm, 6.98 ± 0.07 µm, 7.98 ± 0.12 µm, and 10.15 ± 0.05 µm. Mean absolute error for all measurements is ∼0.1 µm, and all measurements precisely characterize microspheres to sub-wavelength accuracy.
Fig. 8.
Fig. 8.
Data from the combined a/LCI and OCT platform in patients with Barrett's Esophagus, depicting (A) low-grade dysplasia and (B) non-dysplastic tissue. Top: OCT images from BE patients with and without dysplasia. Arrow shows trapped air between tissue and coverglass which can confound a/LCI measurements without image guidance. Scale bar is 1 mm in tissue. Center: Angle-resolved depth scan of light scattered from tissue. Red boxed area shows depth selected for analysis, 200-300 µm beneath the tissue surface. Bottom: Example angular scans for 2 tissue types (blue line) with best-fit Mie theory solutions (red line). Analysis of these angular scans produces a nuclear size of 13.8 µm for the LGD tissue and 8.1 µm for the non-dysplastic tissue.

Similar articles

Cited by

References

    1. Steelman Z. A., Ho D. S., Chu K. K., et al. , “Light-scattering methods for tissue diagnosis,” Optica 6(4), 479–489 (2019).10.1364/OPTICA.6.000479 - DOI - PMC - PubMed
    1. Zhang L., Pleskow D. K., Turzhitsky V., et al. , “Light scattering spectroscopy identifies the malignant potential of pancreatic cysts during endoscopy,” Nat. Biomed. Eng. 1(4), 0040 (2017).10.1038/s41551-017-0040 - DOI - PMC - PubMed
    1. Li T., Zou L., Zhang J., et al. , “Non-invasive diagnosis of bladder cancer by detecting telomerase activity in human urine using hybridization chain reaction and dynamic light scattering,” Anal. Chim. Acta. 1065, 90–97 (2019).10.1016/j.aca.2019.03.039 - DOI - PubMed
    1. Dannhauser D., Rossi D., Ripaldi M., et al. , “Single-cell screening of multiple biophysical properties in leukemia diagnosis from peripheral blood by pure light scattering,” Sci. Rep. 7(1), 12666 (2017).10.1038/s41598-017-12990-4 - DOI - PMC - PubMed
    1. Daneshkhah A., Prabhala S., Viswanathan P., et al. , “Early detection of lung cancer using artificial intelligence-enhanced optical nanosensing of chromatin alterations in field carcinogenesis,” Sci. Rep. 13(1), 13702 (2023).10.1038/s41598-023-40550-6 - DOI - PMC - PubMed

LinkOut - more resources