

Identity and nature of neural stem cells in the adult human subventricular zone
- PMID: 38495819
- PMCID: PMC10940989
- DOI: 10.1016/j.isci.2024.109342
Identity and nature of neural stem cells in the adult human subventricular zone
Abstract
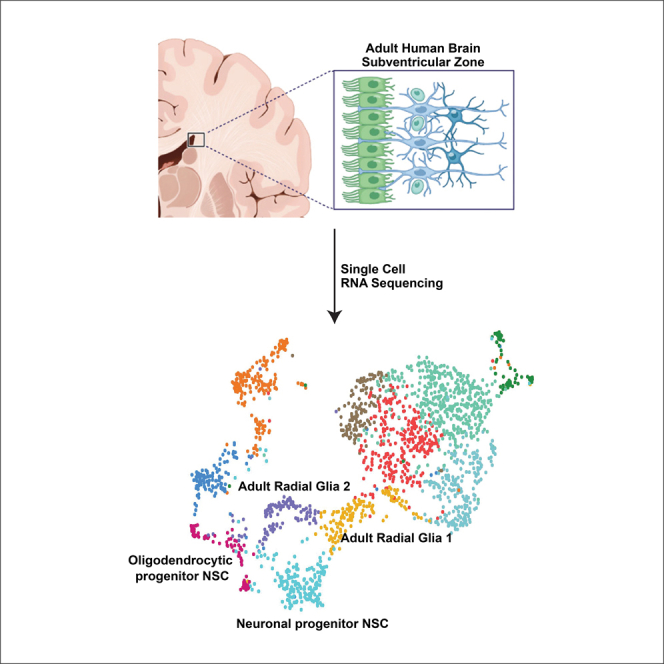
The existence of neural stem cells (NSCs) in adult human brain neurogenic regions remains unresolved. To address this, we created a cell atlas of the adult human subventricular zone (SVZ) derived from fresh neurosurgical samples using single-cell transcriptomics. We discovered 2 adult radial glia (RG)-like populations, aRG1 and aRG2. aRG1 shared features with fetal early RG (eRG) and aRG2 were transcriptomically similar to fetal outer RG (oRG). We also captured early neuronal and oligodendrocytic NSC states. We found that the biological programs driven by their transcriptomes support their roles as early lineage NSCs. Finally, we show that these NSCs have the potential to transition between states and along lineage trajectories. These data reveal that multipotent NSCs reside in the adult human SVZ.
Keywords: Cell biology; Molecular biology; Omics; Transcriptomics.
© 2024 The Author(s).
Conflict of interest statement
The authors declare no competing interests.
Figures
Similar articles
-
Grafted Subventricular Zone Neural Stem Cells Display Robust Engraftment and Similar Differentiation Properties and Form New Neurogenic Niches in the Young and Aged Hippocampus.Stem Cells Transl Med. 2016 Sep;5(9):1204-15. doi: 10.5966/sctm.2015-0270. Epub 2016 May 18. Stem Cells Transl Med. 2016. PMID: 27194744 Free PMC article.
-
Neural stem cell heterogeneity through time and space in the ventricular-subventricular zone.Front Biol (Beijing). 2016 Aug;11(4):261-284. doi: 10.1007/s11515-016-1407-1. Epub 2016 Jul 8. Front Biol (Beijing). 2016. PMID: 28367160 Free PMC article.
-
Olig2 defines a subset of neural stem cells that produce specific olfactory bulb interneuron subtypes in the subventricular zone of adult mice.Development. 2022 Mar 1;149(5):dev200028. doi: 10.1242/dev.200028. Epub 2022 Feb 28. Development. 2022. PMID: 35132995 Free PMC article.
-
The Adult Ventricular-Subventricular Zone (V-SVZ) and Olfactory Bulb (OB) Neurogenesis.Cold Spring Harb Perspect Biol. 2016 May 2;8(5):a018820. doi: 10.1101/cshperspect.a018820. Cold Spring Harb Perspect Biol. 2016. PMID: 27048191 Free PMC article. Review.
-
Assessing the Role of Ependymal and Vascular Cells as Sources of Extracellular Cues Regulating the Mouse Ventricular-Subventricular Zone Neurogenic Niche.Front Cell Dev Biol. 2022 Apr 5;10:845567. doi: 10.3389/fcell.2022.845567. eCollection 2022. Front Cell Dev Biol. 2022. PMID: 35450289 Free PMC article. Review.
Cited by
-
Human-specific gene ARHGAP11B-potentially an additional tool in the treatment of neurodegenerative diseases?Front Mol Med. 2024 Nov 27;4:1465647. doi: 10.3389/fmmed.2024.1465647. eCollection 2024. Front Mol Med. 2024. PMID: 39664945 Free PMC article. No abstract available.
-
APOE4 impacts cortical neurodevelopment and alters network formation in human brain organoids.Stem Cell Reports. 2025 Jul 8;20(7):102537. doi: 10.1016/j.stemcr.2025.102537. Epub 2025 Jun 19. Stem Cell Reports. 2025. PMID: 40541173 Free PMC article.
-
Cancer neuroscience and glioma: clinical implications.Acta Neurochir (Wien). 2025 Jan 3;167(1):2. doi: 10.1007/s00701-024-06406-2. Acta Neurochir (Wien). 2025. PMID: 39752006 Free PMC article. Review.
-
Brain aging and rejuvenation at single-cell resolution.Neuron. 2025 Jan 8;113(1):82-108. doi: 10.1016/j.neuron.2024.12.007. Neuron. 2025. PMID: 39788089 Review.
-
Senescence accelerated mouse-prone 8: a model of neuroinflammation and aging with features of sporadic Alzheimer's disease.Stem Cells. 2025 Feb 12;43(2):sxae091. doi: 10.1093/stmcls/sxae091. Stem Cells. 2025. PMID: 39813151 Free PMC article. Review.
References
-
- Nowakowski T.J., Bhaduri A., Pollen A.A., Alvarado B., Mostajo-Radji M.A., Di Lullo E., Haeussler M., Sandoval-Espinosa C., Liu S.J., Velmeshev D., et al. Spatiotemporal gene expression trajectories reveal developmental hierarchies of the human cortex. Science (New York, N.Y.) 2017;358:1318–1323. doi: 10.1126/science.aap8809. - DOI - PMC - PubMed
LinkOut - more resources
Full Text Sources
Molecular Biology Databases
Research Materials
Miscellaneous
