. 2024 Mar 14;17(3):e13675.
doi: 10.1111/eva.13675. eCollection 2024 Mar.

Adaptation to seasonal reproduction and environment-associated factors drive temporal and spatial differentiation in northwest Atlantic herring despite gene flow

Affiliations

Adaptation to seasonal reproduction and environment-associated factors drive temporal and spatial differentiation in northwest Atlantic herring despite gene flow

Angela P Fuentes-Pardo et al. Evol Appl. .

Abstract

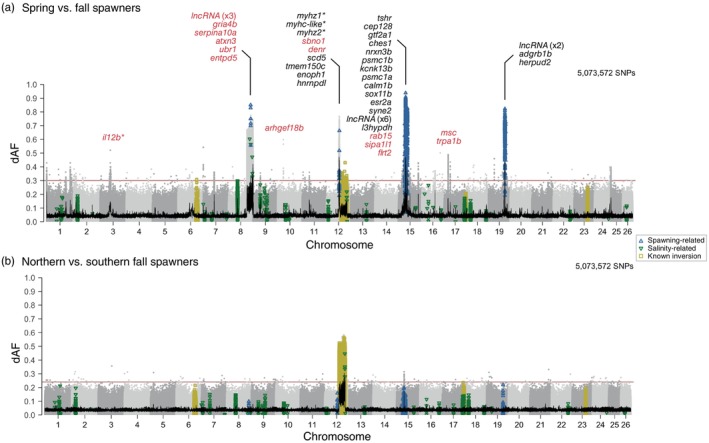
Understanding how marine organisms adapt to local environments is crucial for predicting how populations will respond to global climate change. The genomic basis, environmental factors and evolutionary processes involved in local adaptation are however not well understood. Here we use Atlantic herring, an abundant, migratory and widely distributed marine fish with substantial genomic resources, as a model organism to evaluate local adaptation. We examined genomic variation and its correlation with environmental variables across a broad environmental gradient, for 15 spawning aggregations in Atlantic Canada and the United States. We then compared our results with available genomic data of northeast Atlantic populations. We confirmed that population structure lies in a fraction of the genome including likely adaptive genetic variants of functional importance. We discovered 10 highly differentiated genomic regions distributed across four chromosomes. Nine regions show strong association with seasonal reproduction. One region, corresponding to a known inversion on chromosome 12, underlies a latitudinal pattern discriminating populations north and south of a biogeographic transition zone on the Scotian Shelf. Genome-environment associations indicate that winter seawater temperature best correlates with the latitudinal pattern of this inversion. The variation at two so-called 'islands of divergence' related to seasonal reproduction appear to be private to the northwest Atlantic. Populations in the northwest and northeast Atlantic share variation at four of these divergent regions, simultaneously displaying significant diversity in haplotype composition at another four regions, which includes an undescribed structural variant approximately 7.7 Mb long on chromosome 8. Our results suggest that the timing and geographic location of spawning and early development may be under diverse selective pressures related to allelic fitness across environments. Our study highlights the role of genomic architecture, ancestral haplotypes and selection in maintaining adaptive divergence in species with large population sizes and presumably high gene flow.

Keywords: chromosomal inversion; fisheries; genomics; marine fish; pool‐seq; whole genome.


Conflict of interest statement

The authors declare no competing interest.

Figures

FIGURE 1
FIGURE 1
Sampling locations and population structure of northwest Atlantic herring. (a) Map depicting collection sites. Location name abbreviations as described in Table 1, in which the spawning season is indicated with the suffix ‘‐S’ for spring, ‘‐F’ for fall, ‘‐U’ for summer and ‘‐M’ for mixed. Each point corresponds to a pool sample. Point colours indicate the designation of the sample to one of the major biogeographic units described for the Canadian Atlantic Ocean. Symbol shapes represent the predominant spawning season based on individual gonadal maturation status at the time of collection (Figure S1). The horizontal blue dashed line on the map indicates the approximate location of a biogeographic transition zone in the eastern Scotian Shelf, 44.61° N ± 0.25 (Stanley et al., 2018). (b) Heatmap plot representing pairwise F ST estimates based on pool allele frequencies of 5,073,572 SNPs (Table S2). Samples are ordered by season, and within season, by latitude. Cell shading represents the degree of genomic divergence between a pair of pool samples, which goes from a lack (white) to high (black) differentiation. Principal component analysis plot based on undifferentiated (c) (n = 135,950) and highly differentiated (d) markers (n = 545). In both plots the first two axes or principal components (PCs) are shown and the inset bar plots indicate the percentage of the variance explained by each of the first 10 PCs. Same as before, each point corresponds to a pool sample, its colour indicates the designated biogeographic unit and its shape, the corresponding spawning season.
FIGURE 2
FIGURE 2
Genomic regions associated with adaptation to seasonal reproduction and a latitudinal environmental cline. Genetic differentiation (dAF) across the genome (a) between spring and fall spawners and (b) between fall spawners in the north versus south of the transition zone in eastern Scotian Shelf (Stanley et al., 2018). Each dot represents a single SNP. SNPs previously reported in Han et al. (2020) as strongly associated with spawning season, salinity and four known inversions (on Chr6, 12, 17 and 23) are denoted as empty blue upward triangles, green downward triangles and yellow squares respectively. Consecutive chromosomes are coloured in intercalating shades of grey. The 100 SNP‐rolling average of dAF is shown as a black line and the Bonferroni significance value across the genome is shown as a horizontal red line. Genes within ±40 kbp of the most divergent SNPs are shown on top of each informative locus. *Gene names with an were inferred from homology with orthologous genes. Gene names coloured in red correspond to genes within the associated genomic region.
FIGURE 3
FIGURE 3
Novel putative inversion on chromosome 8 associated with seasonal reproduction. (a) Genetic differentiation (dAF) between spring and fall spawners across chromosome 8. Each dot is a single SNP. The black line is the rolling average of dAF over 100 SNPs and the horizontal red line is the Bonferroni significance value. SNPs with known association with spawning or salinity (Han et al., 2020) are denoted with empty blue upward triangles or green downward triangles respectively. (b) Close‐up plot to the structural variant (Chr8: 23,040,136–30,729,461). This plot has five tracks, which show from top to bottom: genetic differentiation between spring and fall spawners for SNPs with dAF ≥ 0.4; heatmap plot depicting the minor allele frequency per population (rows) for the novel outlier SNPs (columns); average nucleotide diversity (π) and Tajima's D (window size 10 kbp, step size 2 kbp) for spring and fall spawners, in light and dark blue lines respectively; and estimate of recombination rate (rho/kbp) every 100 kbp (Pettersson et al., 2019). Novel outlier SNPs (dAF ≥ 0.55) are denoted as red filled circles, missense mutations as filled black circles and other SNPs are grey circles. (c) Linkage disequilibrium pattern among all individuals and among the two types of homozygotes at this putative inversion. Allele sharing for inversion on (d) Chr8, (e) Chr6, 12, 17 and 23.
FIGURE 4
FIGURE 4
Signatures of selection associated with seasonal reproduction. Genetic differentiation (dAF) between spring and fall spawners across chromosomes (a) 12, (b) 15 and (c) 19. Each dot represents a single SNP. The rolling average of dAF over 100 SNPs is shown as a horizontal black line and the Bonferroni significance value is shown as a horizontal red line. SNPs with described association with spawning, salinity or four inversions (in Chr6, 12, 17 and 23) in Han et al. (2020) are indicated with empty blue upward triangles, green downward triangles and yellow squares respectively. Close‐up to the signatures of selection in chromosomes (d) 12, (e) 15 and (f) 19. Each plot has five tracks that show from top to bottom: genetic differentiation between spring and fall spawners for SNPs with dAF ≥ 0.4; heatmap plot depicting the minor allele frequency per population (rows) for the novel outlier SNPs (columns); average nucleotide diversity (π) and Tajima's D (window size 10 kbp, step size 2 kbp) for spring and fall spawners, in light and dark blue lines respectively; and estimate of recombination rate (rho/kbp) every 100 kbp (Pettersson et al., 2019). Novel outlier SNPs (dAF ≥ 0.55) are denoted as red filled circles, missense mutations as filled black circles and other SNPs are grey circles. For zoom‐in plots to each peak of divergence including gene names see Figures S8, S9, S11.
FIGURE 5
FIGURE 5
Chromosomal inversion on chromosome 12 associated with spatial genetic divergence along a latitudinal environmental cline. (a) Genetic differentiation (dAF) along the chromosome. (b) Close‐up plot to the putative inversion (Chr12: 17,826,318–25,603,093) consisting of five tracks. The first track is the genetic differentiation for SNPs with dAF ≥ 0.4. Each dot is a single SNP, its shape indicates whether it is a novel outlier (red filled circle), a missense mutation (black circle) or is in one of four inversions reported in Han et al. (2020). The second track depicts the pool‐minor allele frequency of the novel outlier SNPs, where each row is a single pool sample and each column is a SNP. The third and fourth tracks show the profile of the average nucleotide diversity (π) and Tajima's D of northern and southern populations, calculated in 10 kbp sliding windows with a 2‐kbp step. The fifth track shows the recombination rate (rho/kbp) every 100 kbp (Pettersson et al., 2019). (c) Redundancy analysis plot representing the association between four uncorrelated environmental variables and population allele frequencies of the top outlier SNPs within the inversion on Chr12 (dAF >0.55). The environmental variables are SSTSpawn: sea surface temperature during spawning, SSTSummer: sea surface temperature during summer months, SSTWinter: sea surface temperature during winter months, dayLightHours: Hours or daylight. Each circle corresponds to a spawning aggregation and their colour indicates their predominant population allele frequency. Sample abbreviations and names as in Table 1. The red arrows (and their length) indicate the level of correlation of each environmental variable with genetic variation in the first two axes. The environmental variable with the strongest correlation with allele frequency variation is indicated with an asterisk (*), for an alpha value of statistical significance <0.01. Results of ANOVA to test statistical significance are shown in Table S5. (d) Map depicting average winter sea surface temperature and the predominant population allele frequencies at diagnostic SNPs within the inversion on Chr12 for the 15 spawning aggregations included in this study. Each circle corresponds to a spawning aggregation and their colour indicates their predominant population allele frequency as per in (b) second track.
FIGURE 6
FIGURE 6
Comparison of the contribution of shared and newly identified outlier SNPs to the genetic differentiation between West and East Atlantic at nine spawning‐associated genomic regions. The absolute difference in allele frequencies (dAF) was used as a measure of genetic differentiation. (a) Loci uniquely identified as outliers in the West Atlantic populations. (b) Loci with shared variation between West and East Atlantic. (c) Loci with a large number of SNPs newly identified as outliers in the West Atlantic populations. Each dot represents a single SNP. Red dots indicate novel SNPs in the West Atlantic and blue dots indicate SNPs with known association with spawning time as reported in Han et al. (2020). The rest of SNPs in the region (not outliers, dAF in the West Atlantic ≤0.55) are shown in grey. A summary of the percentage of unique and shared loci and SNPs is shown in Table S6.

References

    1. Andersson, L. , Ryman, N. , Rosenberg, R. , & Ståhl, G. (1981). Genetic variability in Atlantic herring (Clupea harengus harengus): Description of protein loci and population data. Hereditas, 95(1), 69–78. 10.1111/j.1601-5223.1981.tb01330.x - DOI
    1. André, C. , Larsson, L. C. , Laikre, L. , Bekkevold, D. , Brigham, J. , Carvalho, G. R. , Dahlgren, T. G. , Hutchinson, W. F. , Mariani, S. , Mudde, K. , Ruzzante, D. E. , & Ryman, N. (2011). Detecting population structure in a high gene‐flow species, Atlantic herring (Clupea harengus): Direct, simultaneous evaluation of neutral vs putatively selected loci. Heredity, 106(2), 270–280. 10.1038/hdy.2010.71 - DOI - PMC - PubMed
    1. Andrews, S. (2010). FastQC: A quality control tool for high throughput sequence data . http://www.bioinformatics.babraham.ac.uk/projects/fastqc
    1. Bekkevold, D. , André, C. , Dahlgren, T. G. , Clausen, L. A. W. , Torstensen, E. , Mosegaard, H. , Carvalho, G. R. , Christensen, T. B. , Norlinder, E. , & Ruzzante, D. E. (2005). Environmental correlates of population differentiation in Atlantic herring. Evolution, 59(12), 2656–2668. 10.1111/j.0014-3820.2005.tb00977.x - DOI - PubMed
    1. Benestan, L. , Gosselin, T. , Perrier, C. , Sainte‐Marie, B. , Rochette, R. , & Bernatchez, L. (2015). RAD genotyping reveals fine‐scale genetic structuring and provides powerful population assignment in a widely distributed marine species, the American lobster (Homarus americanus). Molecular Ecology, 24(13), 3299–3315. 10.1111/mec.13245 - DOI - PubMed

LinkOut - more resources