[Preprint]. 2024 Jun 19:2024.03.07.583953.
doi: 10.1101/2024.03.07.583953.

HPV18 E7 inhibits LATS1 kinase and activates YAP1 by degrading PTPN14

Affiliations

HPV18 E7 inhibits LATS1 kinase and activates YAP1 by degrading PTPN14

William J Blakely et al. bioRxiv. .

Update in

Abstract

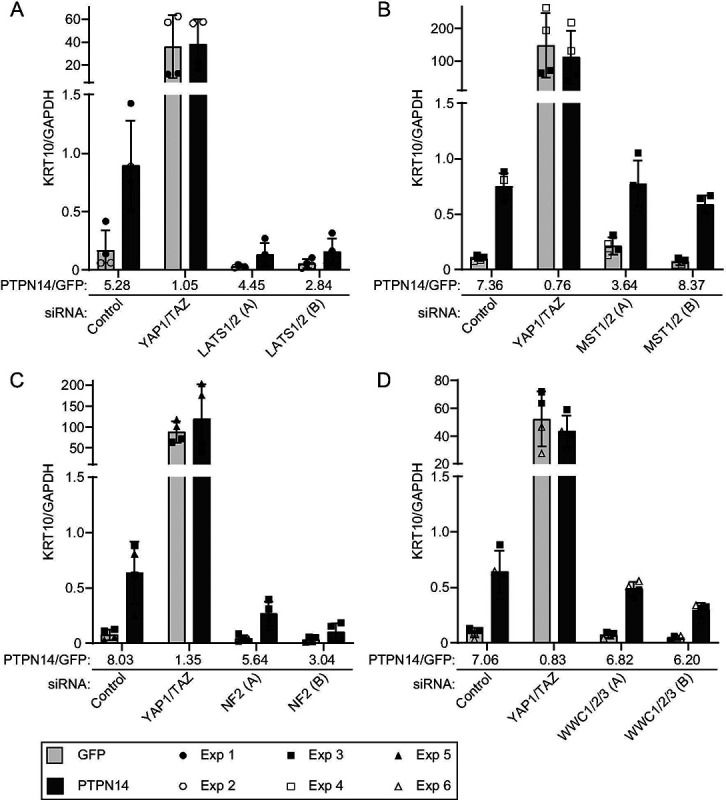
High-risk human papillomavirus (HPV) oncoproteins inactivate cellular tumor suppressors to reprogram host cell signaling pathways. HPV E7 proteins bind and degrade the tumor suppressor PTPN14, thereby promoting the nuclear localization of the YAP1 oncoprotein and inhibiting keratinocyte differentiation. YAP1 is a transcriptional coactivator that drives epithelial cell stemness and self-renewal. YAP1 activity is inhibited by the highly conserved Hippo pathway, which is frequently inactivated in human cancers. MST1/2 and LATS1/2 kinases form the core of the Hippo kinase cascade. Active LATS1 kinase is phosphorylated on threonine 1079 and inhibits YAP1 by phosphorylating it on amino acids including serine 127. Here, we tested the effect of high-risk (carcinogenic) HPV18 E7 on Hippo pathway activity. We found that either PTPN14 knockout or PTPN14 degradation by HPV18 E7 decreased phosphorylation of LATS1 T1079 and YAP1 S127 in human keratinocytes and inhibited keratinocyte differentiation. Conversely, PTPN14-dependent differentiation required LATS kinases and certain PPxY motifs in PTPN14. Neither MST1/2 kinases nor the putative PTPN14 phosphatase active site were required for PTPN14 to promote differentiation. Taken together, these data support that PTPN14 inactivation or degradation of PTPN14 by HPV18 E7 reduce LATS1 activity, promoting active YAP1 and inhibiting keratinocyte differentiation.

Keywords: Biological Sciences; Hippo; Human papillomavirus; Microbiology; PTPN14; YAP1; differentiation; keratinocyte; tumor suppressor.


Figures

Figure 1.
Figure 1.. Phosphorylation on YAP1 S127 is reduced in PTPN14 knockout keratinocytes.
N/Tert-1 keratinocytes were transduced with LentiCRISPRv2 vectors encoding spCas9 and an sgRNA sequence targeting PTPN14 or a nontargeting control sequence. sgRNA sequences were chosen from the Broad Institute Brunello Library. Four cell lines were generated using two different non-targeting control (sgNT-1, sgNT-2) and two different PTPN14 (sgPTPN14–1, sgPTPN14–3) sgRNAs. Cells were treated with cytochalasin D for up to 90 minutes and whole cell lysates were harvested at 30-minute intervals. (A) Whole cell protein lysates were separated by SDS-PAGE and proteins were detected by immunoblotting for YAP1, YAP1 pS127, PTPN14, and actin. (B) Western blot band intensity for three independent experiments was measured using ImageJ. Graph displays the ratio of YAP1 pS127/total YAP1 band intensity from three biological replicate experiments, plotted as mean ± standard deviation. Significance was determined by 2-way ANOVA with Holm-Šidak’s multiple comparisons test (*, P < 0.05)
Figure 2.
Figure 2.. Phosphorylation on LATS1 T1079 is reduced in PTPN14 knockout keratinocytes.
Control and PTPN14 knockout N/Tert-1 cells generated using LentiCRISPRv2 vectors were trypsinized and kept in suspension for 10 minutes. Whole cell protein lysates were separated by SDS-PAGE and proteins were detected by immunoblotting for YAP1, YAP1 pS127, LATS1, LATS1 pT1079, NF2, NF2 pS518, PTPN14, and actin. Panels (A, B) show replicate experiments using the same four distinct cell lines as in Figure 1. (C) Western blot band intensity for three independent experiments was measured using ImageJ. Graph displays the ratio of YAP1 pS127/total YAP1, LATS1 pT1079/total LATS1, or NF2 pS518/total NF2 band intensity from three biological replicate experiments, plotted as mean ± standard deviation. Significance was determined by 2-way ANOVA with Holm-Šidak’s multiple comparisons test (*, P < 0.05; **, P < 0.01; ***, P < 0.001)
Figure 3.
Figure 3.. HPV18 E7-mediated PTPN14 degradation reduces phosphorylation on YAP1 S127 and LATS1 T1079.
N/Tert-1 keratinocytes that stably express HA-tagged HPV18 E7 or HA-tagged HPV18 E7 R84S, which is unable to bind or degrade PTPN14, were used in assays of Hippo pathway activity. Cells transduced with empty vector were included as a control. (A) Cells were treated with cytochalasin D for up to 90 minutes and whole cell lysates were harvested at 30 minute intervals. Whole cell protein lysates were separated by SDS-PAGE and proteins were detected by immunoblotting for YAP1, YAP1 pS127, PTPN14, RB1, HA, and actin. (B) Western blot band intensity for three independent experiments was measured using ImageJ. Graph displays the ratio of YAP1 pS127/total YAP1 band intensity from three biological replicate cytochalasin D experiments, plotted as mean ± standard deviation. Significance was determined by 2-way ANOVA with Holm-Šidak’s multiple comparisons test (*, P < 0.05). (C) Cells were trypsinized and kept in suspension for 10 minutes. Whole cell protein lysates were separated by SDS-PAGE and proteins were detected by immunoblotting for YAP1, YAP1 pS127, LATS1, LATS1 pT1079, HA, PTPN14, and actin. (D) Western blot band intensity for three independent experiments was measured using ImageJ. Graph displays the ratio of YAP1 pS127/total YAP1 or LATS1 pT1079/total LATS1 band intensity from three biological replicate detachment experiments, plotted as mean ± standard deviation. Significance was determined by 2-way ANOVA with Holm-Šidak’s multiple comparisons test (*, P < 0.05; **, P < 0.01)
Figure 4.
Figure 4.. PTPN14 knockout impairs keratinocyte differentiation.
(A) N/Tert-1 cells stably expressing Cas9 were transfected with sgRNA targeting PTPN14 (Synthego) or mock transfected and PTPN14 knockout was validated by immunoblot. (B) Mock transfected and PTPN14 knockout N/Tert-1 cells were cultured in media containing 1.5 mM calcium and harvested for RNA analysis at indicated times. KRT10 and IVL RNA levels were analyzed by qRT-PCR and normalized to G6PD. Graphs show values for technical duplicate experiments. Error bars display mean ± range.
Figure 5.
Figure 5.. PTPN14 promotes keratinocyte differentiation and Hippo pathway activity.
N/Tert-1 keratinocytes that express endogenous PTPN14 were transduced with a lentiviral vector encoding doxycycline-inducible PTPN14 (pLIX-PTPN14). Cells were treated with 1 μg/mL doxycycline for 24 hours or left untreated. (A) KRT10 and IVL RNA levels were measured by qRT-PCR and normalized to GAPDH. Graphs show data points for two technical replicate experiments. Error bars display mean ± range. (B) Whole cell protein lysates were separated by SDS-PAGE and proteins analyzed by immunoblotting for YAP1, YAP1 pS127, LATS1, LATS1 pT1079, NF2, NF2 pS518, PTPN14, and actin. Bands for YAP1, YAP1 pS127, LATS1, LATS1 pT1079, NF2, NF2 pS518 were quantified by densitometry. Values reflect the ratio of phospho protein/total protein band density.
Figure 6.
Figure 6.. PTPN14 PY1/2 motifs are required to induce differentiation.
(A) Schematic of PTPN14 domains and location of PPxY motifs. (B) HFK were transfected with lentiviral constructs encoding GFP, wild-type (WT) PTPN14, or PTPN14 mutants as indicated. Total cellular RNA was collected and KRT1 transcript levels were analyzed by qRT-PCR and normalized to GAPDH. Graph shows individual data points for three independent experiments. Data is plotted as mean ± standard deviation. Significance was determined by ANOVA with Holm-Šidak’s multiple comparisons test. (ns, not significant; ****, P < 0.0001). (C) N/Tert-1 immortalized keratinocytes transduced with pLIX-PTPN14 were treated with 1 μg/mL doxycycline for 48 hours to induce HA-tagged PTPN14 expression. Whole cell protein lysates were collected and PTPN14 immunoprecipitated with anti-HA agarose beads. Protein lysates from input and elution fractions were separated by SDS-PAGE and proteins were analyzed by immunoblotting for WWC1, PTPN14, and actin. Bands for WWC1 and PTPN14 in the IP fraction were quantified by densitometry. Values reflect the ratio of WWC1/PTPN14 band intensity.
Figure 7.
Figure 7.. LATS kinases and NF2 are required for PTPN14 to induce KRT10 expression.
HFK were transfected with siRNA then transduced with lentiviruses encoding GFP or PTPN14 at 24h post transfection. Total cellular RNA was collected 72h post-knockdown and 48h posttransduction. RNA transcripts for KRT10 were measured by qRT-PCR and normalized to GAPDH. Six individual experiments were conducted, each in technical duplicate. Each experiment included an siControl condition, a YAP1 and TAZ siRNA-treated condition, and siRNAs targeting additional component(s) of the Hippo pathway. Each component of the Hippo pathway was targeted with two different siRNAs per gene, denoted A and B. Panels display data from knockdowns as follows: (A) LATS1 and LATS2, (B) MST1 and MST2, (C) NF2, or (D) WWC1, WWC2, and WWC3. Data are graphed as mean ± standard deviation of combined replicate data. PTPN14/GFP denotes the ratio of KRT10 level in PTPN14 transduced cells vs GFP transduced cells in each siRNA-treated condition. Since Experiment 3 included several siRNAs (Control, YAP1/TAZ, MST1/2, NF2, WWC1/2/3), the same siControl and siYAP1/TAZ data from experiment 3 is included in panels B, C, and D.
Figure 8.
Figure 8.. PTPN14 knockout promotes anchorage independent growth and reduces YAP1 phosphorylation in HEK TER cells.
(A) HEK TER cells expressing spCas9 were transfected with sgRNA targeting PTPN14 or LATS1 and LATS2. HEK TER cells expressing SV40 ST were used as a positive control for colony formation. Cells were plated in soft agar in technical triplicate and incubated at 37°C for 18 days, then photographed. Colonies were counted and quantified using ImageJ software. Graphs show individual data points for each plate and indicate mean ± standard deviation. Statistical significance of the nontargeting control condition compared to experimental conditions was determined by ANOVA with Dunnett’s multiple comparisons test (*, P < 0.05; ***, P < 0.001). (B) Cells were treated with cytochalasin D for up to 90 minutes and whole cell lysates were harvested at 30-minute intervals. Whole cell protein lysates were separated by SDS-PAGE and proteins were detected by immunoblotting for YAP1, YAP1 pS127, PTPN14, LATS1, and actin. (C) Band intensity for blots of two independent experiments was measured by ImageJ. Graph displays the ratio of YAP1 pS127/total YAP1 band intensity from two biological replicate cytochalasin D experiments as mean ± range. The blots shown in panel B are from experiment 1.

Similar articles

References

    1. McBride A. A., Human papillomaviruses: diversity, infection and host interactions. Nat Rev Microbiol 20, 95–108 (2022). - PubMed
    1. de Martel C., Plummer M., Vignat J., Franceschi S., Worldwide burden of cancer attributable to HPV by site, country and HPV type. Int J Cancer 141, 664–670 (2017). - PMC - PubMed
    1. Moody C. A., Laimins L. A., Human papillomavirus oncoproteins: pathways to transformation. Nat Rev Cancer 10, 550–560 (2010). - PubMed
    1. Dyson N., Howley P. M., Munger K., Harlow E., The human papilloma virus-16 E7 oncoprotein is able to bind to the retinoblastoma gene product. Science 243, 934–937 (1989). - PubMed
    1. DeGregori J., Johnson D. G., Distinct and Overlapping Roles for E2F Family Members in Transcription, Proliferation and Apoptosis. Curr Mol Med 6, 739–748 (2006). - PubMed

Publication types