[Preprint]. 2024 Mar 5:2024.03.05.583530.
doi: 10.1101/2024.03.05.583530.

Salmonella Typhimurium infection inhibits macrophage IFNβ signaling in a TLR4-dependent manner

Affiliations

Salmonella Typhimurium infection inhibits macrophage IFNβ signaling in a TLR4-dependent manner

Michael Shuster et al. bioRxiv. .

Update in

Abstract

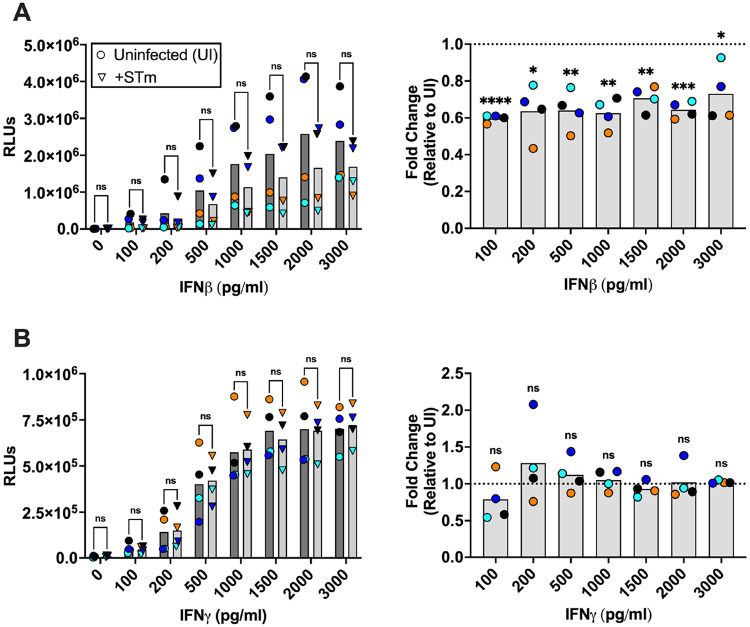
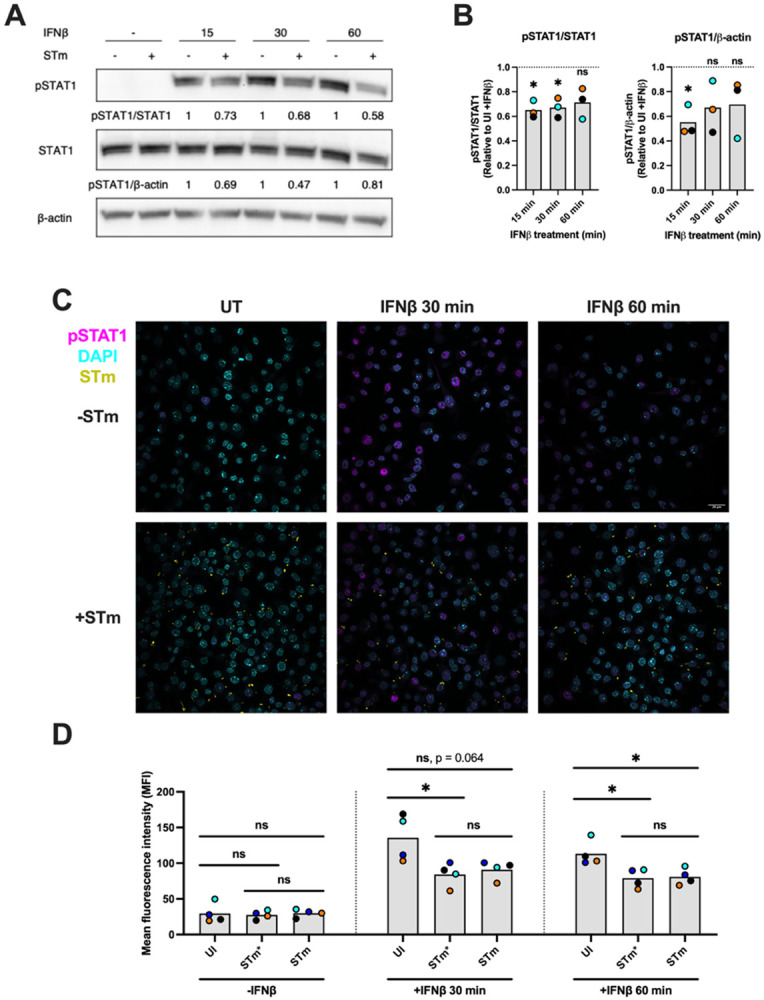
Type I Interferons (IFNs) generally have a protective role during viral infections, but their function during bacterial infections is dependent on the bacterial species. Legionella pneumophila, Shigella sonnei and Mycobacterium tuberculosis can inhibit type I IFN signaling. Here we examined the role of type I IFN, specifically IFNβ, in the context of Salmonella enterica serovar Typhimurium (STm) macrophage infections and the capacity of STm to inhibit type I IFN signaling. We demonstrate that IFNβ has no effect on the intracellular growth of STm in infected bone marrow derived macrophages (BMDMs) derived from C57BL/6 mice. STm infection inhibits IFNβ signaling but not IFNγ signaling in a murine macrophage cell line. We show that this inhibition is independent of the type III and type VI secretion systems expressed by STm and is also independent of bacterial phagocytosis. The inhibition is Toll-like receptor 4 (TLR4)-dependent as the TLR4 ligand, lipopolysaccharide (LPS), alone is sufficient to inhibit IFNβ-mediated signaling and STm-infected, TLR4-deficient BMDMs do not exhibit inhibited IFNβ signaling. In summary, we show that macrophages exposed to STm have reduced IFNβ signaling via crosstalk with TLR4 signaling, and that IFNβ signaling does not affect cell autonomous host defense against STm.


Figures

Figure 1:
Figure 1:. Salmonella enterica serovar Typhimurium (STm) infection specifically inhibits IFNβ signaling.
RAW-Lucia ISG-KO-IRF3 cells were infected with STm at MOI 10 for 30 min followed by 1 hour 100 μg/ml gentamicin chase. Post-infection, cells were stimulated with IFNβ (A) or IFNγ (B) in the presence of 20 μg/ml gentamicin for 20h and the response of the gene reporter measured by luminescence and plotted as relative luminescence units (RLUs) (A and B, left panels) as well as fold change relative to the uninfected, IFNβ- or IFNγ-treated condition (A and B, right panels). Data points indicate independent biological experiments and are the average from 4 technical replicates. Statistical analysis for RLUs is multiple unpaired t-tests, and for fold change is one sample t and Wilcoxon test where each fold change mean is compared to 1. Significance is as follows: * P ≤ 0.05, ** P ≤ 0.01, *** P ≤ 0.001, **** P ≤ 0.0001.
Figure 2:
Figure 2:. IFNβ has no effect on restriction of STm in ex vivo BMDM infection nor cell death induction.
(A) BMDMs from wild type and Ifnb−/− mice were infected with STm at MOI 3 for 30 min min followed by 1 hour 100 μg/ml gentamicin chase. Next, cells were stimulated with 1 ng/ml IFNβ every 12h in the presence of 20 μg/ml gentamicin. Colony-forming units (CFUs) were measured at the indicated timepoints. The data shown are mean values and standard deviation of three independent infections (left panel) or the normalized to 0h post infection data (right panel). (B) LDH cell death assay was performed on cell supernatants obtained from the experiment described in panel A for each given timepoint. Data points indicate independent biological replicates (average from the 2 technical replicates) and are shown as relative absorbance at 490nm (left panel) or normalized to 0 h post infection (right panel). Statistical analysis for raw absorbance values is multiple unpaired t-test with Welch correction where each background strain stimulated with IFNβ is relative to untreated cells for a given timepoint. Statistical analysis for fold change relative to the 0h timepoint is multiple unpaired t-test with Welch correction.
Figure 3:
Figure 3:. STm infection results in reduced STAT1 phosphorylation after IFNβ treatment.
(A, B) RAW-Lucia ISG-KO-IRF3 cells were infected at MOI 3 for 30 min followed by 1 hour 100 μg/ml gentamicin chase. Next, cells were stimulated with 200 pg/ml IFNβ for the indicated time points in the presence of 20 μg/ml gentamicin. Whole cell lysates were collected and immunoblotted for pSTAT1, STAT1, and β-actin (A). Band densities were normalized to either STAT1 or β-actin as indicated. Densitometric ratios are shown relative to UI +IFNβ control (B). The blot shown here is representative of 3 independent infections, and individual points indicate the average from 3 independent experiments. (C) Representative images of RAW-Lucia ISG-KO-IRF3 cells infected or not with STm and treated with IFNβ or left untreated (UT). Cells were infected with yellow fluorescent protein expressing STm (STm-YFP) at MOI 3 for 30 min followed by 1 hour 100 μg/ml gentamicin chase. Following infection and chase, cells were stimulated with 1 ng/ml IFNβ for the indicated times, fixed and stained for pSTAT1 and nucleus (DAPI). (D) Mean fluorescence intensity (MFI) of pSTAT1 staining in nuclei segmented with Cellpose was quantified in uninfected (UI), infected (STm) and bystander cells (STm*). Points represent the mean of MFI values from 4 independent experiments. Statistical analysis for B is one sample t and Wilcoxon test where each fold change mean is compared to 1. Statistical analyses for D are unpaired t-test with Welch correction. Significance is indicated as such: * P ≤ 0.05, ** P ≤ 0.01.
Figure 4:
Figure 4:. STm infection inhibits IFNβ signaling independently of type III and type VI secretion systems as well as bacterial phagocytosis.
RAW-Lucia ISG-KO-IRF3 cells were infected with wild type STm or (A) SPI-1 mutants or (B) SPI-2 mutants to delete the encoded T3SS and (C) SPI-6 mutant to delete the encoded T6SS at MOI 10 for 30 min followed by 1 hour 100 μg/ml gentamicin chase. Following infection, cells were stimulated with 200 pg/ml IFNβ in the presence of 20 μg/ml gentamicin for 20h. Values are plotted as relative luminescence units (RLUs) as well as fold change relative to an uninfected IFNβ-treated control. Data points indicate independent biological experiments and are the average from 4 technical replicates. (D, E) RAW-Lucia ISG-KO-IRF3 cells were pretreated with cytochalasin D (cytoD) for 30 minutes followed by infection at MOI 3 for 30 min. CytoD was maintained on the cells at all points during the experiment. Whole cell lysates were collected and immunoblotted for pSTAT1, STAT1, and β-actin. Band densities were normalized to either STAT1 or β-actin as indicated (E). Densitometric ratios are shown relative to UI +IFNβ control (D). Statistical analysis for RLUs is multiple unpaired t-tests. For fold change and western blot quantification, statistical analyses are one sample t and Wilcoxon test where each fold change mean is compared to 1. Significance is as follows: * P ≤ 0.05, ** P ≤ 0.01, *** P ≤ 0.001.
Figure 5:
Figure 5:. LPS stimulation specifically inhibits IFNβ signaling without affecting host cell death.
RAW-Lucia cells were pre-treated with 50 ng/ml LPS for 4 hours followed by an additional 20 hours along with 200 pg/ml IFNβ (A) or 500 pg/ml IFNγ (B). Values are plotted as relative luminescence units (RLUs) as well as fold change relative to their respective −LPS +IFN control. (C+D) Supernatants were collected and analyzed for endpoint cell death from the IFNβ and IFNγ experiments (A+B) using LDH release assay. Values are plotted as absorbance at 490 nm (Abs490) as well as fold change relative to their respective −LPS +IFN control. Individual points indicate independent biological experiments and are the average from 4 technical replicates. Statistical analysis for each panel is one sample t and Wilcoxon test where each fold change mean is compared to 1. Statistical significance is as follows: * P ≤ 0.05, ** P ≤ 0.01, *** P ≤ 0.001.
Figure 6:
Figure 6:. STm infection inhibits IFNβ signaling in a TLR4-dependent manner.
(A-D) RAW-Lucia ISG-KO-IRF3 cells were pretreated with 50 ng/ml LPS for the indicated time points followed by stimulation with either (A, B) 200 pg/ml IFNβ or (C, D) 500 pg/ml IFNγ for 30 minutes. Whole cell lysates were collected and immunoblotted for pSTAT1, STAT1, and β-actin. Band densities were normalized to either STAT1 or β-actin as indicated. Densitometric ratios are shown relative to respective −LPS +IFNβ or −LPS +IFNγ control. Each blot is representative of 3 independent infections, and individual data points (B, D) indicate independent experiments. (E, F) BMDMs were infected with STm at MOI 3 for 30 min followed by 1 hour 100 μg/ml gentamicin chase. Cells were incubated for an additional 30 min or 60 min followed by 200 pg/ml IFNβ stimulation for 30 min (all in the presence of 20 μg/ml gentamicin). This results in 90 minutes and 120 minutes post-infection time points. Whole cell lysates were collected and immunoblotted for pSTAT1, STAT1, and β-actin. Band densities were normalized to either STAT1 or β-actin as indicated by equation in methods section. Blot is representative of 3 independent infections, and individual data points (F) indicate independent experiments. Statistical analyses are one sample t and Wilcoxon test where each ratio is compared to 1. Statistical significance is as follows: ** P ≤ 0.01, *** P ≤ 0.001, **** P ≤ 0.0001.

Similar articles

References

    1. Pang T, Bhutta ZA, Finlay BB, Altwegg M. Typhoid fever and other salmonellosis: a continuing challenge. Trends in Microbiology. 1995;3(7):253–255. doi:10.1016/S0966-842X(00)88937-4 - DOI - PubMed
    1. Liu SL, Ezaki T, Miura H, Matsui K, Yabuuchi E. Intact motility as a Salmonella typhi invasion-related factor. Infect Immun. 1988;56(8):1967–1973. - PMC - PubMed
    1. Galán JE, Curtiss R. Cloning and molecular characterization of genes whose products allow Salmonella typhimurium to penetrate tissue culture cells. Proceedings of the National Academy of Sciences. 1989;86(16):6383–6387. doi:10.1073/pnas.86.16.6383 - DOI - PMC - PubMed
    1. Hapfelmeier S, Stecher B, Barthel M, et al. The Salmonella Pathogenicity Island (SPI)-2 and SPI-1 Type III Secretion Systems Allow Salmonella Serovar typhimurium to Trigger Colitis via MyD88-Dependent and MyD88-Independent Mechanisms1. The Journal of Immunology. 2005;174(3):1675–1685. doi:10.4049/jimmunol.174.3.1675 - DOI - PubMed
    1. Raffatellu M, Wilson RP, Chessa D, et al. SipA, SopA, SopB, SopD, and SopE2 Contribute to Salmonella enterica Serotype Typhimurium Invasion of Epithelial Cells. Infection and Immunity. 2005;73(1):146–154. doi:10.1128/iai.73.1.146-154.2005 - DOI - PMC - PubMed

Publication types